I completed a variety of autosomal (atDNA) tests from various genealogy companies to determine if I could find unknown living genetic relatives and to provide additional information on our common ancestors.
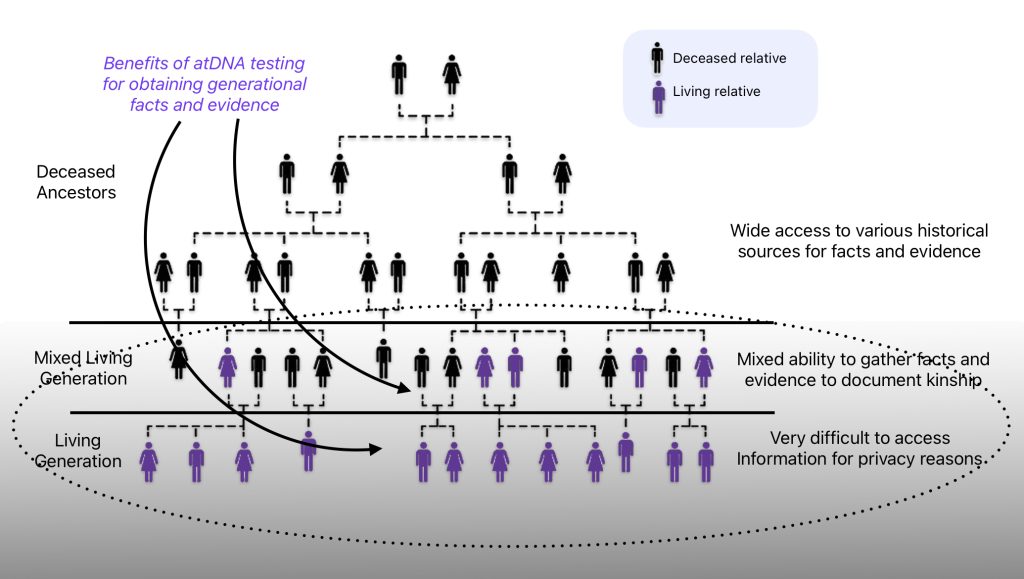
Autosomal DNA testing can accurately trace ancestry back approximately 5-6 generations and provide information on living relatives. These tests can provide added information and facts on completing family trees for generations that contain both living and deceased relatives and the younger generations that virtually contain all living relatives.
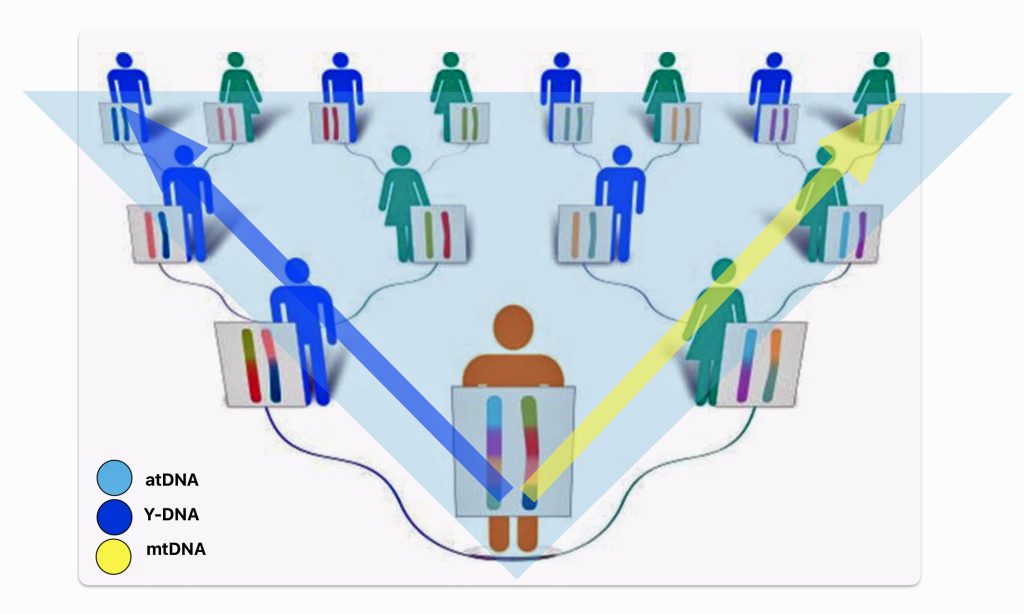
Illustration One: Benefits of atDNA Testing
There are different strategies for comparing DNA results from different companies. [1] I simply took atDNA tests from each of the sampled companies to compare differences in estimating ethnicity descent results and to determine if here were any matches with unknown living genetic relatives in each of their respective DNA databases.
I have completed atDNA tests with the following DNA companies: ancestry.com (AncestryDNA), 23andMe, LivingDNA, FamilyTreeDNA, and CriGenetics. [2] The most promising results were obtained from AncestryDNA and 23andMe.
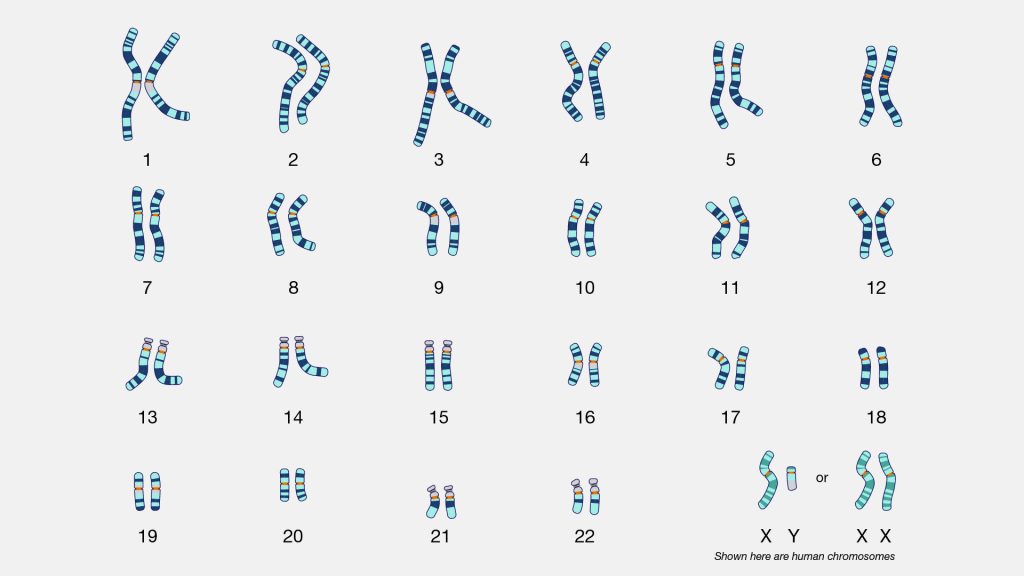
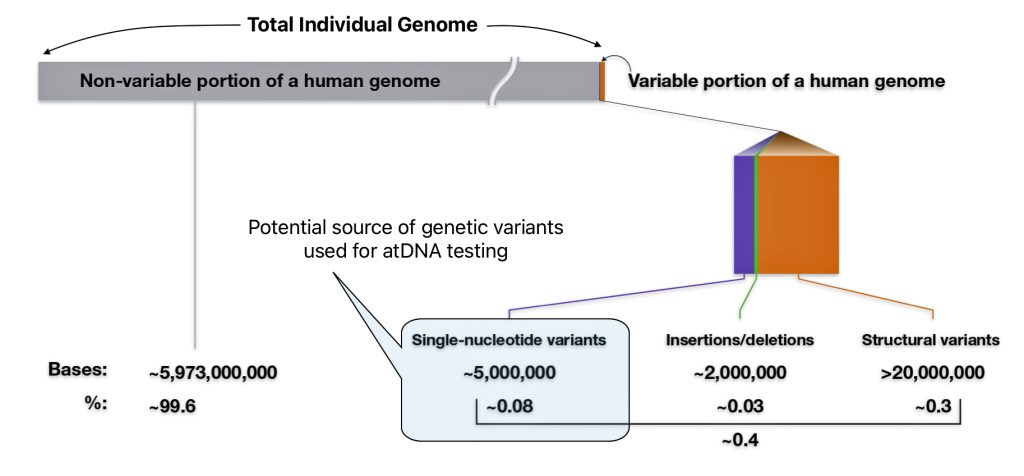
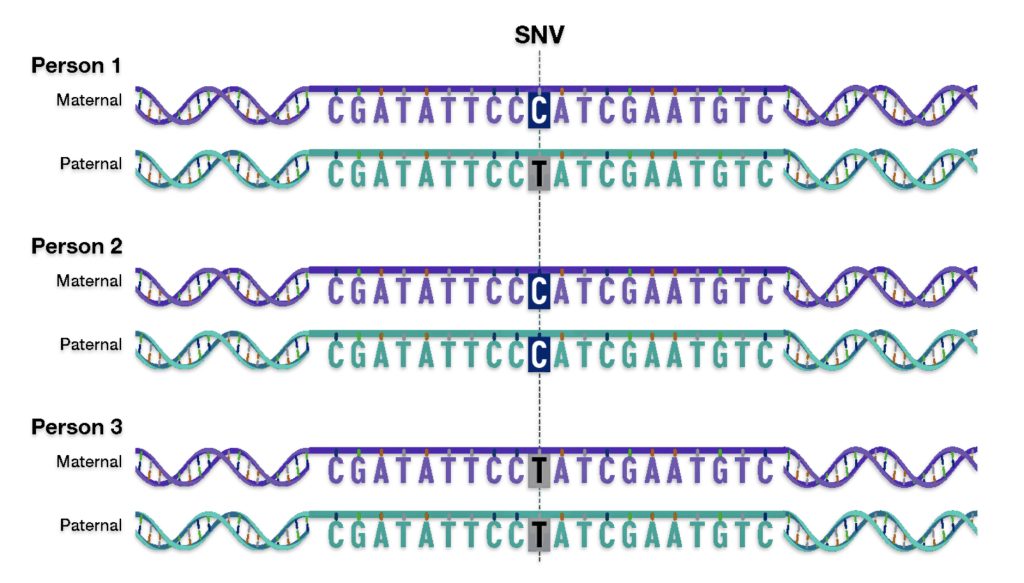
As indicated in the first part of this story, the DNA companies analyze hundreds of thousands of single nucleotide polymorphisms (SNPs) across the 22 autosomal chromosomes. These SNPs are specific locations in the genome where genetic variation commonly occurs between individuals. The companies use different proprietary algorithms and imputation methods to analyze the DNA. The DNA match results can vary between companies based on the software and micro chip technology utilized, the selection and number of SNPs tested, and the size of company’s database .
The atDNA tests may result in hundreds of ‘matches’. Each of the companies compare the SNP data between two individuals to identify segments of DNA that appear to be identical. These matching segments indicate DNA that are likely to be inherited from a common ancestor. [3]
The length of matching SNP segments is measured in centimorgans (cM). (See illustration two below.) [4] The amount of shared cMs is compared to expected ranges for different relationships to predict how two people may be related. Close relationships like parent/child or full siblings have very distinct amounts of shared DNA, while more distant relationships have overlapping ranges or shared DNA or cMs.
Illustration Two: CentiMorgans in a Physical Map
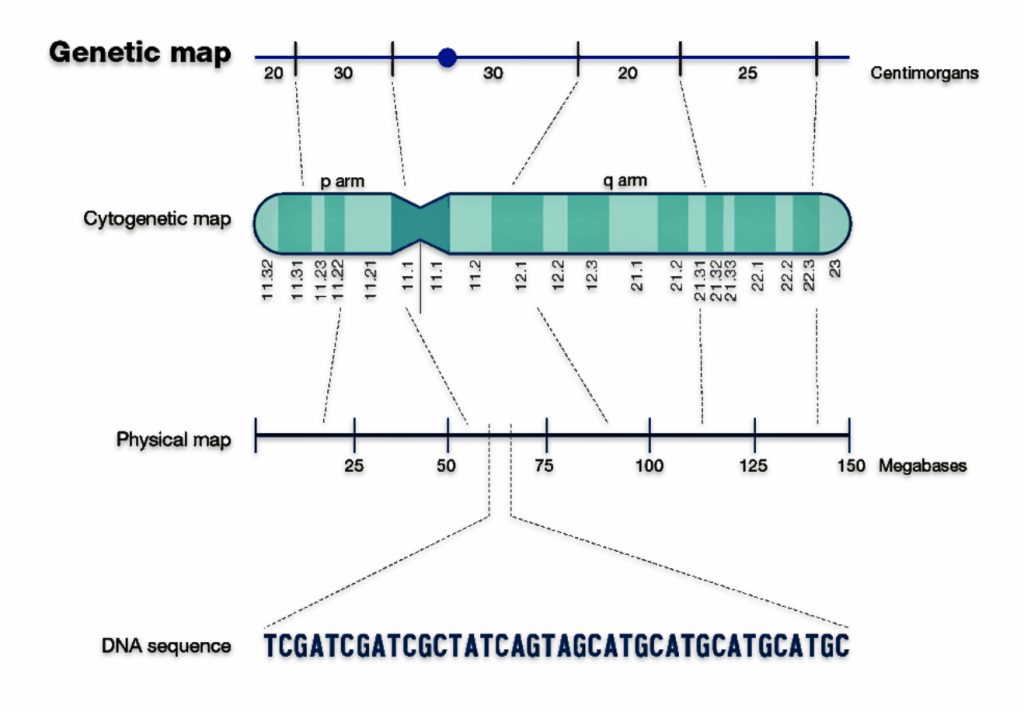
Where the individual being tested, such as myself, has a number of shared SNPs and a number of consecutive SNPs in common with another tested individual in the company’s database, it can be inferred that we share a segment of DNA at that part of our respective genomes. If the segment is longer than a threshold amount set by the testing company, then we are considered to be a match. [5]
Clarifying Relationships: The Number of Shared cMs and Length of cMs
Two central or key statistics for interpreting atDNA matches are the number of shared cM segments and the length of the shared cM segments (or the percentage of the genome that is shared). When looking at atDNA comparisons, the “shared cM” is the total length of the DNA one shares with another person. The “shared segments” are how many blocks the matching atDNA is broken into. Longer block segments generally indicate a closer relationship. Companies set minimum thresholds for segment length and total shared DNA to be considered a match. [6]
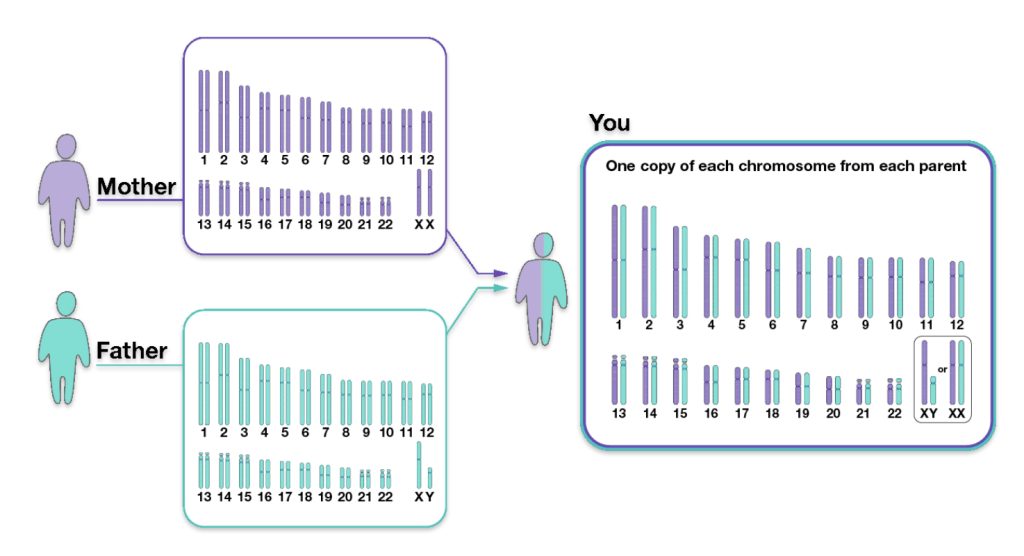
To put the concept of cMs in perspective, an individual typically receives approximately 3,400-3,700 cMs from each biological parent. Each person has about 6,800 cMs in total. [7]
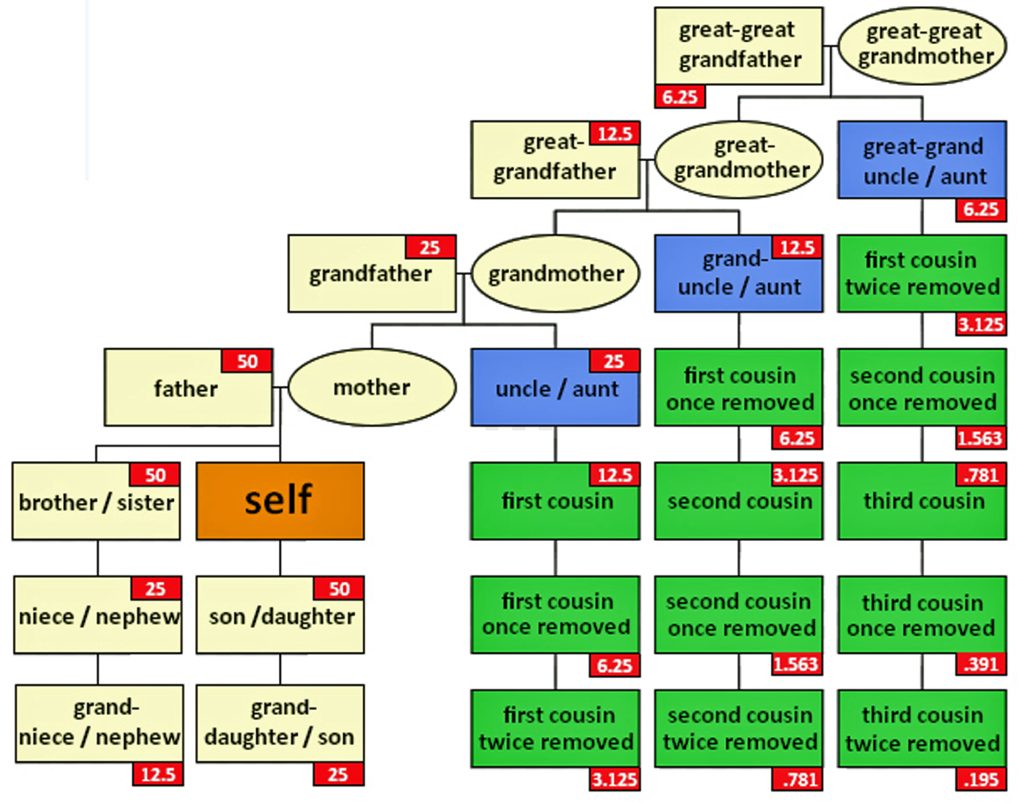
As indicated in the first part of this story, the random nature of genetic inheritance leads to variability in how much DNA is shared through successive generations. This is known as variable expressivity. [8] When moving through successive generations, the amount of DNA inherited from each ancestor roughly halves with each generation, meaning you inherit approximately 50% from your parents, 25% from each grandparent, 12.5% from each great-grandparent, and so on. As you move further back in generations, the percentage of DNA inherited from each ancestor decreases exponentially.
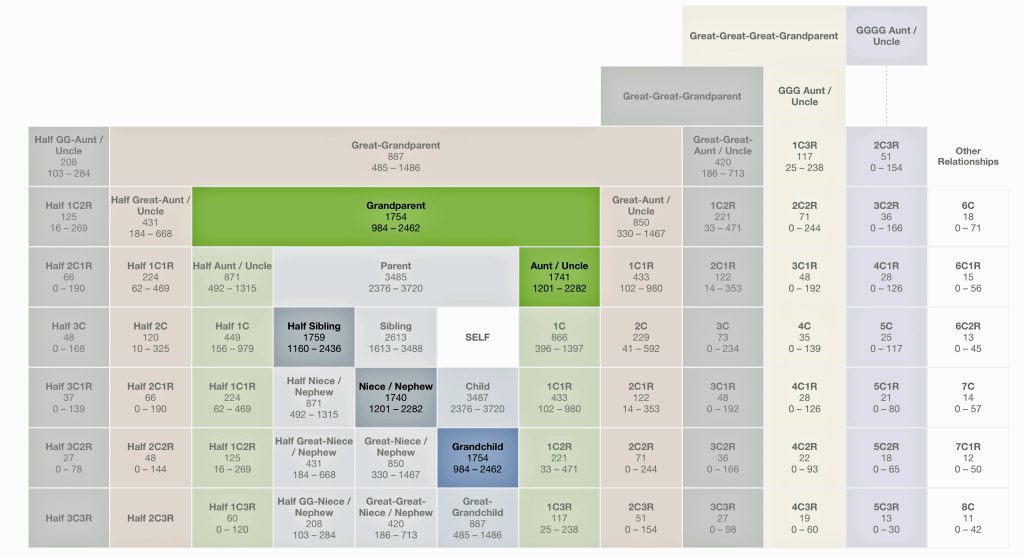
The process of genetic recombination during meiosis ensures that the exact DNA segments inherited from each parent are randomized, leading to variation even between siblings in the next generation. [9] For example, full siblings may share anywhere from about 35% to 65% of their DNA or 1613 cMs to 3488 cMs. First cousins typically share around 12.5% of their DNA or about 866 cMs but the actual range can vary significantly between 396 to 1397 cMs. This variability increases with more distant relationships, making it harder to precisely determine the degree of relatedness based solely on shared atDNA percentages.
“(S)ome genuine genealogical third cousins will not show up as a match because, although both cousins will have inherited DNA from their common ancestors they do not share any overlapping DNA segments. Beyond about five or six generations we will have some genealogical ancestors with whom we share no DNA. They are our genealogical ancestors but not our genetic ancestors. If we go back 450 years we have over 32,000 genealogical ancestors but we will have DNA from only around 1000 of these ancestors.” [10]
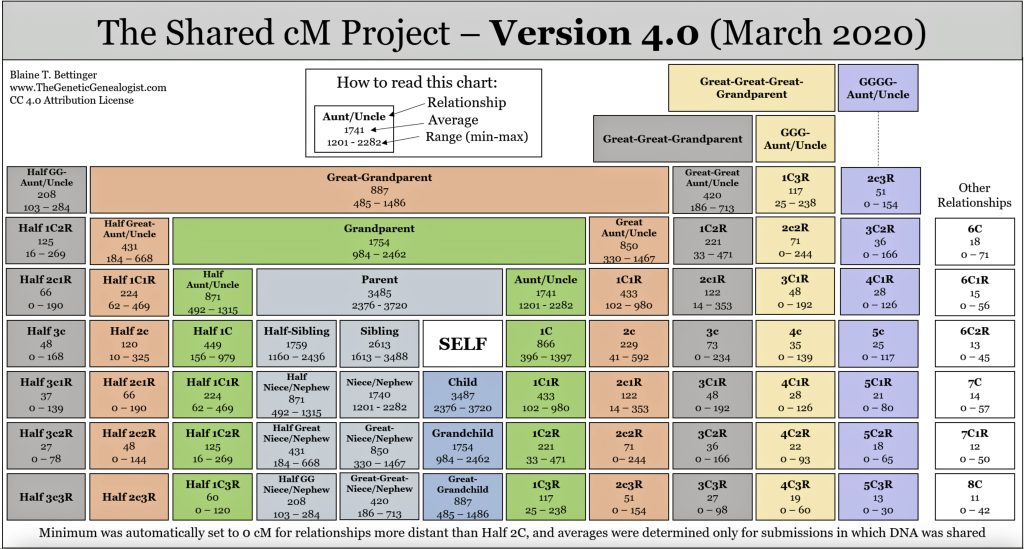
The diminishing amount of cMs shared with relatives can be depicted in charts that display information using centimorgans. A notable “shared cM chart,” which is used to visualize the likelihood of a relationship based on the amount of shared DNA measured, is called the “The Shared cM Project 4.0 tool chart”. It can be accessed through the DNA Painter platform. [11] (See illustration three.)
Illustration Three: Chart of Matching Relationships and Their Respective Average cM and Ranges of cMs to an atDNA Tester
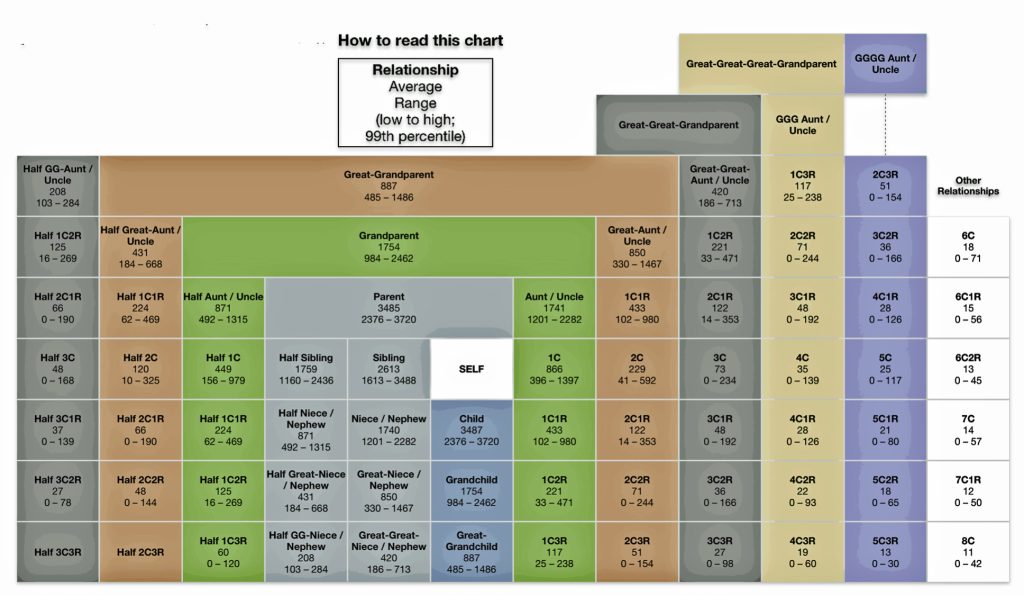
The Shared cM Project 4.0 tool chart graphically illustrates the range of cMs and overlap that are associated with specific genetic relationships. The chart provides information on the average cMs and the range of cM values from low to high for each genetic relationship. The values are derived from a collaborative data collection and analysis project created to understand the ranges of shared cMs associated with various known relationships. Version four of this project is based on shared cM data for nearly 60,000 known relationships. [12]
The Shared cM Project is a collaborative data collection and analysis project that helps genealogists understand potential relationships between DNA matches based on shared genetic material. The project was created by Blaine Bettinger to understand the ranges of shared centimorgans (cM) associated with various known family relationships. The table one below indicates the range of cMs that are associated with ten groupings of relationships that were part of the Shared cM Project. [13] The table provides the number of samples in each group and the average value, min and max values, the standard deviation (which can be used to determine the frequency curve of the values), and the expected cM value for each group.
Table One: Centimorgan Groupings by Relationship in the Shared cM Project
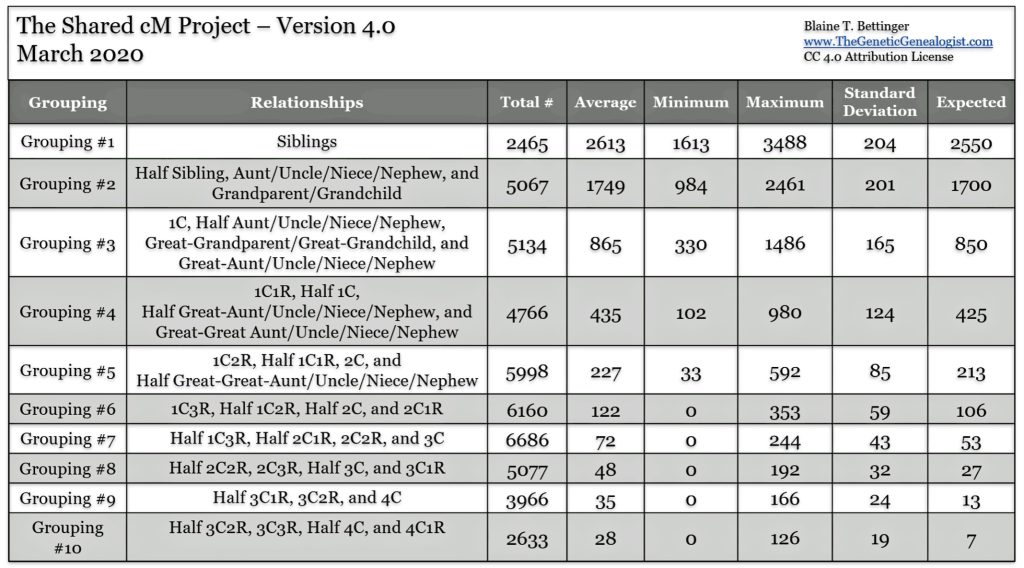
https://thegeneticgenealogist.com/wp-content/uploads/2020/03/Shared-cM-Project-Version-4.pdf
The following example (illustration four) depicts the variability of inheriting autosomal DNA and the utility of using the number of shared cM segments and the length of the shared cM segments to determine possible relationships. Illustration four below shows 22 lines that symbolize the 22 autosomal chromosomes that were inherited from one parent for a fictitious person. The darker color in each of the lines represents the segments of cMs that were inherited from the parent. In this example, the person has inherited 3524 cMs and 22 segments from one parent. The individual has inherited 22 segments in 22 chromosomes. They are really long segments. In fact, 16 of the 22 segments reflect entire chromosomes. In addition, the child inherited 3524 cMs, well within the cM range of 2400 – 3700 cMs for a parent – child relationship, as depicted in table one.
Illustration Four: Example of Inherited cMs from One Parent
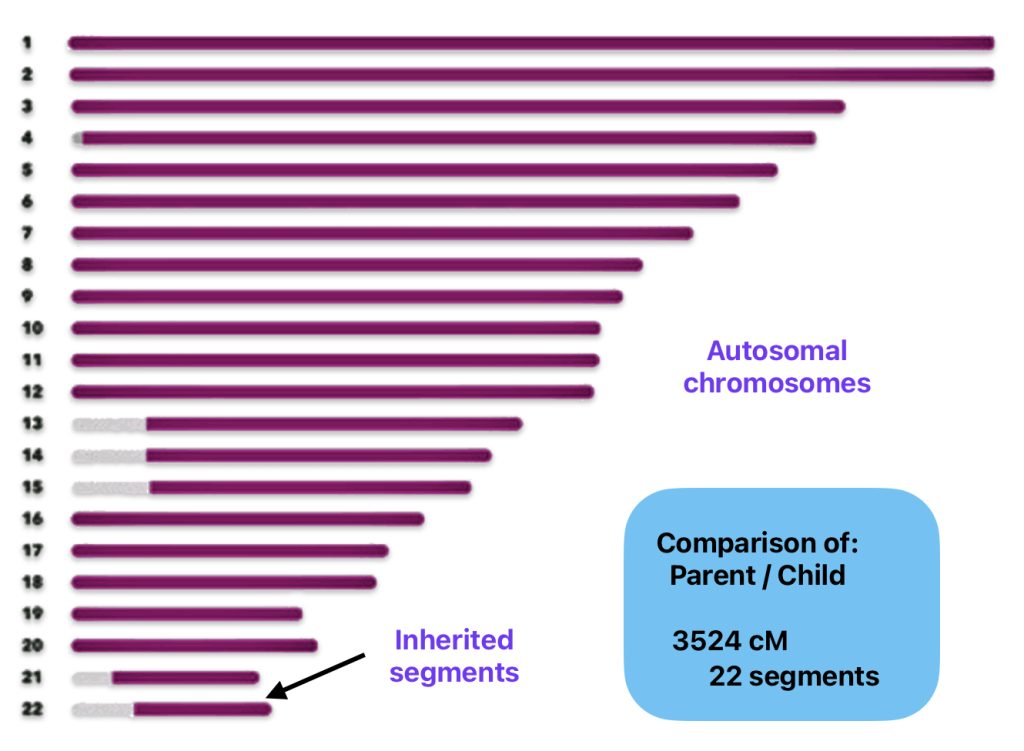
Illustration five below is an example of a grandparent – grandchild match for the same person (the grandchild). In the example, the number of shared segments is very similar to the number shared segments found in illustration three with the parent. In fact there is one more segment than that found in the parent relationship. However, the length of the segments are all shorter than the segments shared between parent and child. In addition, the total number of cMs are significantly less than that found with the parent.
Illustration Five: Example of Inherited cMs from One Grandparent

The total number of centimorgans that an atDNA tester shares with a match is typically a good indicator of how closely related they are to someone else. However, shared cMs cannot always indicate exactly how that tester is related to a match. Different types of relationships may share similar amounts of DNA.
In the grandparent – grandchild example above, the furthest back you might need to go to find common ancestors for a match of 1518cM is the grandparent level. If you are uncertain of the actual relationship of the match and limited to just reading the cM results of a test, the connection may be closer. Depending on the tester’s family, this match could be a close younger generation relative, such as the descendant of the tester’s sibling if he or she had one or more siblings.
Based on the ranges of cMs associated with specific family relationships, 1518 cMs could point to a grandparent, aunt or uncle, a half sibling, a niece or nephew or a grandchild. This is illustrated by plugging in the 1518 cM value in the Shared cM Project 4.0 tool. (See illustration six).
Illustration Six: Expected Relationships Based on Shared cMs
Comparison of Results from Different DNA Companies
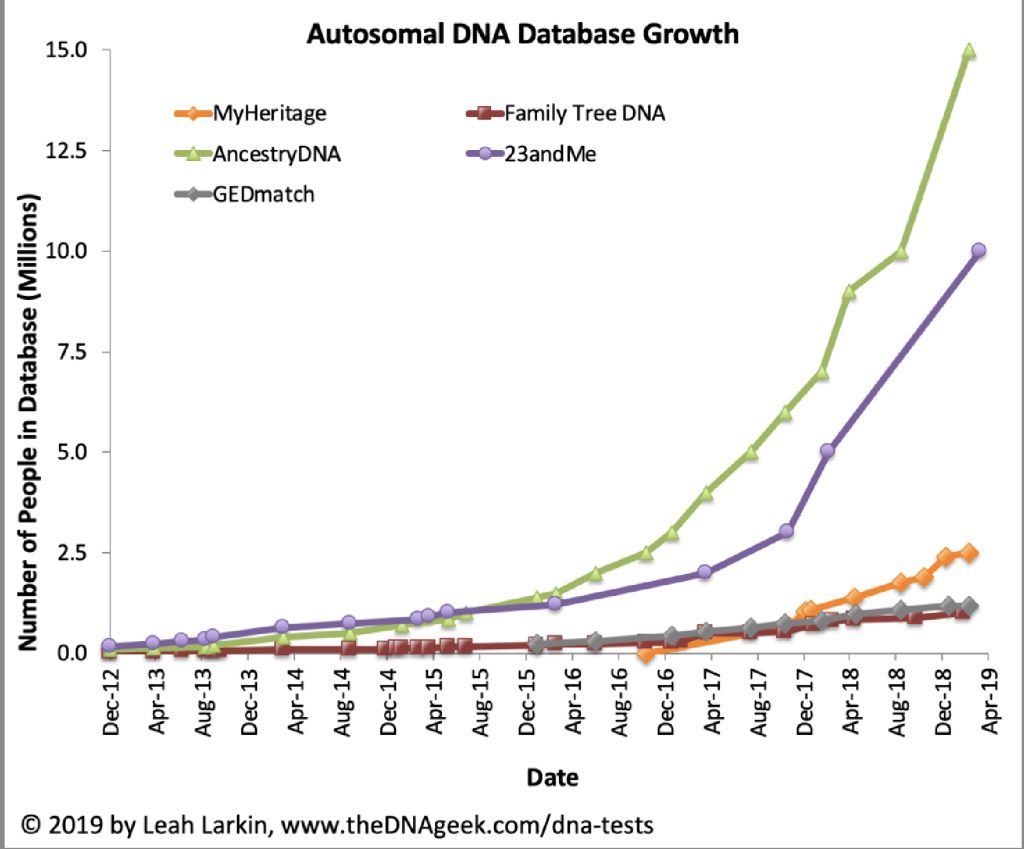
As indicated in the first part of this story, my experience with atDNA tests have largely resulted in the initial discovery of many living second and third generational cousins. This fact alone is amazing. However, many of the matches fail to document their respective lines of descent. The lack of this additional genealogical information makes it difficult to document where our common distant family connections are located.
The ability to analyze and comprehend the sheer number of autosomal DNA matches from the various DNA tests is daunting. As reflected in table two, there are thousands of ‘possible’ matches based on my atDNA results provided by four DNA companies..
Table Two: Number of atDNA Matches for My Test Results by DNA Company
| DNA Company | Number of Genetic Matches with Shared DNA | Maximin cM Match Value | Minimum cM Match Value |
|---|---|---|---|
| Ancestry DNA | 17,118 | 3479 | 8 |
| 23andMe | 1,500 | 1586 [14] | 16 |
| FamilyTreeDNA | 3,639 | 49 | 7 |
| LivingDNA | 302 | 43 | 11 |
Testing companies compare your DNA profile to their database of test results from other customers. They search for other individuals who share significant DNA segments with you. Each company has specific threshold values associated with cMs and cM length. (See table four in the first part of this story.) [15] The size and pattern of shared DNA is used to predict the likely relationship. Relationships are typically detected confidently for third cousins or closer, with decreasing probability for more distant relations.
Depending on the DNA company, as reflected in table three, the predicted relationship is depicted by different measures: the total percentage of shared DNA, the number of shared segments, the length of the shared segments, the longest block of cMs. Different companies may also provide slightly different relationship estimates due to variations in their testing algorithms and reference databases. Despite the different presentation of match results, comparing results between different compamies is possible.
Table Three: Type of Matching Results Provided by DNA Company
| DNA Company | Total cMs | Percent of cMs Shared | Number of Shared Segments | Longest cM Block |
|---|---|---|---|---|
| AncestryDNA | X | X | ||
| 23andMe | X | X | ||
| FamilyTreeDNA | X | X | ||
| LivingDNA | X | X | X |
Separating the Wheat from the Chaff
It would be very tedious to comb through all of the matches identified by the four DNA companies. I also believe the majority of match results will not yield many true matches. There is a need to utilize filtering criteria to reduce the large number of potential matches to a manageable number and focus on matches that may lead to legitimate family relationships.
Based on my review of research strategies associated with autosomal testing, I have employed two criteria in recursive order. The first involves establishing a cut off value for cMs shared. The second criteria is focusing on matches that provide family tree information.
Many researches have documented that it was less likely of discovering a kinship relationship with match cases that shared less than 15 cMs. [16]
“While it may seem at first that all shared segments of DNA could constitute genealogical evidence, unfortunately some small segments are … creating “false positive” matches for reasons other than recent ancestry. These segments sometimes match because of lack of phasing, phasing errors, or a variety of other reasons. One thing, however, is clear: there is no debate in the genetic genealogy community that many small segments are false positive matches. There IS debate, however, regarding the rate of false positive matches, and what that means for the use of small segments as genealogical evidence.“ [17]
Most people are unable to trace all of their ancestral lines back ten generations or beyond. The common ancestral couple cannot therefore be identified through atDNA testing. Even if a shared ancestral couple can be identified, without tracing all the other ancestral lines in your family tree you cannot eliminate the possibility of shared ancestry on other as yet undocumented lines. [18]
Many matches under 15 cMs will share ancestry more than five or more generations ago and will be mostly beyond the reach of genealogical records. Therefore, I have summarily eliminated matches that are 15 cMs or less. Based on estimates derived from the Shared cM Project Tool, a match of 15cM has a wide range of remote, possible relationships. (See illustration sseven.) The connection may be within 4th-Great-Grandparent level, but the common ancestors could also be more generations back. [19]
illustration Seven: Expected Relationships Based on 15 Shared cMs or Less

There are other professional genealogists, such as Blaine Bettinger, that lower the bar to above 5 cMs.
“(T)he very first thing I do with the spreadsheet is sort it by size and delete every segment smaller than 5 cM. For me, there is too much uncertainty surrounding small segments to base any conclusion on them.” [20]
“I call small segments (which I usually classify as 5 cM or less) as POISON because it is currently impossible to decipher between which are real segments and which are not.” [21]
According to population genetics theory all individuals have common ancestry in the distant past, and we all have what are called short, old IBD segments in common. [22] Identity By Descent (IBD) segments are stretches of DNA that two or more individuals have inherited from a common ancestor without any recombination occurring within that segment. The probability of an IBD segment persisting decreases exponentially over generations due to recombination. [23]
In general, the larger the shared segments the more likely that the match is valid. Valid segments under 7 cM cannot be reliably detected with the currently available genetic genealogy tests. [24]
For the purposes of genetic genealogy the focus is on detecting large IBD segments within a genealogical timeframe (effectively within the last ten generations) where there is a possibility of identifying the common ancestor through documentary records. In general terms, the larger the segment the closer the relationship, but the frequency of the segment also needs to be taken into account. High-frequency IBD segments are more likely to be a signal of distant sharing at the population level whereas a segment that is only observed in two independently sampled individuals is more likely to be IBD. [25]
“Although there is only a low chance of sharing enough DNA with a specific distant cousin for the relationship to be detected, we have a large number of distant cousins and so many of these more distant cousins will appear in our match lists.” [26]
The following table four shows the expected number of cousins at different degrees of relationship, the expected amount of cMs for each degree of cousin and the percent of detecting the relationship. [27]. The trend indicates an high probability or even chance of discovering first through fourth cousins. This would imply matches above 60 cM are less likely to be influenced by false positive matches and matches between 15 and 60 have a ‘fifty-fifty’ chance of being real or reflect the back ground noise of distance common ancestors.
Table Four: Chance of Detecting Cousins
| Degree of Cousin | Expected Amount of IBD (cM) | Percent Chance of Detecting |
|---|---|---|
| First | 900 | 100% |
| Second | 225 | 100% |
| Third | 56 | 88.7 |
| Fourth | 14 | 45.9 |
| Fifth | 3.5 | 14.9 |
| Sixth | 0.88 | 4.1 |
| Secventh | 0.22 | 1.1 |
| Eighth | 0.055 | 0 |
| Nineth | 0.014 | 0 |
| Tenth | 0.0034 | 0 |
As reflected in table five, my match results from the four DNA companies have isolated 3,047 matches above the 15 cM level. This number of potential matches is still unreasonable to comb through and assess their fruitfulness of establishing a genetic relationship. I considered initially tightening the cM limit to 90 cMs.
Table Five: Number of Genetic Matches Based on cMs
| Company | 10 cM & Less | 15-11 cm | 15-89 | Greater than 90 |
|---|---|---|---|---|
| AncestryDNA | 9850 | 6515 | 760 | 9 |
| 23andMe | 0 | 0 | 1496 | 4 |
| FamilyTreeDNA | 1185 | 1939 | 515 | 0 |
| LivingDNA | 4 | 35 | 263 | 0 |
| Total | 11039 | 8489 | 3034 | 13 |
The furthest back you might need to go to find common ancestors for a match of 90cM is 4th-Great-Grandparent level or generation 7 on your pedigree chart. [28]
Once I have assessed the fruitfulness of establishing a kinship relation with matches above 90 cMs, I figure I can look at the other matches at successive lower cM levels.
The second filtering criteria that I have used is the availability of family tree information found with specific matches over 90 cMs. As indicated in table six below, three of the four DNA companies that I have completed atDNA tests provide the ability or option to either add family tree information or, at the minimum, family surnames.
Table Six: The Option to Add Family Tree or Surname Information with atDNA Results
| Company | Family Tree Infor- mation | Family Sur- names Infor- mation | Parents’s Birth- place | Grand- parents’ Birth- place | Other ancestors’ birth- place | Identify Common Ancestor |
|---|---|---|---|---|---|---|
| AncestryDNA | Yes | Yes | * | * | * | Yes |
| 23andMe | Yes | Yes | Yes | Yes | Yes | |
| FamilyTree DNA | Yes | Yes | * | * | * | Yes |
| LivingDNA | No | No | No | No | No | No |
My AncestryDNA and 23and Me Matches: Close Family
The largest group of match results and the largest number of confirmed matches is from AncestryDNA. As of October 2024, the atDNA results in the AncestryDNA data base identified 854 possible matches on both sides (paternal and maternal) of my family. Of those 854, there are four DNA testers that are identified as ”Close Family”. An additional five are identified as “Extended Family”. The remaining 845 matches are categorized as “Distant Family”. [29]
In the early 2000’s, based on my suggestions, my father and paternal aunt completed autosomal tests. More recently, my aunt’s grandson, also completed an AncestryDNA test. As depicted in illustration seven, their results confirm their respective genetic ties to me.
Illustration Eight: My Results from AncestryDNA

The DNA results for my father confirmed the accuracy of the DNA testing process. The range of matching cMs associated with my match with my father corresponds with the cM range of parent/child. [30] The match results for my paternal aunt also confirm the accuracy of the atDNA match for aunt/uncle. (See illustration nine.)
Illustration Nine: Average cMs for an Aunt

The results for James were also spot on as my first cousin once removed (the son of one of my first cousins).
Illustration Ten: Average cMs for a First Cousin Once Removed
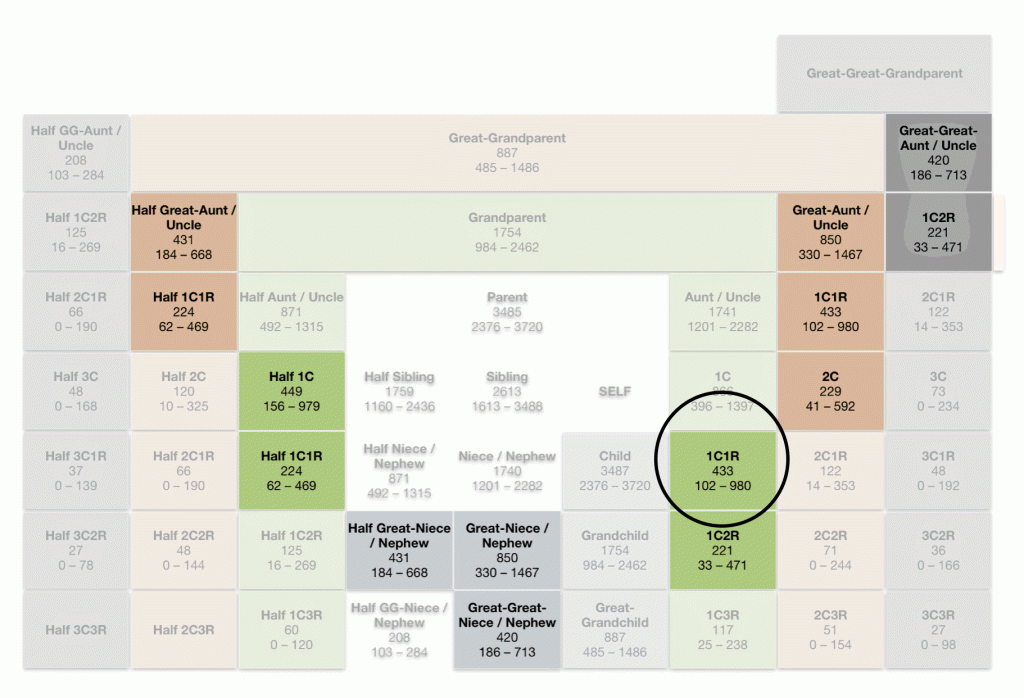
The filtering match displays for AncestryDNA and 23andMe are a bit different. While AncestryDNA provides total shared cMs and the percent of shared DNA, 23andMe provides percent of DNA shared and number of shared segments. There are two ways to convert 23andMe matches to centimorgans (cMs). You can use the Shared cM Project tool at DNA Painter and enter the percentage of shared DNA in the percentage box on the online tool. The tool will show you the number of cMs. [31]
If I use the 90 cM are an initial cut off for viewing matches, I need to convert percent shared cMs to an estimate of the amount of cMs shared.
There were two 23andMe matches that were above the 90 cM filtering criteria. The first was Christopher G who shared an estimated 641 cMs or 8.62 percent of shared cMs with me. As indicated in illustration eleven, 23andMe predicted that Christopher is my first cousin once removed. The second match was with Alexandra G. who shared an estimated 494 cMs or 6.64 percent of shared cMs with me. 23andMe predicted that Alexandra is my second cousin.
Illustration Eleven: 23andMe Close Family Matches

Utilizing the Shared cM Project tool for Christopher’s 8.62 percent shared cMs and Alexandra’s 6.64 percent indicates that the furthest back I might need to go to find common ancestors for each match is my 2nd-Great-Grandparent level or generation 5 on my pedigree chart. For Christopher.
As indicated in table seven, the inputted cM values in the Shared cM Project Tool also predict that there is a57 percent chance that Chritopher is my first cousin once removed. The inputted cM values in the Shared cM Project Tool predict that there i a 90 percent chance that Alexandra is my first cousin once removed, contrary to 23andMe’s prediction.
Table Seven: Probability of Expected cM Relationship based on Percentage of Shared DNA
| Match | Percent of Shared DNA | Probability of Relationship | Expected Relationship |
|---|---|---|---|
| Christopher | 8.62% | 57% | 2Great-Aunt /Uncle, Half Great-Aunt Uncle Half 1C 1C1R Half Great-Niece/ Nephew Great-Great-Niece Nephew |
| Christopher | 8.62% | 43% | Great-Grandparent Great-Aunt/Uncle Half Aunt/Uncle 1C Half Niece/Nephew Great-Niece/Nephew Great-Grandchild |
| Alexandra | 6.64% | 90 % | Great-Great-Aunt/Uncle Half Great-Aunt Uncle Half 1C 1C1R Half Great-Niece/Nephew 2 Great Niece/Nephew |
Both Christopher and Alexandra are son and daughter respectively of one of my paternal cousins. As such, they are both first cousins once removed.
Continuation
A continuation of my discussion of atDNA matches continues in the next part of “Ongoing Discoveries from Autosomal DNA Tests”. The continuation will discuss AncestryDNA “extended family” matches and 23andMe match results.
Sources
Feature Image: An amalgam of three different images: (1) The network image of individuals is from Woodbury, Paul, “Who Is This?” 6 Steps to Determine Genetic Relationships of Your DNA Matches, April 2019, LegacyTree Genealogists, https://www.legacytree.com/blog/determine-genetic-relationships . (2) The Colorized chart from Johny Perl, Introducting the updated shared cM tool, 27 Mar 2020, DNA Painter Blog, https://dnapainter.com/blog/introducing-the-updated-shared-cm-tool/ and (3) A Diagram depicting the relationship of a third cousin from 23andMe..
[1] Estes, Roberta, DNA Testing and Transfers – What’s Your Strategy?, 9 Apr 2019 , DNAeXplained – Genetic Genealogy, https://dna-explained.com/2019/04/09/dna-testing-and-transfers-whats-your-strategy/
Estes, Roberta, Comparing DNA Results – Different Tests at the Same Testing Company, 18 May 2023, DNAeXplained – Genetic Genealogy, https://dna-explained.com/2023/05/18/comparing-dna-results-different-tests-at-the-same-testing-company/
[2] With the exception of CriGenetics, each of the companies provide atDNA matches that correspond to family relationships within six geneations. I did not purchase the ‘premium’ level of testing with CriGenetics which included possible DNA matches from their database.
[3] Autosomal DNA Statistics, International Society of Genetic Genealogy Wiki, , This page was last edited on 17 October 2022, https://isogg.org/wiki/Autosomal_DNA_statistics
Our Autosomal DNA Test (Family Finder™), FamilyTreeDNA Help Center, https://help.familytreedna.com/hc/en-us/articles/4411203169679-Our-Autosomal-DNA-Test-Family-Finder
[4] Centimorgan, Wikipedia, This page was last edited on 1 May 2024,https://en.wikipedia.org/wiki/Centimorgan
Centimorgan, National Human Genome Research Institiue, https://www.genome.gov/genetics-glossary/Centimorgan
centiMorgan, International Society of Genetic Genealogy Wiki ,This page was last edited on 15 August 2024, https://isogg.org/wiki/CentiMorgan
[5] Estes, Roberta, Concepts – CentiMorgans, SNPs, and Pickin’ Crab, 30 Mar 2016, DNAeXplained – Genetic Genealogy, https://dna-explained.com/2016/03/
Autosomal DNA match thresholds, International Society of Genetic Genealogy Wiki, This page was last edited on 31 August 2024, https://isogg.org/wiki/Autosomal_DNA_match_thresholds
[6] Autosomal DNA Statistics, International Society of Genetic Genealogy, This page was last edited on 17 October 2022, https://isogg.org/wiki/Autosomal_DNA_statistics
Fully identical region, International Society of Genetic Genealogy, This page was last edited on 1 April 2022, https://isogg.org/wiki/Fully_identical_region
Half-identical region, International Society of Genetic Genealogy, This page was last edited on 2 June 2017, https://isogg.org/wiki/Half-identical_region
Identical by descent International Society of Genetic Genealogy, This page was last edited on 14 September 2023, https://isogg.org/wiki/Identical_by_descent
Johny Perl, Introducing the updated shared cM tool, 27 Mar 2020, DNA Painter Blog, https://dnapainter.com/blog/introducing-the-updated-shared-cm-tool/
Autosomal DNA match thresholds, International Society of Genetic Genealogy Wiki, This page was last edited on 31 August 2024, https://isogg.org/wiki/Autosomal_DNA_match_thresholds
Pereira, Rita, Pietro Biroli, Stephanie Von Hinke, Hans Van Kippersluis, Titus Galama, Niels Rietveld, and Kevin Thom. 2022. “Gene-environment Interplay in the Social Sciences.” OSF Preprints. March 4. doi:10.31219/osf.io/d96z3
[7] Nguyen, Tiffany, What’s the difference between shared centimorgans and shared segments? Understanding Genetics, 11 November 2019, The Tech Interactive, https://www.thetech.org/ask-a-geneticist/articles/2019/centimorgans-vs-shared-segments/
[8] What are reduced penetrance and variable expressivity?, MedlinePlus, https://medlineplus.gov/genetics/understanding/inheritance/penetranceexpressivity/
Miko, Iiona, Phenotype variability: penetrance and expressivity. Nature Education 1(1):137 , 2008, https://www.nature.com/scitable/topicpage/phenotype-variability-penetrance-and-expressivity-573/
Expressivity (genetics), Wikipedia, This page was last edited on 9 October 2024, https://en.wikipedia.org/wiki/Expressivity_(genetics)
[9] Genetic Recombination, Wikipedia, This page was last edited on 5 October 2024, https://en.wikipedia.org/wiki/Genetic_recombination
Woodbury, Paul, The Journey of DNA’s Inheritance Paths: X-DNA and Autosomal DNA, LegacyTree, https://www.legacytree.com/blog/x-dna-autosomal-dna-inheritance-paths
Understanding Inheritance, AncestryDNA, https://support.ancestry.com/s/article/Understanding-Inheritance
[10] Autosomal DNA Statistics, International Society of Genetic Genealogists Wiki ,This page was last edited on 17 October 2022,, https://isogg.org/wiki/Autosomal_DNA_statistics
[11] Perl, Johnny, Introducing the updated shared cM tool, 27 Mar 2020, DNA Painter Blog, https://dnapainter.com/blog/introducing-the-updated-shared-cm-tool/
Perl, Johnny, Help: What is DNA Painter?, DNA Painter, https://dnapainter.com/help
Bettinger, Blaine, The Shared cM Project, 29 May 2015, The Genetic Genealogist, https://thegeneticgenealogist.com
Bettinger, Blaine, Version 4.0! March 2020 Update to the Shared cM Project!, The Genetic Genealogist, https://thegeneticgenealogist.com/2020/03/27/version-4-0-march-2020-update-to-the-shared-cm-project/
Bettinger, Blaine, Version 4.0! March 2020 Update to the Shared cM Project!, The full PDF for Version 4.0 of the Shared cM Project ,The Genetic Genealogist, https://thegeneticgenealogist.com/wp-content/uploads/2020/03/Shared-cM-Project-Version-4.pdf
[12] Bettinger, Blaine, Version 4.0! March 2020 Update to the Shared cM Project!, The full PDF for Version 4.0 of the Shared cM Project ,The Genetic Genealogist, https://thegeneticgenealogist.com/wp-content/uploads/2020/03/Shared-cM-Project-Version-4.pdf
[13] Ibid, Page 7
[14] 23andMe provides their match results in two forms: percentage of DNA shared and the number of cM segments. There are two ways to convert 23andMe matches to centimorgans (cM), you can use the Shared cM Project tool at DNA Painter:
- Go to the Shared cM Project tool at DNA Painter
- Enter the percentage of shared DNA in the percentage box
- The tool will show you the cMs
Bettinger, Blaine,, The Shared cM Project 4.0 Tool v4, Mar 2020, DNA Painter, https://dnapainter.com/tools/sharedcmv4
You can also use a ‘quick and dirty’ approach to convert the percentage into centimorgans by just multiplying your percentage by 68.
Cooke, Lisa, What’s a CentiMorgan, Anyway? How DNA Tests for Family History Measure Genetic Relationships, 23 Oct 2017, Genealogy Gems, https://lisalouisecooke.com/2017/10/23/genetic-relationships-centimorgans/
[15] Autosomal Match Thresholds, International Society of Genetic Genealogists Wiki, This page was last edited on 31 August 2024, https://isogg.org/wiki/Autosomal_DNA_match_thresholds
[16] Bettinger, Blaine, Small Matching Segments – Friend or Foe?, The Genetic Genealogist, https://thegeneticgenealogist.com/2014/12/02/small-matching-segments-friend-foe/
[17] One source indicates that any match with 15 cM has a 60 percent chance of being a sixth cousin, sixth cousin once removed, fifth cousin, sixth cousin twice removed, fourth cousin once removed, fifth cousin once removed, seventh cousin, half third cousin twice removed, fourth cousin twice removed, fifth cousin twice removed, seventh cousin once removed, third cousin three times removed, fourth cousin three times removed, fifth cousin three times removed, eighth cousin, and more distance relationships.
See: Bettinger, Blaine,, The Shared cM Project 4.0 Tool v4, Mar 2020, DNA Painter, https://dnapainter.com/tools/sharedcmv4
Another source indicates that there is a remote change of finding a kinship tie with a match at 14 cM or less.
See: Henn, Brenna M, Hon L, Macpherson JM, Eriksson N, Saxonov S, Pe’er I, et al. (Apr 3 2012) Cryptic Distant Relatives Are Common in Both Isolated and Cosmopolitan Genetic Samples. PLoS ONE 7(4): e34267. https://doi.org/10.1371/journal.pone.0034267
Identical by descent, International Society of Genetic Genealogy Wiki, This page was last edited on 14 September 2023, https://isogg.org/wiki/Identical_by_descent
Another source cautions the use of matches less than 5 cMs to avoid false positive results.
See: Bettinger, Blaine, Small Matching Segments – Friend or Foe?, The Genetic Genealogist, https://thegeneticgenealogist.com/2014/12/02/small-matching-segments-friend-foe/
Bettinger, Blaine, The Danger of Distant Matches, 6 Jan 2017, The Genetic Genealogist, https://thegeneticgenealogist.com/2017/01/06/the-danger-of-distant-matches/
For other references, see also:
Identical by descent, International Society of Genetic Genealogy Wiki, This page was last edited on 14 September 2023, https://isogg.org/wiki/Identical_by_descent
Identical by state, International Society of Genetic Genealogy Wiki, This page was last edited on 7 August 2022, https://isogg.org/wiki/Identical_by_state
Autosomal DNA Statistics, International Society of Genetic Genealogy Wiki, https://isogg.org/wiki/Autosomal_DNA_statistics
[18] Identical by descent, International Society of Genetic Genealogy Wiki, This page was last edited on 14 September 2023, https://isogg.org/wiki/Identical_by_descent
[19] Identical by descent, International Society of Genetic Genealogy Wiki, This page was last edited on 14 September 2023, https://isogg.org/wiki/Identical_by_descent
See also:
Ralph P, Coop G (2013). The Geography of Recent Genetic Ancestry across Europe. PLOS Biology 11(5):e1001555. https://journals.plos.org/plosbiology/article?id=10.1371/journal.pbio.1001555
Browning SR, Browning BL. Identity by descent between distant relatives: detection and applications. Annu Rev Genet. 2012;46:617-33. doi: 10.1146/annurev-genet-110711-155534. Epub 2012 Sep 17. PMID: 22994355. https://pubmed.ncbi.nlm.nih.gov/22994355/
Bettinger, Blaine, Small Matching Segments – Friend or Foe?, The Genetic Genealogist, https://thegeneticgenealogist.com/2014/12/02/small-matching-segments-friend-foe/
Bettinger, Blaine, The Danger of Distant Matches, 6 Jan 2017, The Genetic Genealogist, https://thegeneticgenealogist.com/2017/01/06/the-danger-of-distant-matches/
Identical by state, International Society of Genetic Genealogy Wiki, This page was last edited on 7 August 2022, https://isogg.org/wiki/Identical_by_state
[20] Bettinger, Blaine, Small Matching Segments – Friend or Foe?, The Genetic Genealogist, https://thegeneticgenealogist.com/2014/12/02/small-matching-segments-friend-foe/
[21] Bettinger, Blaine, The Danger of Distant Matches, 6 Jan 2017, The Genetic Genealogist, https://thegeneticgenealogist.com/2017/01/06/the-danger-of-distant-matches/
[22] “In genetic genealogy, the identical ancestors point (IAP), or all common ancestors (ACA) point, or genetic isopoint, is the most recent point in a given population’s past such that each individual alive at that point either has no living descendants, or is the ancestor of every individual alive in the present. This point lies further in the past than the population’s most recent common ancestor(MRCA).“
Identical ancestors point, Wikipedia, This page was last edited on 20 October 2024, https://en.wikipedia.org/wiki/Identical_ancestors_point
“We find that a pair of modern Europeans living in neighboring populations share around 2 12 genetic common ancestors from the last 1,500 years, and upwards of 100 genetic ancestors from the previous 1,000 years. These numbers drop off exponentially with geographic distance, but since these genetic ancestors are a tiny fraction of common genealogical ancestors, individuals from opposite ends of Europe are still expected to share millions of common genealogical ancestors over the last 1,000 years. There is also substantial regional variation in the number of shared genetic ancestors.“
Ralph, Peter and Graham Coop, The Geography of Recent Genetic Ancestry across Europe, PLOS Biology 11(5): e1001555. doi:10.1371/journal.pbio.1001555, 2013, https://journals.plos.org/plosbiology/article/file?id=10.1371/journal.pbio.1001555&type=printable
Koonin EV, Wolf YI. The common ancestry of life. Biol Direct. 2010 Nov 18;5:64. doi: 10.1186/1745-6150-5-64. PMID: 21087490; PMCID: PMC2993666. https://pmc.ncbi.nlm.nih.gov/articles/PMC2993666/
[23] Identity by Decent, Wikipedia, This page was last edited on 27 September 2024, https://en.wikipedia.org/wiki/Identity_by_descent
Kecong Tang, Ardalan Naseri, Yuan Wei, Shaojie Zhang, Degui Zhi, Open-source benchmarking of IBD segment detection methods for biobank-scale cohorts, GigaScience, Volume 11, 2022, giac111, https://doi.org/10.1093/gigascience/giac111
Browning SR, Browning BL. Probabilistic Estimation of Identity by Descent Segment Endpoints and Detection of Recent Selection. Am J Hum Genet. 2020 Nov 5;107(5):895-910. doi: 10.1016/j.ajhg.2020.09.010. Epub 2020 Oct 13. PMID: 33053335; PMCID: PMC7553009. https://pmc.ncbi.nlm.nih.gov/articles/PMC7553009/
Ringbauer H, Huang Y, Akbari A, Mallick S, Patterson N, Reich D. ancIBD – Screening for identity by descent segments in human ancient DNA. bioRxiv [Preprint]. 2023 Mar 9:2023.03.08.531671. doi: 10.1101/2023.03.08.531671. Update in: Nat Genet. 2024 Jan;56(1):143-151. doi: 10.1038/s41588-023-01582-w. PMID: 36945531; PMCID: PMC10028887. https://pmc.ncbi.nlm.nih.gov/articles/PMC10028887
Nait Saada, J., Kalantzis, G., Shyr, D. et al. Identity-by-descent detection across 487,409 British samples reveals fine scale population structure and ultra-rare variant associations. Nat Commun 11, 6130 (2020). https://doi.org/10.1038/s41467-020-19588-x
Ringbauer, H., Huang, Y., Akbari, A. et al. Accurate detection of identity-by-descent segments in human ancient DNA. Nat Genet 56, 143–151 (2024). https://doi.org/10.1038/s41588-023-01582-w
[24] Doug Speed and David J. Balding, Relatedness in the post-genomic era:
is it still useful?, Nov 2014, Nature Reviews Genetics | AOP, published online Nov 2014; doi:10.1038/nrg3821, http://dougspeed.com/wp-content/uploads/nrg_relatedness.pdf
Durand EY, Eriksson N, McLean CY. Reducing pervasive false positive identical-by-descent segments detected by large-scale pedigree analysis. Molecular Biology and Evolution advance access publication online 30 April 2014. https://watermark.silverchair.com/msu151.pdf
[25] Browning SR, Browning BL. Identity by descent between distant relatives: detection and applications. Annu Rev Genet. 2012;46:617-33. doi: 10.1146/annurev-genet-110711-155534. Epub 2012 Sep 17. PMID: 22994355. https://pubmed.ncbi.nlm.nih.gov/22994355/
[26] Cousin Statistics, International Society of Genetic Genealogy Wiki, This page was last edited on 27 February 2022, https://isogg.org/wiki/Cousin_statistics
[27] Henn, Brenna M, Hon L, Macpherson JM, Eriksson N, Saxonov S, Pe’er I, et al. (Apr 3 2012) Cryptic Distant Relatives Are Common in Both Isolated and Cosmopolitan Genetic Samples. PLoS ONE 7(4): e34267. https://doi.org/10.1371/journal.pone.0034267
[28] This is the result of inputting 90 cMs into the The Shared cM Project 4.0 tool v4. 90 cMs is approximately equal to 1.21 percent of the total % shared with a match.
Bettinger, Blaine T., The Shared cM Project 4.0 tool v4, Mar 2020, DNA Painter, https://dnapainter.com/tools/sharedcmv4
[29] AncestryDNA has 7 different groups for predicted relationships: Parent/Child, Immediate Family (full siblings), Close Family (half siblings, grandparent/grandchild, aunt/uncle/niece/nephew), 1st cousin, 2nd cousin, 3rd cousin, 4th cousin, Distant Cousin.
Understanding Your AncestryDNA Matches , August 2018, LegacyTree Genealogists, ttps://www.legacytree.com/blog/understanding-ancestrydna-matches
[30] Bettinger, Blaine T., The Shared cM Project 4.0 tool v4, Mar 2020, DNA Painter, https://dnapainter.com/tools/sharedcmv4
[31] Ibid
