
Pi Day is an annual celebration of the mathematical constant π. Pi Day is observed on March 14 since 3, 1, and 4 are the first three significant figures of π. Pi day was founded in 1988 by Larry Shaw, an employee of the San Francisco, California science museum, the Exploratorium. [1]
My contribution on Pi day is constructing a circular distance dendrogram of Y-DNA ancestors. Your immediate reaction probably is,
“Well Jim that’s great! It is circular but what am I looking at?!”
This is a fair question.
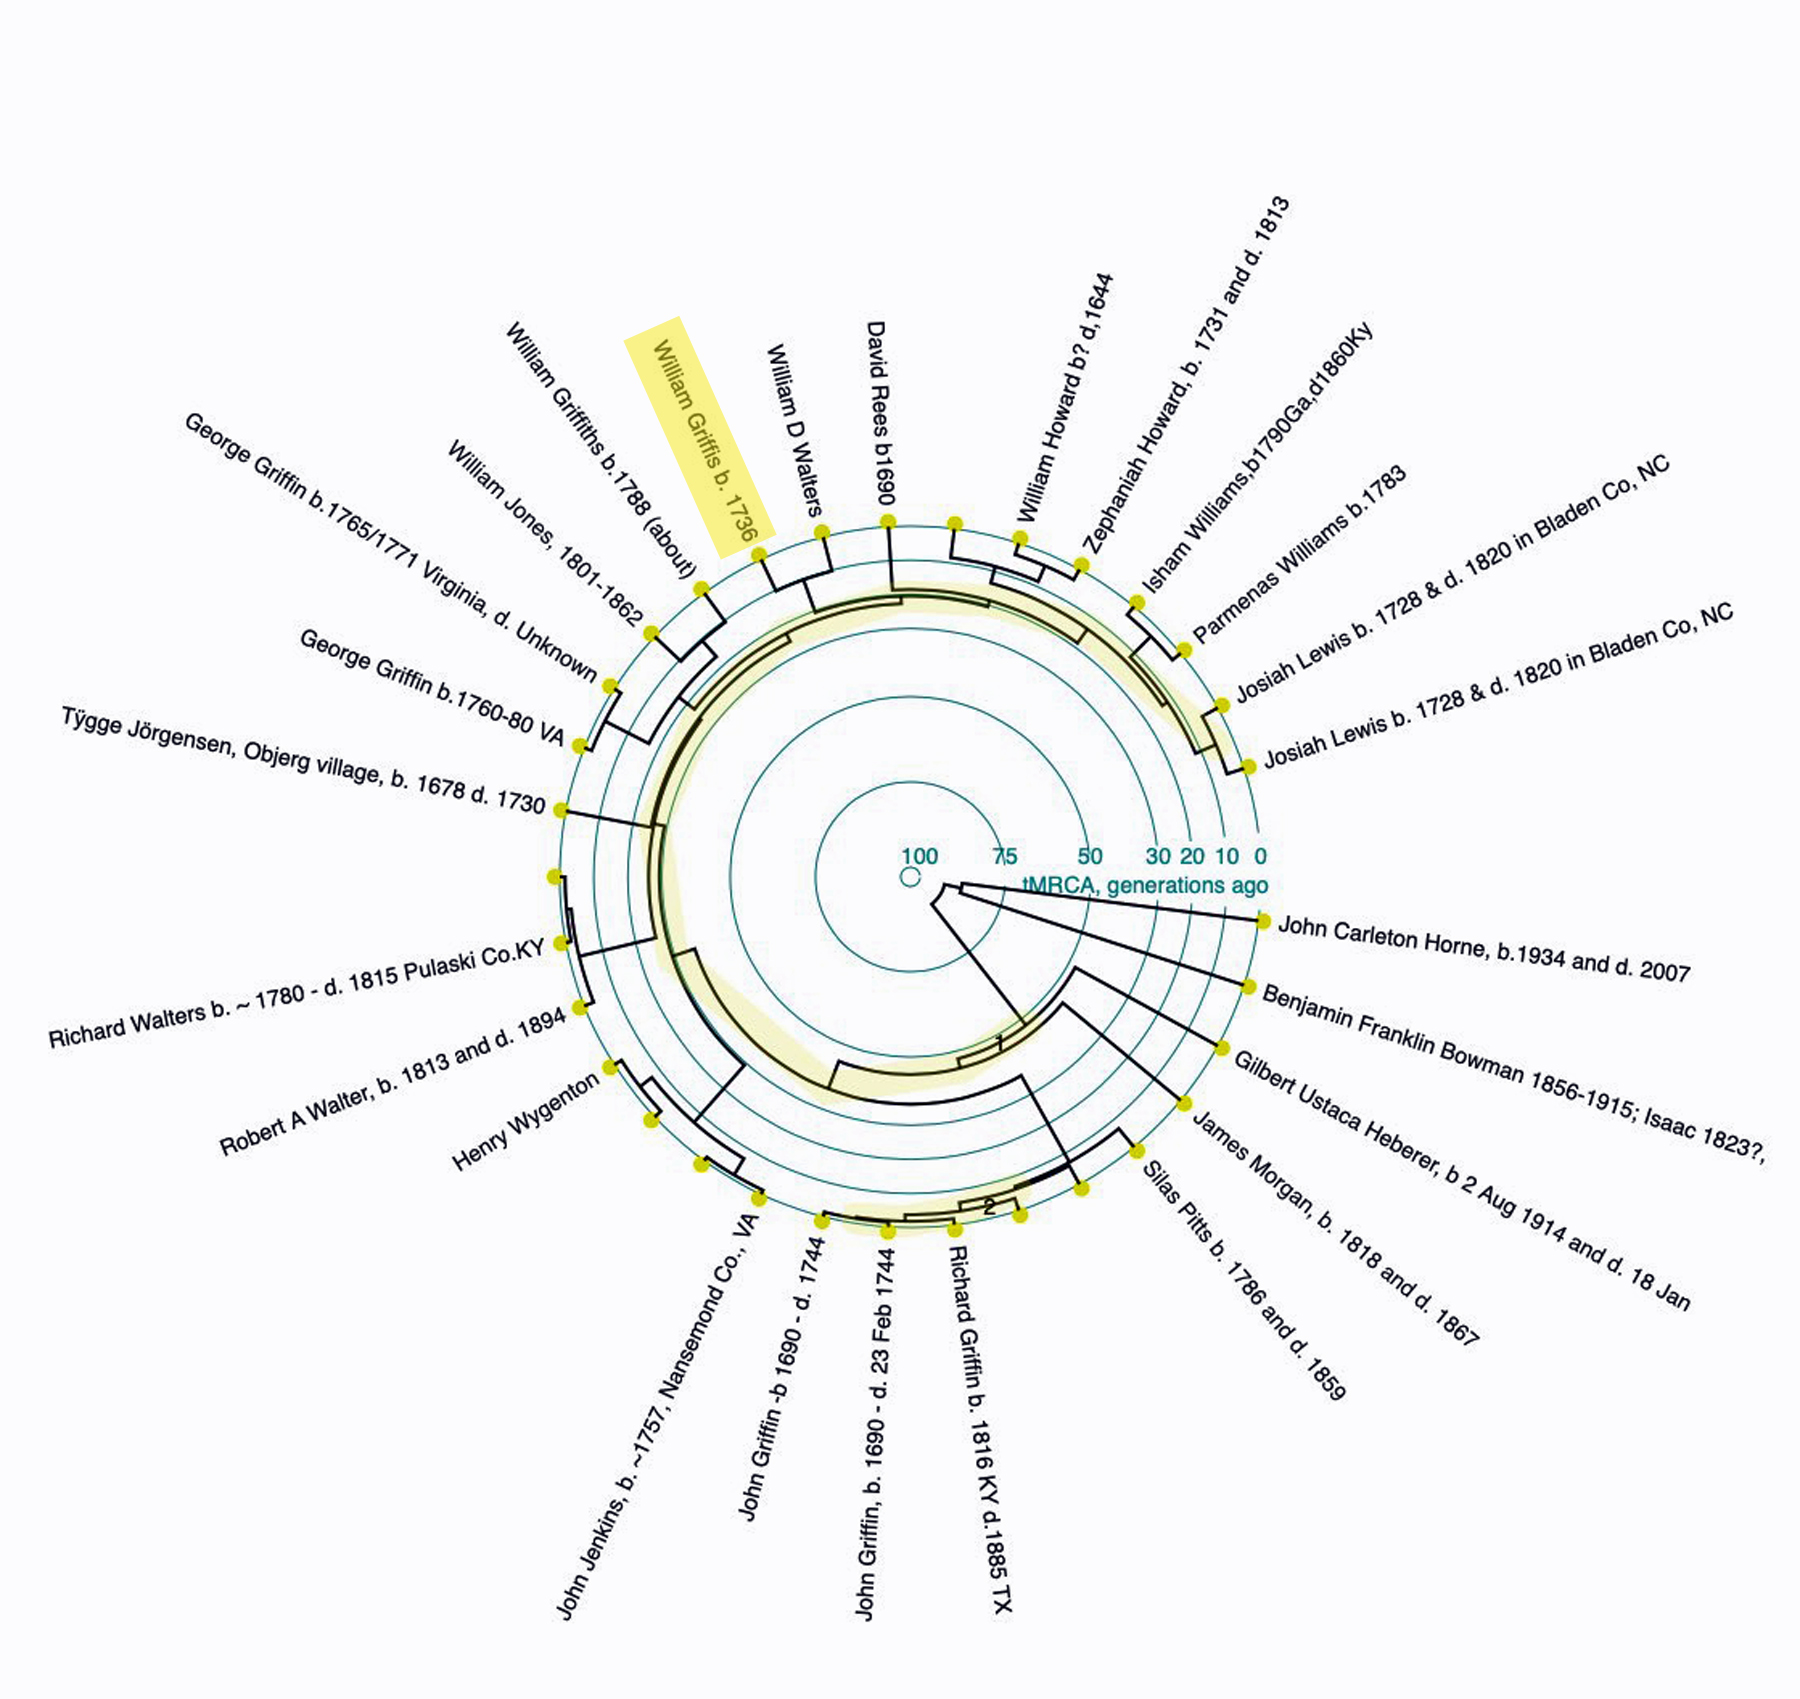
The “Pi” chart was constructed using an innovative program by Rob Spencer. [2] A distance dendrogram is a software-generated diagram that conveys relationships between Y-DNA test kits based on distance measured in years or generations. In this instance, distance is measured in generations .
What you are looking at is a circular rendition of comparing the relative closeness, measured in generations, of Y-DNA test kits with my Y-DNA test kit. It is a circular rendition of a chart that illustrates individuals who are genetically related based on Y-DNA SNP and STR test results.
Clear as mud, right? Let’s not get into STR and SNP Y-DNA tests and what do they measure. This is Pi day so let’s stick to the circle!
The outer perimeter of the circle has nodes that represent various Y-DNA test kits. My test kit is highlighted (around eleven o-clock). Each node is labeled with the earliest known paternal ancestor noted by the individual who took the Y-DNA test. So in my case, it lists “William Griffis born 1736”. He is the last known paternal ancestor of the Griff(is)(es)(ith) family that started in Huntington, New York.
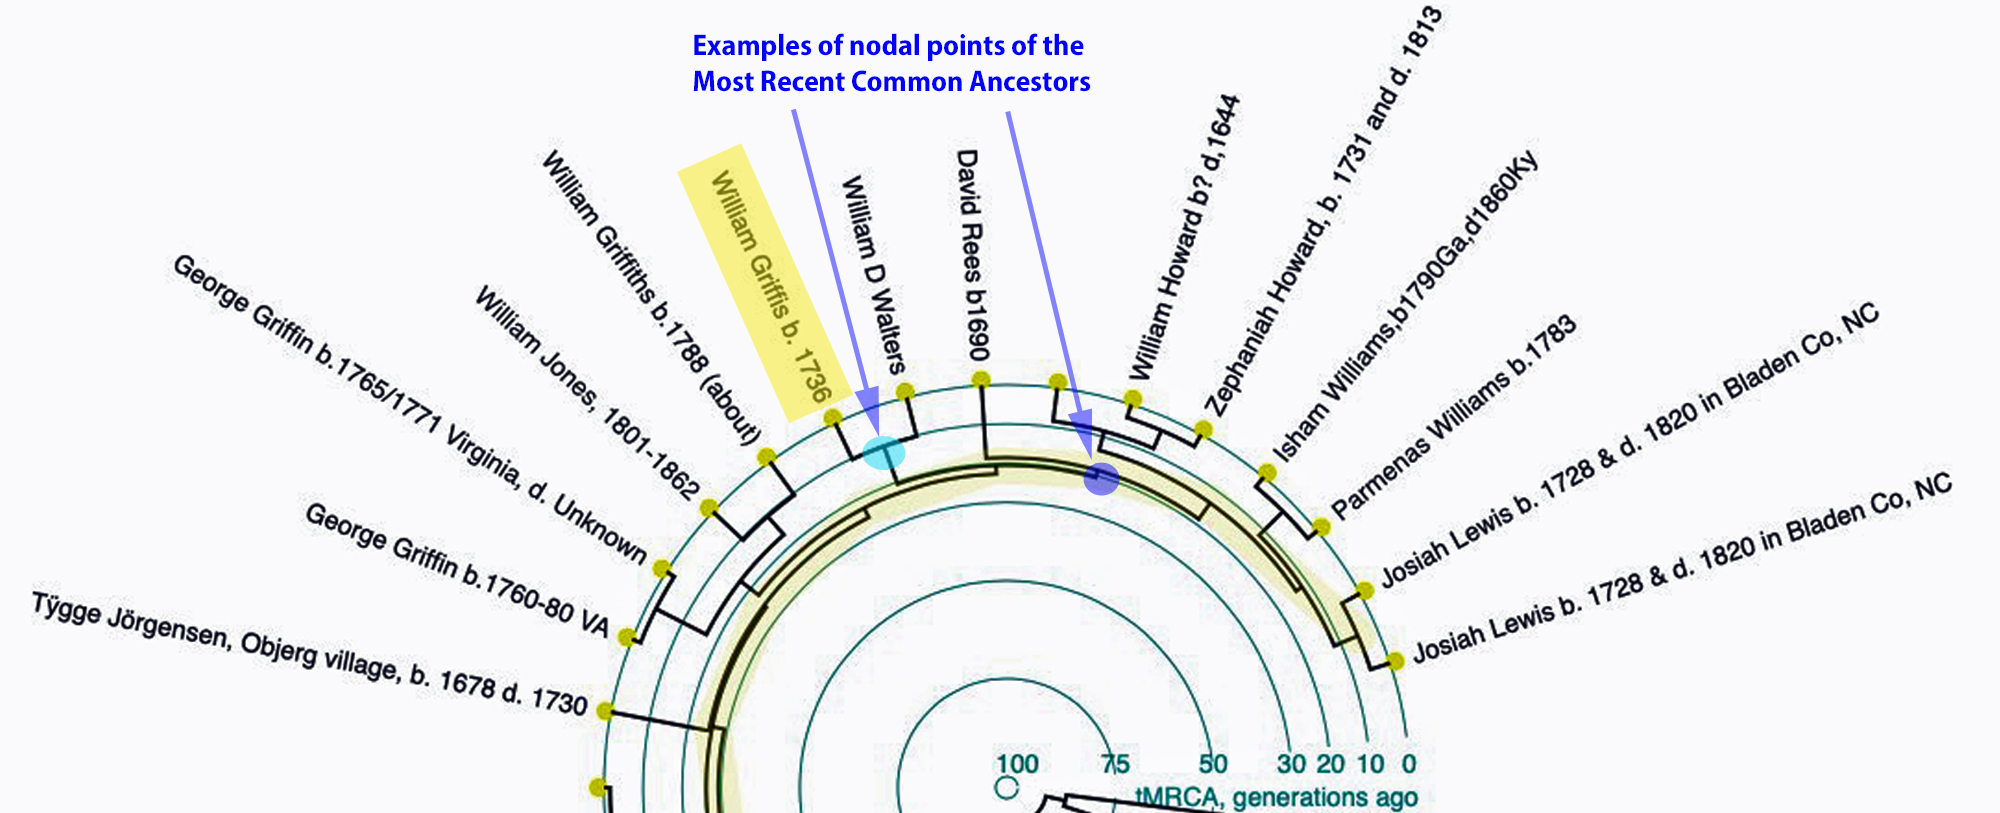
The inner circles on the chart represent time in terms of generations. Time (the number of generations) moves toward the center of the circle. The lines connecting various nodes (test kits) and branching to other lines as one goes backward in time are similar to the lines one finds in a family tree. However, the connections of the lines represent the most recent common ancestor between the network of lines linked earlier in time.
Dendrograms are close cousins (pardon the pun) to family trees — but with a few important differences. The relationships are expressed by the distances not by relationships (family trees depict family relations like father, sister, cousin etc). Because we use a linear and additive measurement of distance (i.e. time), the dendrogram has a time scale (either years or generations). Instead of lines to various family individuals, as indicated, the dendrogram has lines that connect to tMRCAs (time to the most recent common ancestor).
One key difference between a dendrogram and a family tree is that a dendrogram defines only the “leaf nodes” of the family tree. A dendrogram does not “know” that there are other dots on the diagram; the joining-points are a mathematical construct. Yes, in the limit of perfect distance data, every joining-point (T junction) corresponds to a specific ancestor. But the construction of the diagram alone does not put ancestors on the tree.
One important property of a distance dendrogram is that if the input distances are accurate and consistent, then the graphic will completely and correctly represent a family tree. If we had a set of people who had completed DNA tests and if we could calculate the tMRCAs for all pairs with complete accuracy, then their dendrogram would be an accurate family tree. The connecting points with the lines would represent people. Since we don’t have DNA test results for everyone, the connecting points on the line diagrams in the circle represent genetic estimates of when a common genetic ancestor was born.
The scale of the data and graphics can reveal large scale, high-level patterns of when one person became the descendant of all others and other demographic patterns that are not apparent using other methods of presenting DNA test results.

You can demonstrate the relationship between dendrograms and family trees for yourself with the Distance Tree Introduction interactive tool, and also for larger and more realistic family trees with the Family Simulator, both created by Rob Spencer.
If we were to focus on my test kit, one can see that a test kit that has a “William D Walters” as a paternal ancestor is next to mine and the diagram ‘links’ our kits right around the second outermost circle (10 generations). What is means is that our “most recent common ancestor” (MRCA for short) was born about ten generations ago. Which translates to around 1625 CE. [3]
I guess I need to look at possible genetic family members with the name of Walters….as well as Lewis, Williams, Howard, Reese.
One may immediately ask the question, “Wait a minute your last name is Griffis, how could you be related to a guy named Walters? ”
That’s another good question. But without digressing from this important day of Pi, it has something to do with that fact that the Welsh were a bit slow in picking up the use of using surnames.
The practice of using surnames in Wales happened at different times in various parts of Wales. In fact it was not until the late 1700’s that the old practice of patronymic naming was replaced with the modern practice of using surnames. [4] So, it is technically possible, from a genetic standpoint, that our family is related via Y-DNA lineages with different names.
We can transform this pi circular chart into a linear chart as illustrated below:
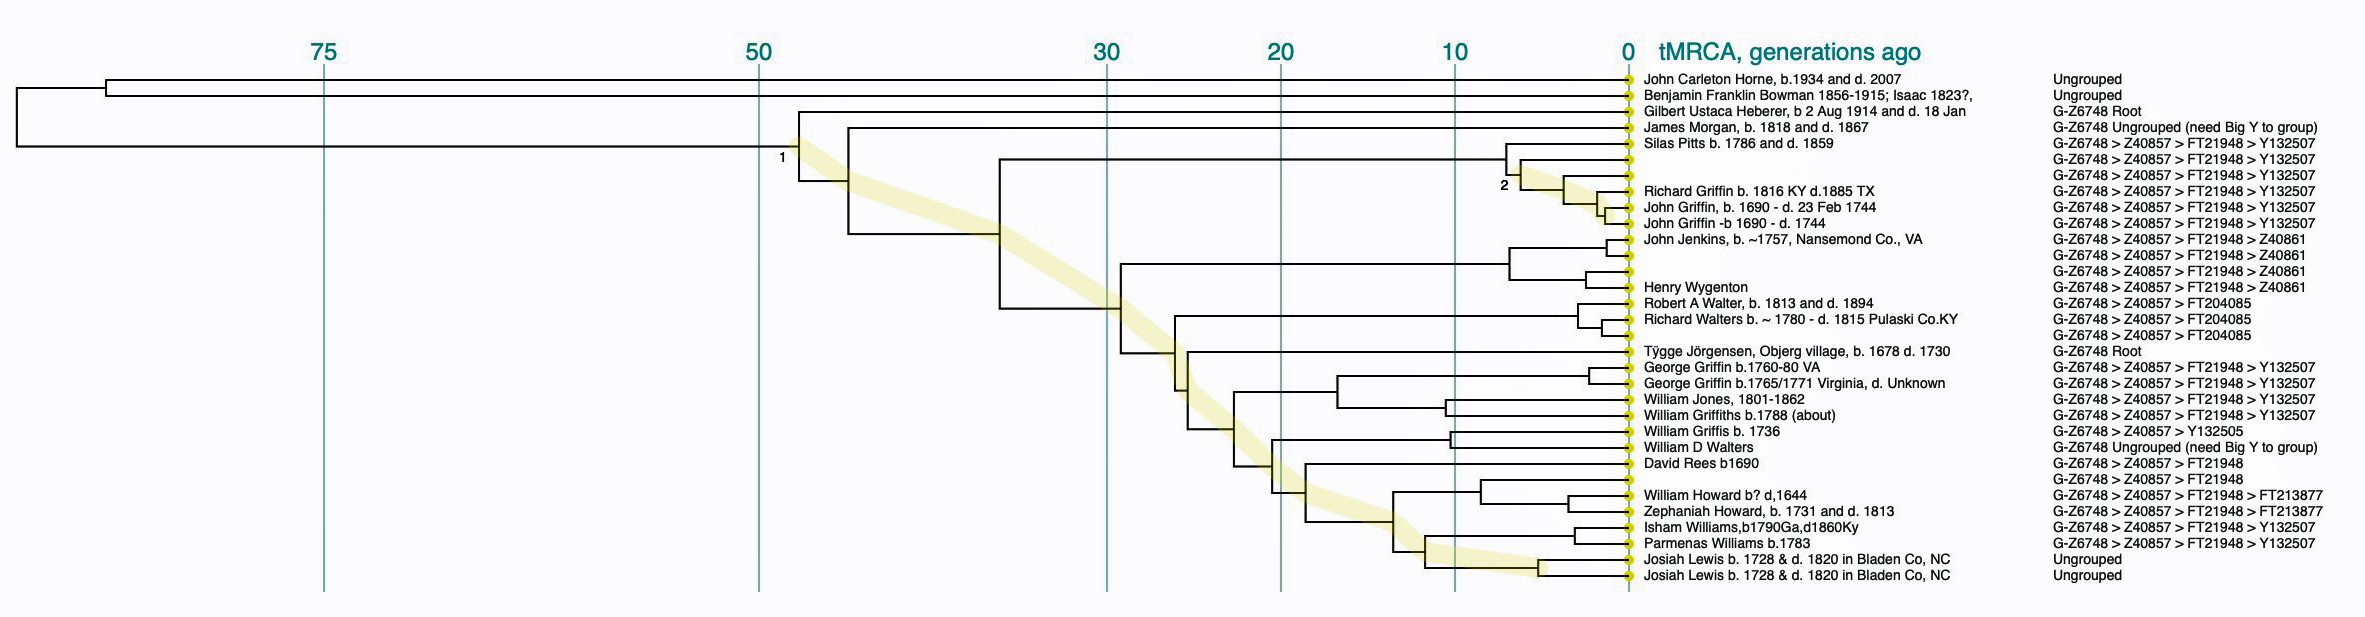
Personally, I like the linear charts, they are easier to read for me. Which dendrogram depiction is more intuitive is a matter of personal preference. I imagine it also depends on the nature of the data whether the Pi charts are better at providing a better graphic depiction of genetic relationships between test kits.
Circular or linear, Distance dendrograms of Y-DNA ancestors provide intuitive graphic renditions of genetic analyses of lineages The comparison of surnames and Y-DNA can show both expected parallels and some surprising differences especially in the transitional “Lineage” period of Y-DNA prior to the use of surnames (see Illustration below). This is an era or time period where groups of people settled in local geographical areas after large-scale migrations prior to the use of surnames or written history. An analysis of Y-SNP and Y-STR data may pinpoint an area where the most recent haplogroups of the Griff(is)(es)(ith) patrilineal line originated, regardless of surname.
Illustration: Three Periods of Ancestry

Happy Pi day !
Sources
[1] Pi Day, Wikipedia, This page was last edited on 14 March 2023, https://en.wikipedia.org/wiki/Pi_Day
[2] Rob Spencer, Y STR Clustering and Dendrogram Drawing, Tracking Back: a website for genetic genealogy tools, experimentation, and discussion, http://scaledinnovation.com/gg/clustering.html
The data was from:
Family Tree DNA L-497 Project, DNA Results, https://www.familytreedna.com/groups/g-ydna/about
The G-L497 project includes men with the L497 SNP mutation or reliably predicted to be G-L497+ on the basis of certain STR marker values. The L-497 is a branch or subclade of the G-haplogroup (M201+). The project also welcomes representatives of L497 males who are deceased, unavailable or otherwise unable to join, including females as their representatives and custodians of their Y-DNA. The primary goal of the project is to identify new subgroups of haplogroup G-L497 which will provide better focus to the migration history of our haplogroup G-L497 ancestors. (2,326 members as of the date of this article.)
[3] Generations is calculated as follows:
- One generation = 33 years
- Years before present is based on the year 1950
The natural unit of Y STR date analysis is generations-before-present. To turn that into calendar years we must have a base-year, years before present (YBP) and a value for male years-per-generation. Based on a review of the literature of this subject, many folks have been using 1950 as a base year (it is the traditional base-year for radiocarbon dating). More recently, a number individuals have used 1957 as base for YBP since is reflected the demographic average of current Y-DNA testers (baby boomers). I ended up using 1955, a compromise between the traditional ‘radio carbon’ date and the ‘baby boom’ date.
Male years per generation shifted, depending on a given author of a study, from 30 years to 33 years. I am following Rob Spencer’s lead and using 33 years equal to a generation.
Rob Spencer, Revisiting the Length of a Generation, Tracking Back: a website for genetic genealogy tools, experimentation, and discussion, http://scaledinnovation.com/gg/gg.html?rr=strByMu
So, for our example of 10 generations:
- 10 (generations) x 33 (years) = 330 years
- 1955 (‘present” year) – 330 = 1625
[4] Before the 1536 Act of Union, the Welsh did not generally employ surnames, but instead used epithets (e.g. Selyf Sarffgadau, “Selyf the Battle-Serpent”), patronyms (e.g. Rhodri ap Merfyn, “Rhodri son of Merfyn”), and (much less often) matronyms (e.g. Rhodri map Nest, “Rhodri son of Nest”) to identify people.
In a study of Welsh wills, John and Sheila Rowlands documented ‘patterns of decay’ in the use of the patronymic naming system in Wales. They completed a study aimed at providing a means of determining areas in Wales when the use of the patronymic naming system reduced to about 10 percent of the names in a given area.
Map: Patronymic Decay and the Rise of Surnames in Wales
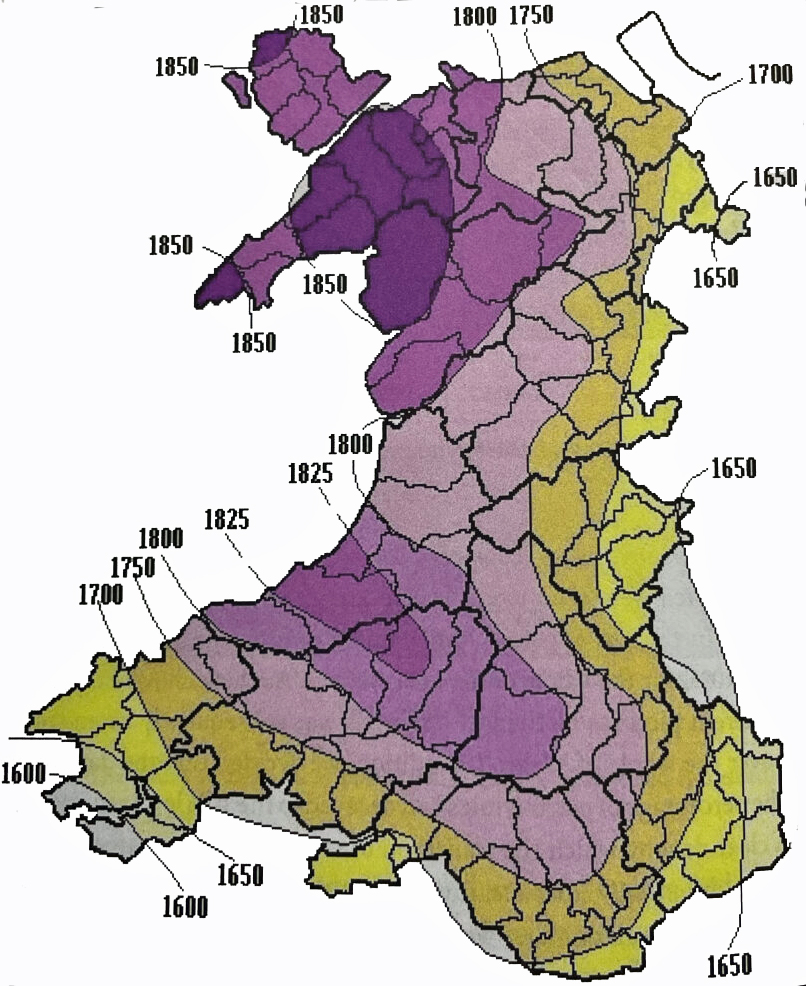
The map above, which is from their study, reveals the wide variation when surnames were adopted in various parts of Wales. Surnames became the norm by 1750 across the coastal plain of south Wales and along the eastern border with England.
Source: John and Sheila Rowlands, The Use of Surnames, Chapter 4, Patronymic Naming – A survey in Transition, Llandysul, Ceredigion: Gomer Press, 2013, Pages 50-57