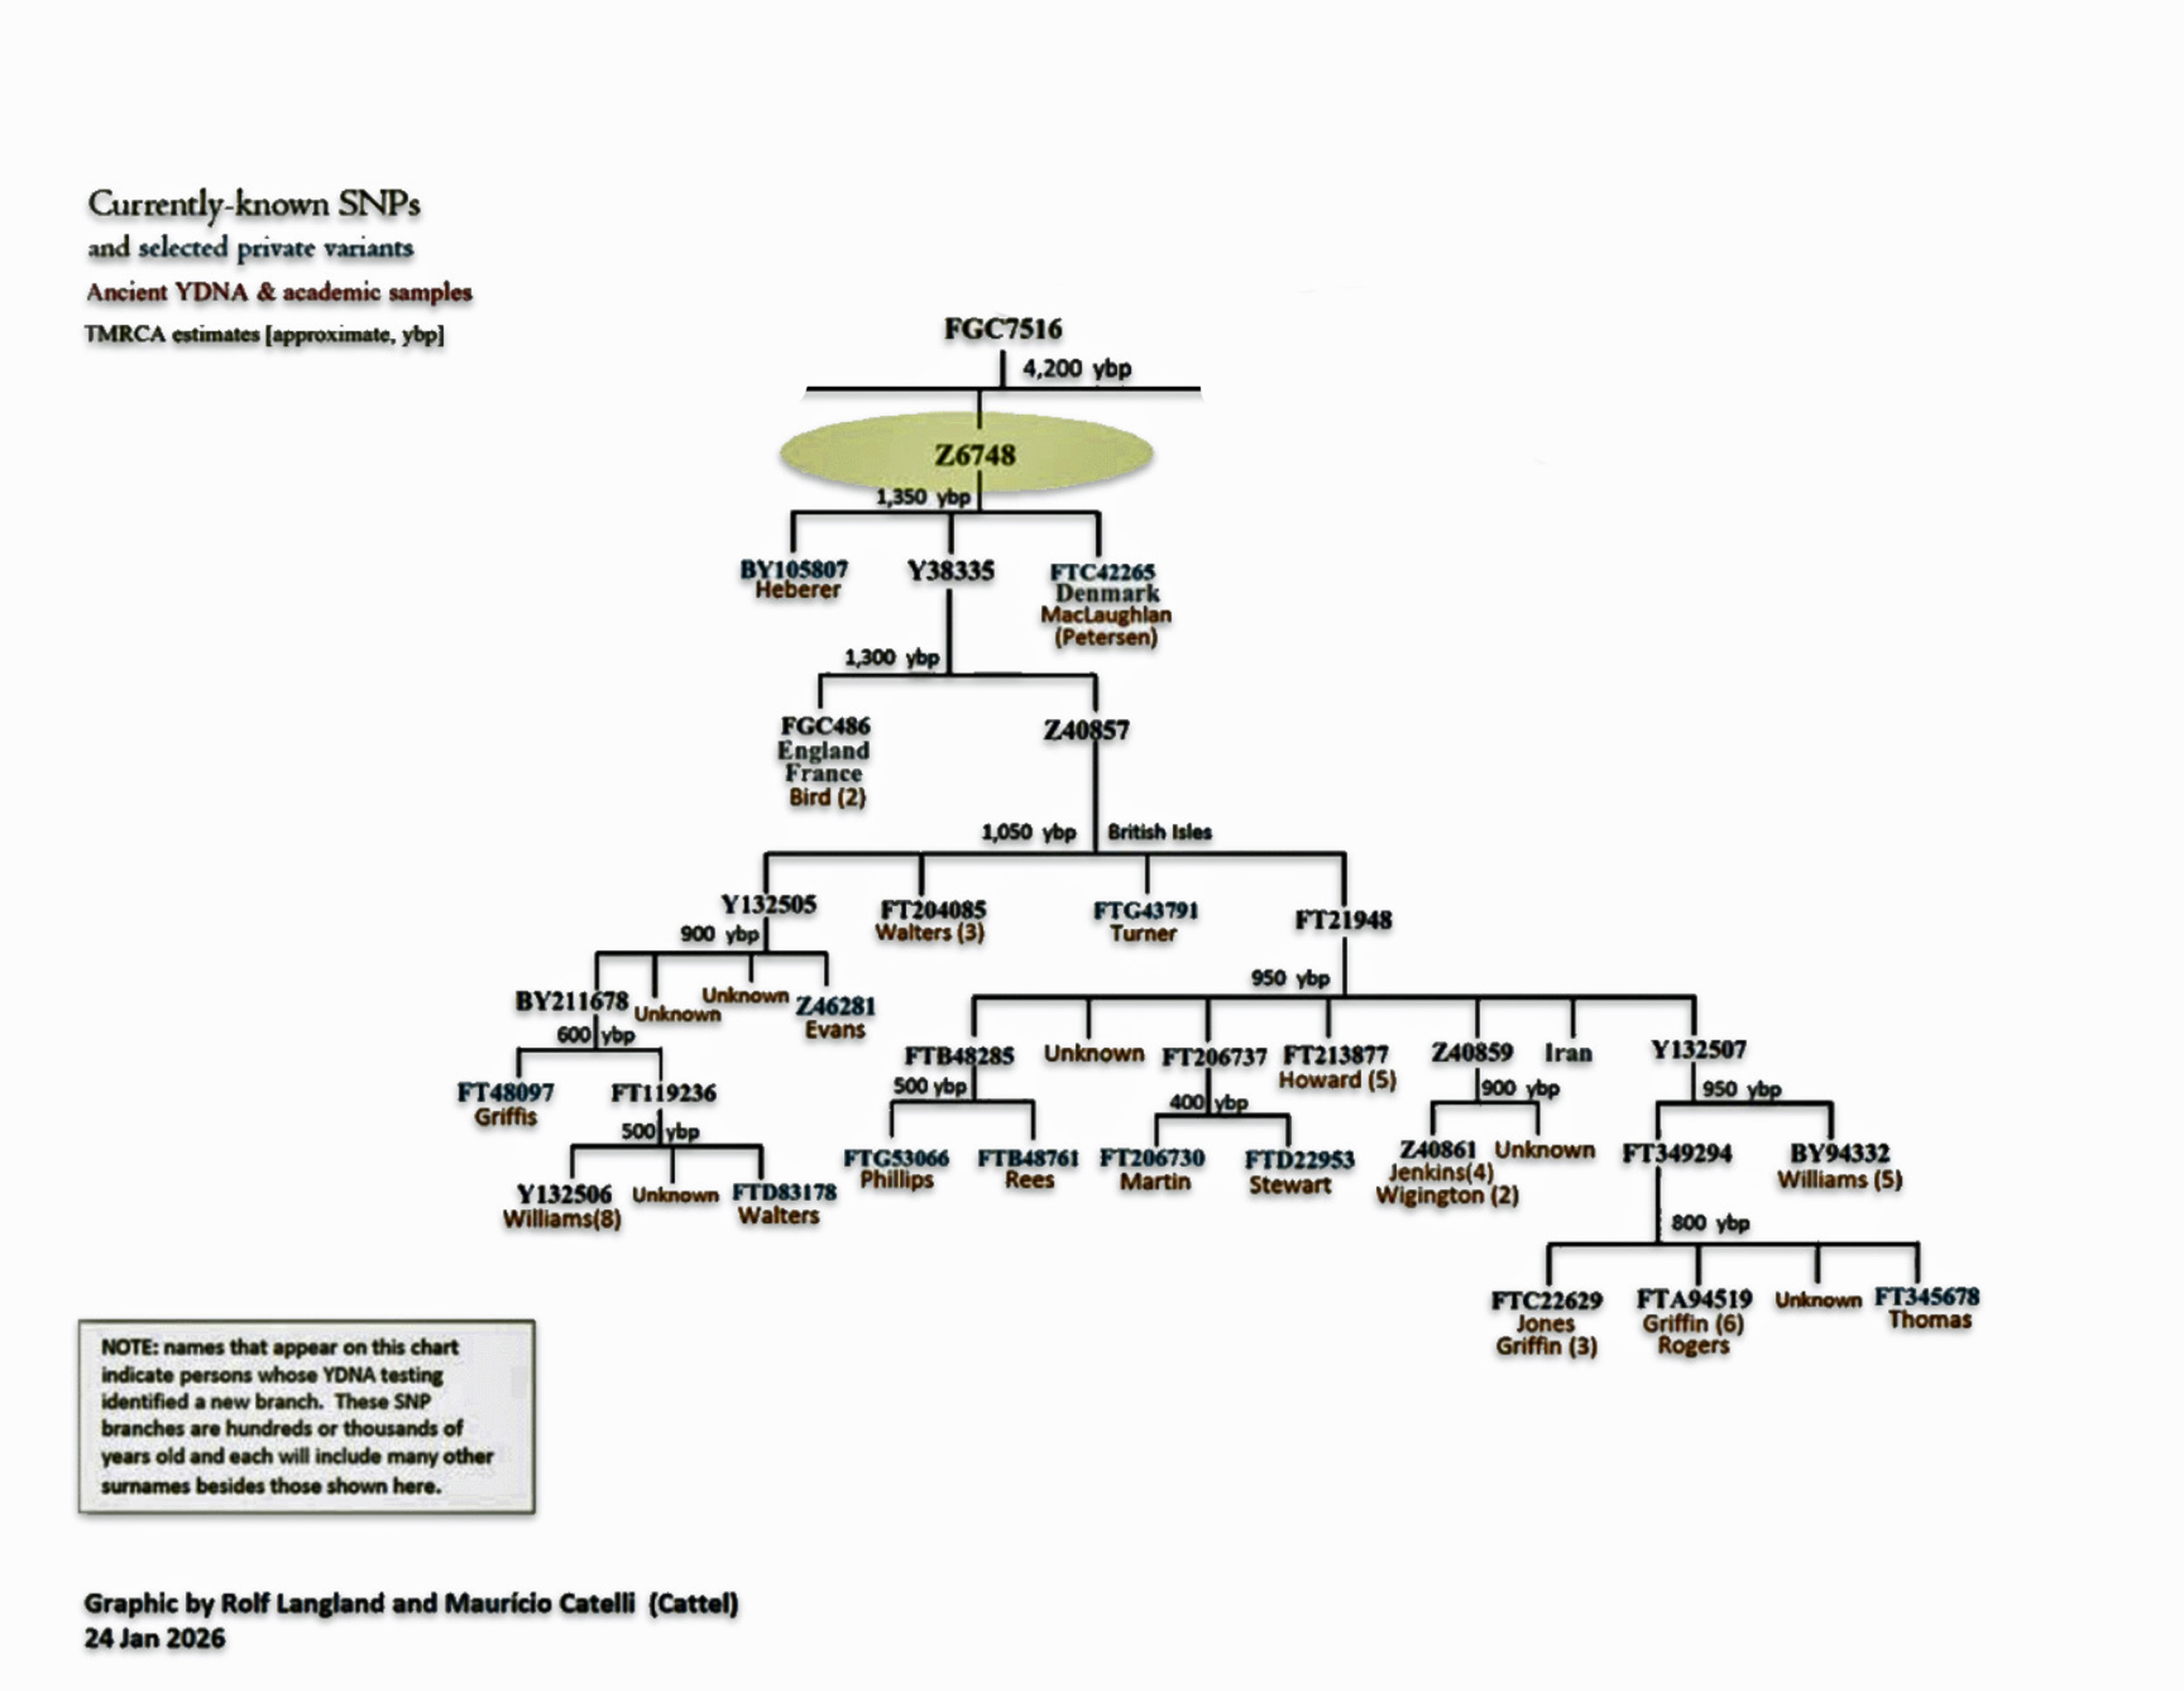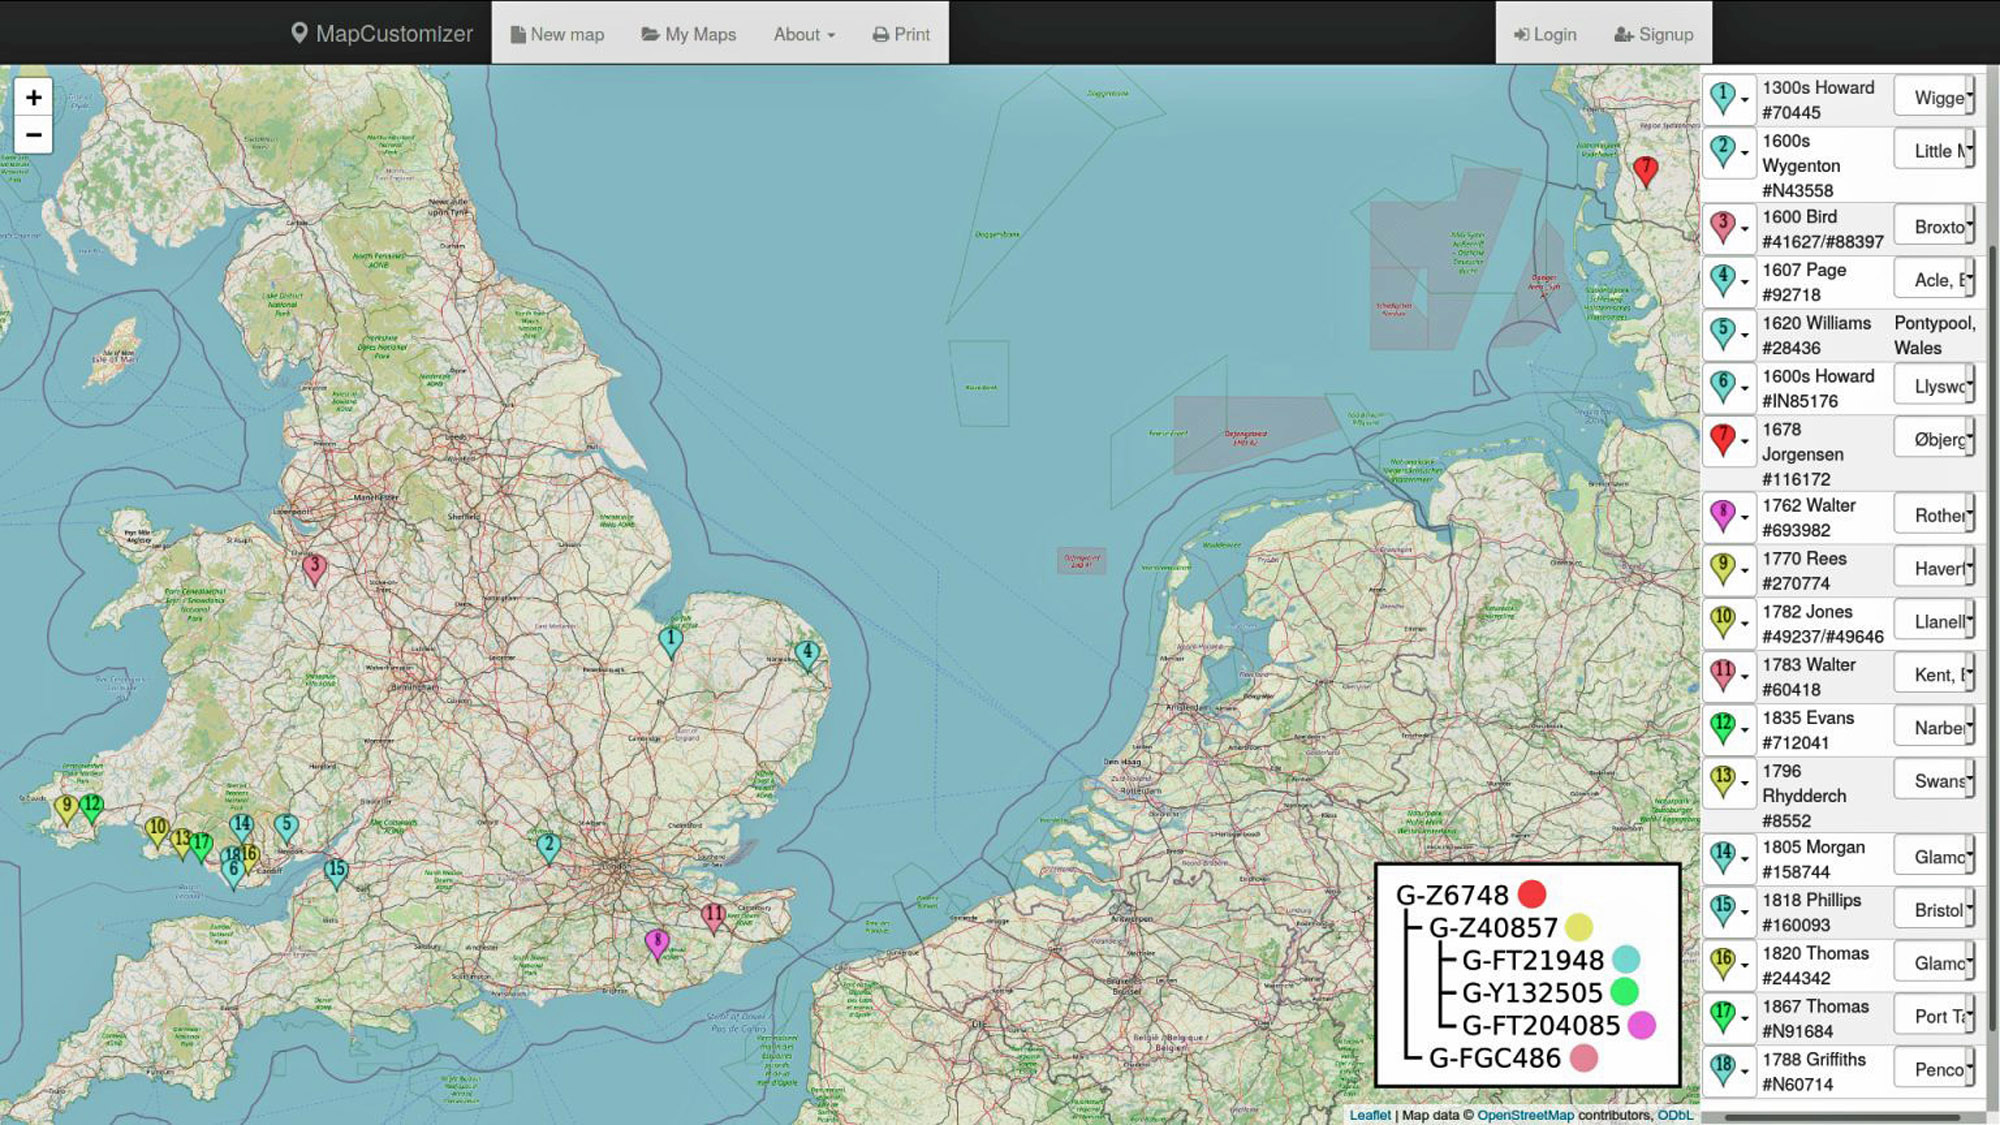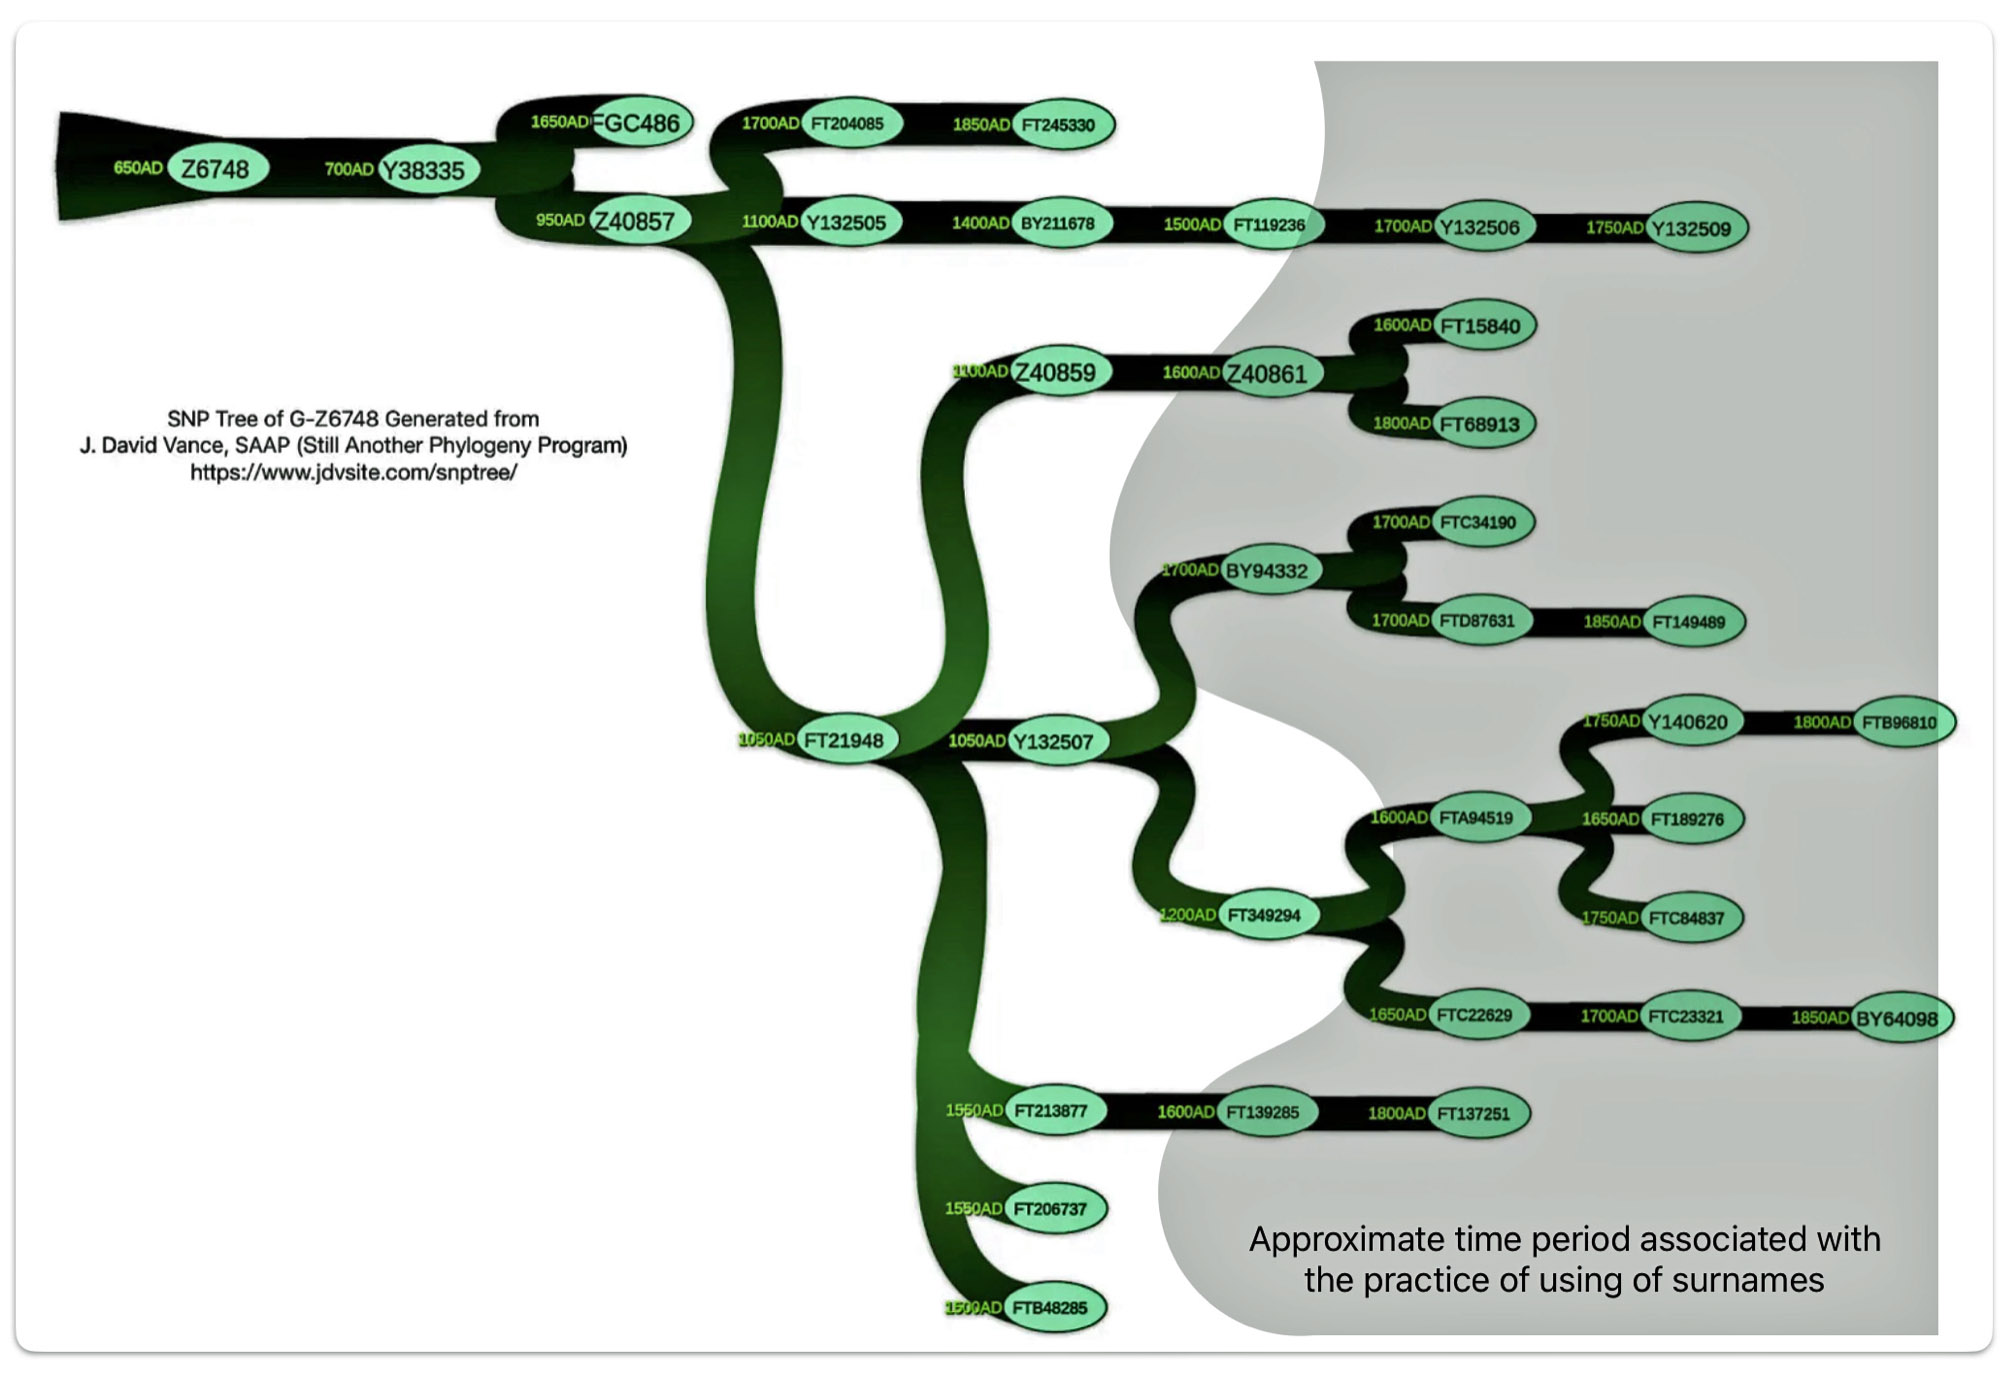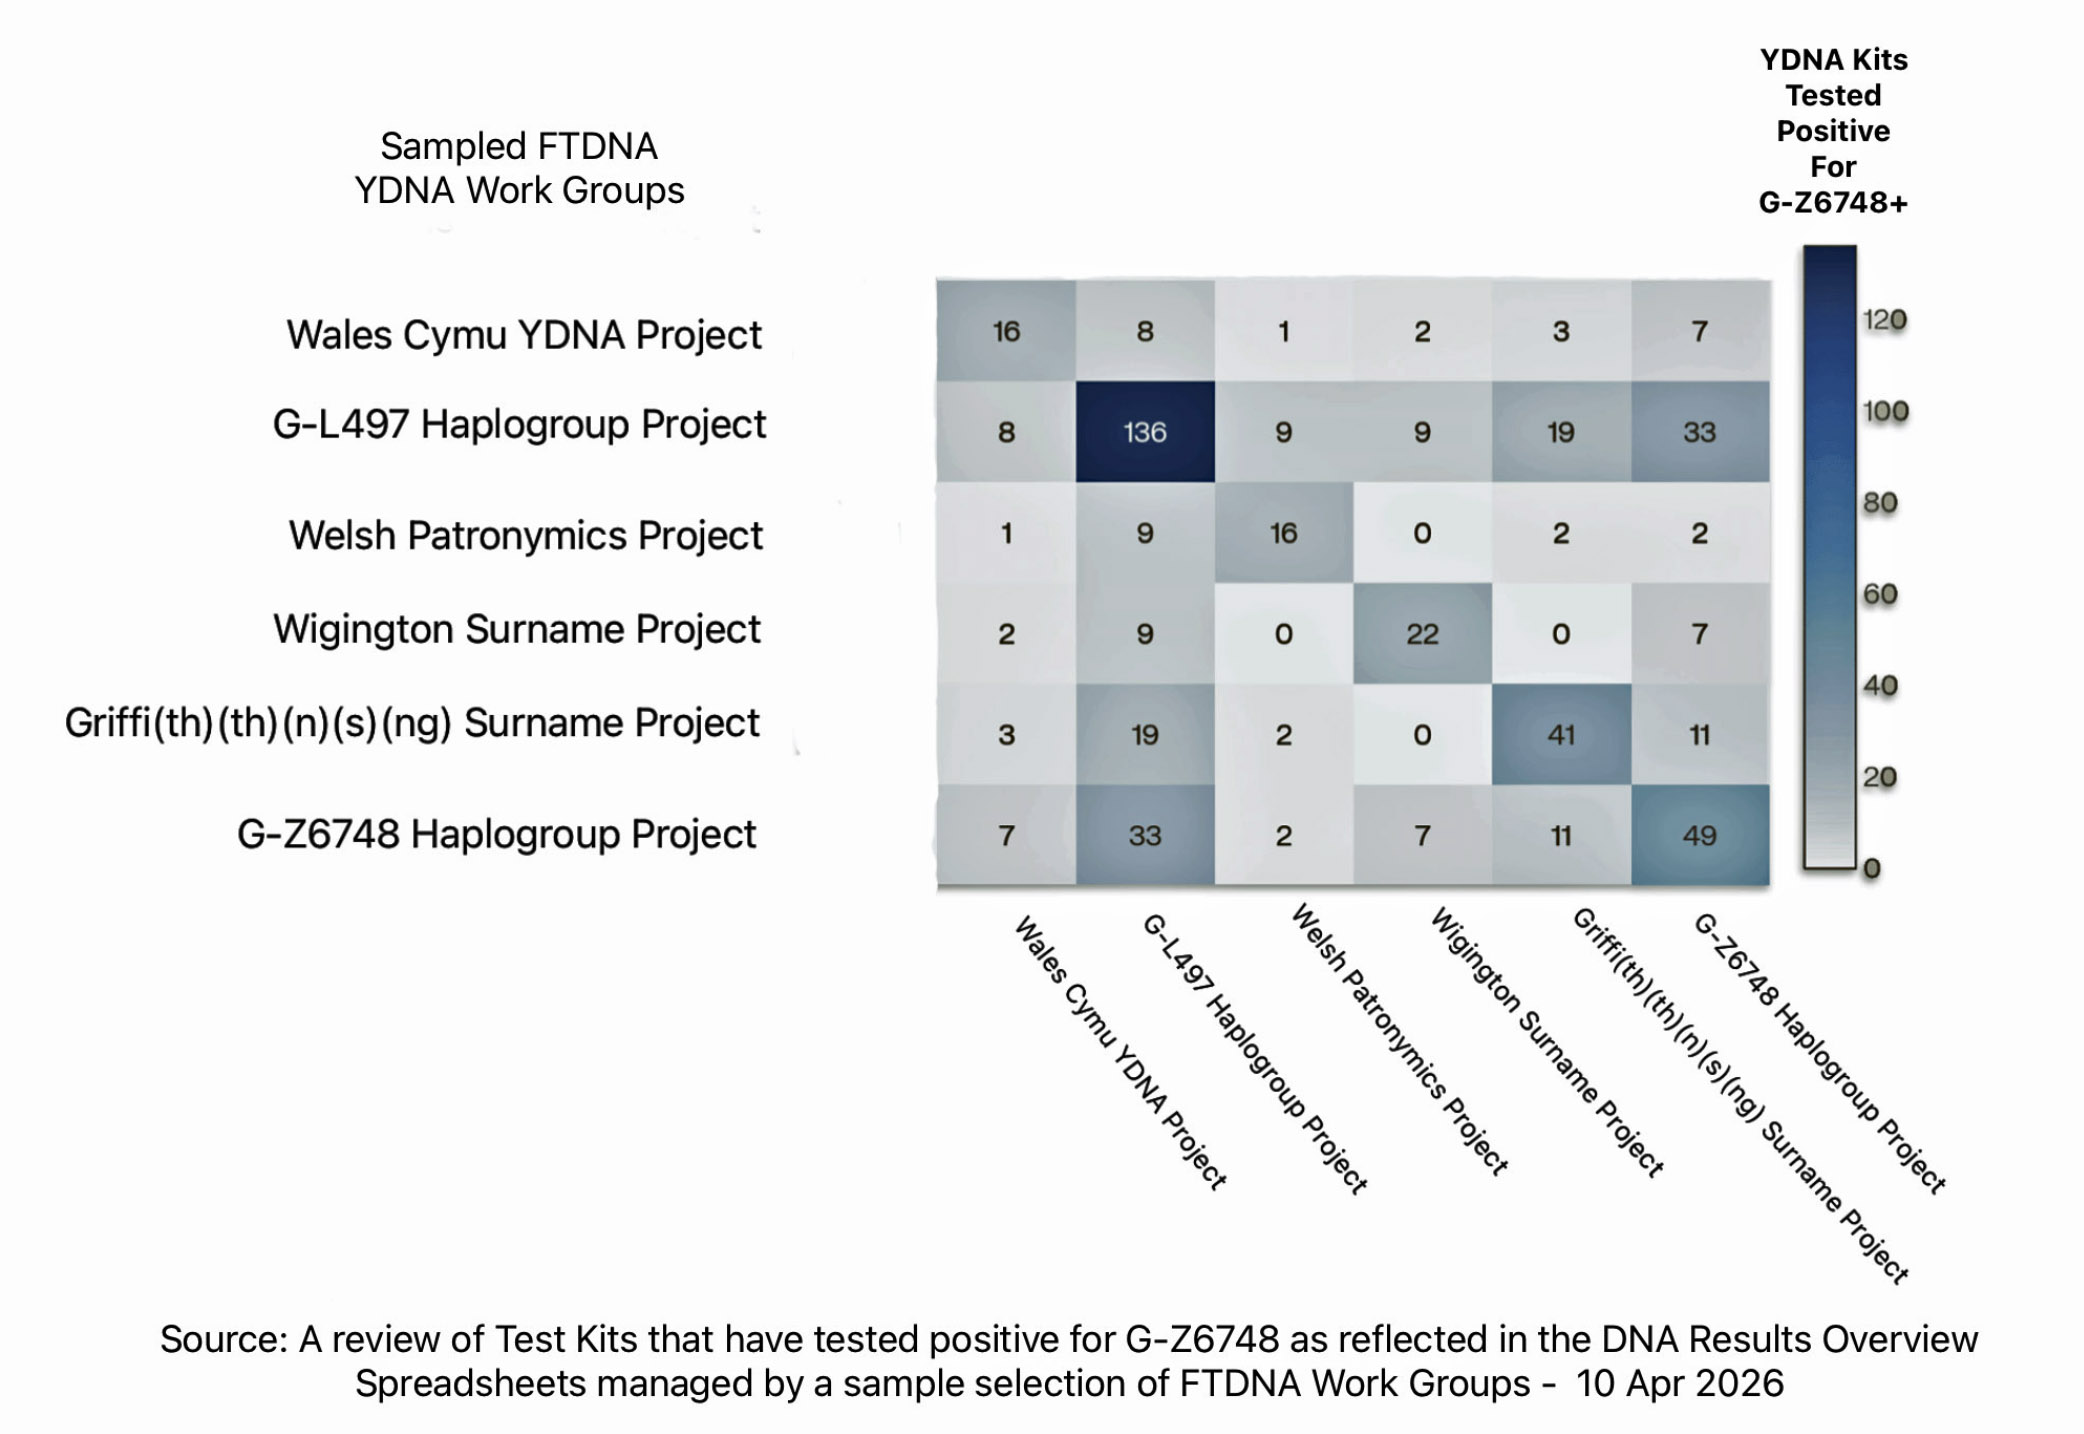


The ancestors of the Griff(is)(es)(ith) paternal line are identified as ‘Welsh’. This assertion is based on family genealogical accounts and genetic research. [1] Their male ancestors eventually made their way to the south western area of the British Isle before, during and after the time of the Norman invasion. At the time, this area consisted of a fractured collection of independent Celtic Britonic kingdoms around 1100 CE. [2]
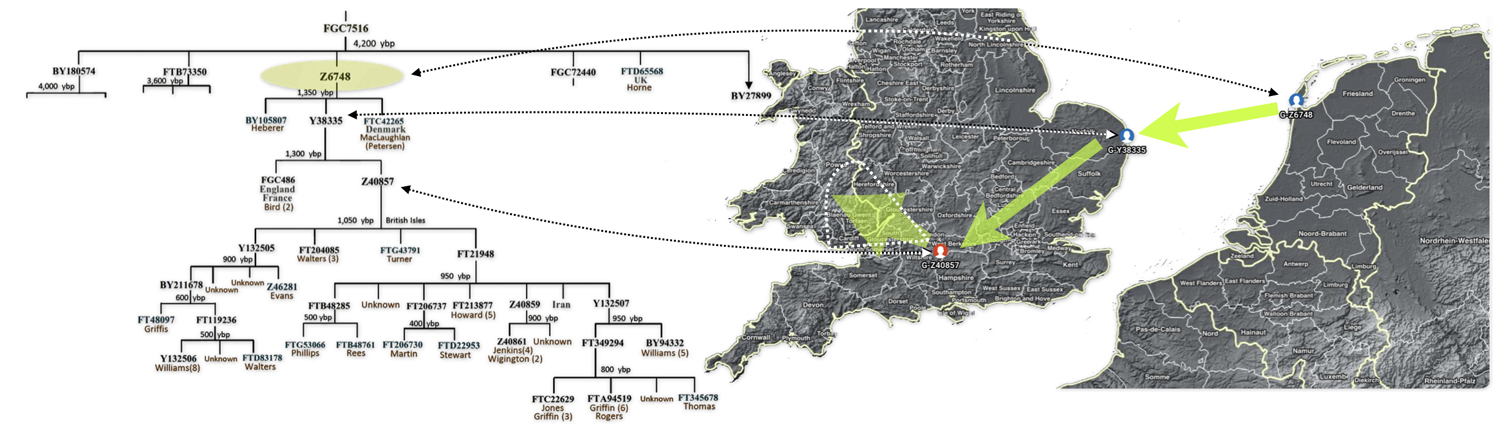
From a genetic YDNA viewpoint, our descendants were outliers and a minority. Their genetic imprint reflected generations of male descendants who were part of a larger wave of migrating social groups, representing other dominant YDNA haplogroups. They moved into an area that was defined by an emerging Welsh culture at a specific point in time. Once settled in these areas, subsequent generations assimilated into the emerging Welsh culture (see illustration one).
Illustration One: Estimated Recent Historical Path of YDNA Griff(is)(es)(ith) and Related Haplogroup Branches (Subclades) on the British Isle

What it Means to be ‘Welsh’
A distinct Welsh ethnicity emerged gradually. If “Welsh” means the population and political culture that developed in the territory of modern Wales, the process began after the end of Roman rule, roughly 400–600 CE. If it means a self-conscious people called the Cymry [3] , the evidence points to the seventh through tenth centuries. If it means a people identified primarily with the territorial Wales of later history, the consolidation belongs chiefly to the late eleventh and twelfth centuries.
The essential point is that the earliest inhabitants of what became Wales did not initially call themselves “Welsh.” There was no Welsh people or Welsh ethnicity in the traditional sense of the term. The region contained communities of Roman Britain, speaking varieties of British, with local civic, tribal, religious, and regional affiliations. They understood themselves as Britons: heirs of Roman Britain, speakers of British / Brittonic, and in many texts the rightful people of the whole island. Thomas Charles-Edwards accordingly warns that modern labels can obscure the early evidence. In 350 CE, the territory was simply part of Roman Britain, and the people of Wales remained one component of a wider Brittonic world extending to the north, Cornwall, and Brittany. [4]
The collapse of Roman imperial administration and the formation of western British kingdoms created the institutional setting from which Wales emerged. Polities such as Gwynedd, Dyfed, Powys, Gwent, and Ergyng developed within a shrinking Brittonic political world. This is the formative stage of Welsh ethnogenesis, but the identity was still principally British rather than narrowly Welsh. [5]
From the seventh century onward, the native term Cymry was probably in use. Its original scope was broader than modern Wales: it meant roughly “fellow-countrymen” and could include Brittonic-speaking peoples of Wales, the Old North/Strathclyde, and Cornwall. The term’s borrowing into Old English as Cumbras and into Old Irish as Combrec suggests that it already circulated by this period. [6]
In the ninth and tenth centuries, Welsh cultural consciousness becomes much clearer in surviving texts. The Historia Brittonum (compiled in Gwynedd in 829/30 CE) articulates a British historical identity, while Armes Prydein Vawr is the first securely dated work using Kymry. Yet its Kymry still includes Cornish and Cumbrian Britons, so it is not simply a name for the inhabitants of modern Wales. [7]
The strongest candidate for the emergence of a specifically Welsh ethnic-territorial identity emerges in the eleventh to twelfth centuries. Cymry increasingly meant the people of Wales rather than all Britons; Latin terms such as Wallia, Walenses, Cambria, and Cambri became common. The territory acquired a more coherent political and legal definition. Recent scholarship places the narrowing of Cymry to Wales by the late eleventh century or twelfth century, while emphasizing that older claims to British identity persisted. [8]
The term “Welsh” is an English exonym. An exonym is a name used by people in a specific language for a place, group, or language that is outside that area and differs from the local native name. [9]
‘Welsh” is from Old English wealas, probably meaning foreigners or non-Germanic/ Romance-speaking people in its earliest context. It was used broadly enough to include Britons outside Wales, including Cornwall. For example, the Anglo-Saxon Chronicle calls Geraint of Cornwall a king of the Wealas in 710. Thus, the English label long predates a cleanly bounded Wales, but it does not by itself prove a self-conscious Welsh ethnicity. [10]
The native distinction is more revealing. Early medieval people in Wales often called themselves Brython or Brittones, their language British, and their homeland Prydain or Britannia. Only gradually did Cymry and Cymru become the normal narrower name for the Welsh and Wales. Charles-Edwards’s useful formulation is that “the Welsh and Wales thus emerged slowly from the parent Britons and Britain”, and that this emergence was still incomplete before the twelfth century. [11]
In a nutshell, Welsh ethnic origins lie in the post-Roman Britons of western Britain after approximately 400 CE. A Cymry identity is probably visible by the seventh century and firmly attested in the tenth, while a predominantly Wales-specific identity crystallized from the late eleventh into the twelfth century.
G Haplogroup: A Genetic Outlier in Wales
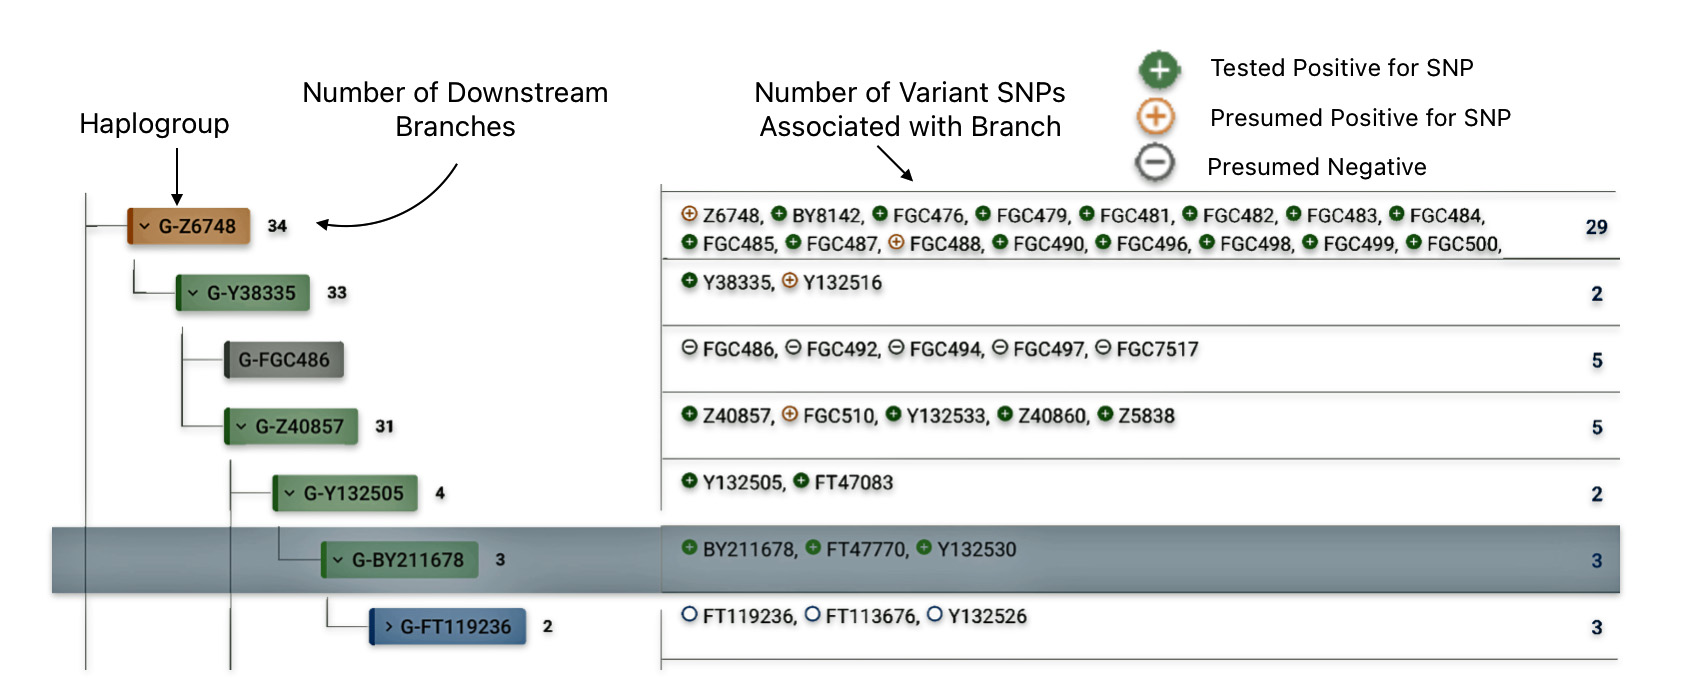
The Griff(is)(es)(ith) paternal lineage is part of a specific genetic branch of the YDNA G-Z6748 haplogroup. [12] The descendants of the G-Z6748 haplogroup were the first of this particular line of descent to cross and inhabit the British Isle around 650 CE. In general, haplogroup G is historically rare in Welsh areas primarily because Wales was and Great Britain to a greater extent is dominated by a different, much older paternal lineage.
Wales is historically unique regarding YDNA because, depending on what specific study is referenced, well over 70 percent of Welsh men carry an ancient paternal lineage marker called R1b-L21, representing one of the highest concentrations of this deep Celtic and Bronze Age genetic signature in the world. This marker connects modern Welsh men directly to the ancient Bronze Age people and Celtic tribes who moved into Britain thousands of years ago. [13]
The rugged, hilly landscape of Wales acted as a natural wall against large-scale invasions and outside migration. While eastern and southern England saw massive genetic changes and population replacement from Roman, Anglo-Saxon, and Viking arrivals, Wales largely avoided this genetic mixing. Because outsiders rarely settled or intermarried deeply in the Welsh hills, the original paternal DNA patterns remained remarkably stable over thousands of years. [14]
How Welsh DNA Broke Europe’s Genetic Map
An analysis of the historical distribution patterns of YDNA in this geographical area reflect that the predominant YDNA haplogroup representing the Welsh is R1b (specifically the R-M269 subclade), which accounts for over ninety percent of the population in some studies. While R1b-M269 is the overarching YDNA group, a specific branch— R-L21 (or R-M529) — is known as the most significant “Insular Celtic” marker for Welsh, Irish, and Scottish populations. [15]
Haplogroup G (specifically G-M201) is rare in Welsh areas primarily because Wales is dominated by this different, much older paternal lineage, R1b-L21 (associated with the Bell Beaker culture and Atlantic Celts). While haplogroup G, associated with Early European Farmers (EEF), was present in Britain’s early history, it was significantly marginalized by subsequent migrations from the Pontic-Caspian steppes that carried the YDNA R1b haplogroup. [16]
The Welsh population through time often shows very low YDNA haplogroup diversity, meaning the R1b-L21 line was and is extremely strong, reflecting a high level of continuity from the impact of the migratory patterns of Bronze Age populations. Although R1b is dominant, minor percentages of other haplogroups like I2a2a (M223) have been found in Welsh samples. [17]
The following are specific factors contributing to the ‘baseline scarcity’ of the G haplogroup in Wales after the migration of early Neolithic farmers to the British Isle. [18]
- Marginalization of Early Farmers: Haplogroup G is strongly associated with the early Neolithic farmers who brought agriculture to Europe from Anatolia. While these farmers did populate Britain, their paternal lineages were largely replaced or suppressed by the massive migration of R1b peoples from the Pontic-Caspian Steppe around 3,000 BCE.
- R1b-L21 Dominance (The “Celtic” Signature): Wales, along with Ireland and western Scotland, experienced less genetic turnover during the Anglo-Saxon and Norse migrations compared to England. This allowed the Bronze Age R1b-L21 haplogroup to become almost entirely dominant, leaving very little room for older Neolithic lineages like G to maintain high frequencies.
- Genetic Continuity and Isolation: Welsh DNA retains more continuity with ancient British populations, but this includes a massive expansion of R1b-L21 which occurred during the Bronze Age, effectively minimizing early Neolithic G lineages.
- Specific Pockets – Not Regional Dominance: While overall rare, the G haplogroup is not entirely absent, with some studies suggesting specialized, ancient branches such as G2a3b1, or similarly named G-P303, exist in small, isolated pockets in Wales, but these remain far below the frequencies of R1b.
The Proof is in the ‘Branches’
Studies of Ancient DNA (aDNA) show that Britain experienced multiple, substantial demographic changes after the Neolithic era, including the Beaker-associated transformation, the later Middle-to-Late Bronze Age movements, the migration of Anglo-Saxon groups in the post-Roman era and population movements in the Medieval time period. These historic episodes created many chronological opportunities for low-frequency male lineages, such as those representing the G haplogroup, to enter, disappear, or expand locally. (see illustrations Two A-D). [19]
Illustrations Two A-D: Major events in the Population Admixturing of the British Isles


A key conclusion from an interesting study by Stephen Leslie and associates is that Britain’s modern population structure is a mosaic shaped by successive demographic influences — pre-Roman continental movement, Anglo-Saxon settlement, Norse Viking settlement in Orkney/Scotland — layered onto and admixed with a persistent but changing indigenous substrate population (e.g. the Bronze Age R1b-L21 haplogroup). These demographic influences reflect an admixture rather than a series of population replacements. The study also demonstrates, methodologically, that haplotype-based clustering of dense SNP data can resolve genetic structure at a resolution fine enough to recover historical linguistic and administrative boundaries (Cornwall/Devon, the Landsker Line, North/South distinctions in Wales) purely from genetic similarity, with no location information used in the clustering itself. [20]
One of the paper’s most historically significant conclusions is there is no single “Celtic” population — Wales, Cornwall, Scotland and Northern Ireland are each genetically distinct from one another rather than one homogeneous Celtic fringe. The non-Saxon regions of Britain fracture into multiple, genetically differentiated subgroups. North and South Wales are about as distinct from each other as central/southern England is from northern England and Scotland (see illustration three). [21]
Illustration Three: Clustering of the United Kingdom individuals into 17 YDNA clusters base

The historical presence of haplogroup G males in Wales most likely represents low-frequency paternal lines whose deeper ancestry lies in the broader European and west-Eurasian G phylogeny. Aside from the initial impact of the Neolithic revolution, the strongest conclusion from peer-reviewed genetic research is that haplogroup G did not have an historic or genetic impact on the demographics of the British Isle. Published peer reviewed studies do not identify a specific or a series of specific genetic migratory instances as “the” Welsh G explanation.
Based on a review of ancient DNA studies and data from genetic genealogical projects to date, the historical presence of haplogroup G in various areas of Wales reflects the occurrence of several different isolated arrivals of individuals or families and subsequent local paternal founder effects in different time periods and migratory paths. Many of these G haplogroup males were probably a genetic minority among larger socio-cultural groups that were predominantly represented genetically by the R1b haplogroup and a mosaic mixture of other haplogroups.
The key discriminator for documenting the presence of haplogroup G in Wales is isolating and documenting specific downstream SNP-defined subclades or branches and its closest dated matches based on YDNA test results and the discovery of ancient YDNA samples. What is intriguing and exciting are the discoveries that emerge through unpublished genetic genealogical work. This work, based on the advancements in YDNA testing and analysis through commercial DNA companies, has led to incremental discoveries and documentation of specific migratory paths of G haplogroup ancestors into the area that is now called Wales. [22]
What are specific downstream SNP-defined subclades or branches
A SNP-defined subclade or branch is a specific subgroup on a genetic family tree—such as a Y-DNA or mitochondrial DNA tree—identified by a unique single-nucleotide change (SNP). When a distinct single-letter DNA mutation occurs and passes to descendants, it forms a permanent new “branch” or “subclade” that separates that lineage from others.
As further unique mutations pile up over generations within those groups, they split into smaller, more localized sub-branches called subclades. Unlike fast-changing genetic markers, like Short Tandem Repeats (STRs), SNPs rarely mutate back or change randomly, making them proof of a shared lineage. [23]
How Haplogroup G arrived in the British Isles
With the risk of oversimplification, based on a review of scientific peer reviewed literature and what I call citizen-based science (genetic genealogical research), there are three major explanations of the presence of the G haplogroup in Great Britain and specifically in Wales. These explanations are based on:
- The Neolithic Farmer Migration (c. 4000–3000 BC);
- The “Survival in the West” Theory; and
- Later Historic Intrusions (Roman, Anglo-Saxon, Viking, Norman invasion, and Flemish influences).
Neolithic Farmer Migration
The predominant scientific argument is that G2a arrived as part of the initial expansion of agriculture from Anatolia (modern Turkey) into Europe. These farmers moved along the Mediterranean coast, eventually moving up the Atlantic coast of Iberia and France, arriving in Britain and Ireland. Ancient DNA (aDNA) from Neolithic skeletons across Europe, including Britain, shows a high frequency of G2a. These early farmers introduced domesticated plants and animals (sheep, cattle) to the British Isles, with G2a serving as one of the paternal markers of this period. [24]
Haplogroup G-M201 has deep roots around eastern Anatolia, Armenia, and western Iran in major ancient YDNA analyses, but its European branches have separate histories and migratory patterns. Treating a specific Welsh G lineage as direct evidence of a recent Caucasian or Near Eastern ancestor would therefore be a category error. Early European farming populations often carried G2a lineages or subclasses, and British Neolithic people were largely descended from incoming continental farmers (see illustration 1a above). However, that association does not translate into direct evidence that surviving Welsh G lineages are a retained British Neolithic paternal lineage. A direct Neolithic-farmer survival in Wales remains possible but is not demonstrated by British ancient DNA studies, which so far shows Neolithic British male lineages dominated by I2 rather than G2. [25]
The ancient-DNA evidence available for Neolithic Britain cuts against a simple “G2a came with the first Welsh farmers and persisted” story. The British Neolithic male sample in a study by Olalde and colleagues was entirely I2a2 / I2a1b, with no G2a detected. A study by Brace likewise reports no evidence for the G2a-derived lines characteristic of Anatolian Neolithic populations in its British Neolithic Y-chromosome results. [26]
The “Survival in the West” Theory
What I have labeled as the “Survival in the West” Theory focuses on the observation that the G haplogroup is found at very low frequencies in England but often in slightly higher or distinct pockets in Wales and Scotland.
“There are seeming pockets of unusual concentrations within Europe. In Wales, a distinctive G2a3b1 type (DYS388=13 and DYS594=11) dominates there and pushes the G percentage of the population higher than in England.” [27]
Some researchers hypothesize that these lineages are survivors of the original Neolithic population that were pushed to the western “fringes” by later invasions. [28] The evidence points to a distinct G2a3b1 subclade, also known as G-P303, that has been identified in Wales. [29]
“Wales, which supposedly served as a refuge to the Romano-British population fleeing the Anglo-Saxon invasions, has by far the highest percentages of haplogroup E1b1b, G2a and T (total 7.5% against 2.5% for Scotland and 3% for Ireland).” [30]
The above quote is the clearest instance of this narrative, but it is notable that it frames Wales as a post-Roman/Anglo-Saxon refuge (fifth century CE), not specifically a Neolithic-era one — G2a is bundled in as one of several “older” lineages rather than singled out as Neolithic.
The ‘survival-of-the-west’ theory gets extended from the general European template of this line of thought.
“The most likely explanation is that mountains provided refuge for G2a tribes after the Proto-Indo-European speakers invaded Europe from the steppes of Russia and Ukraine during the Late Copper Age and the Bronze Age… By the Iron Age, the G2a population in most of Europe had been decimated by the Indo-European invasions, followed by Celtic warfare. G2a sought refuge from the invaders in the mountains.” [31]
As far as I can tell, this is the actual origin of the “Neolithic survivors pushed to refuge” causal template — written about continental Europe generally (migrating to the Alps, Apennines, Dinaric Alps, Cantabria), then imported into the Wales/Scotland discussion by analogy. This pattern or correlation is found in secondary, genetic-genealogy YDNA literature (e.g. Eupedia website pages, ISOGG-descended project pages, and Wikipedia summaries of STR clusters) by combining several separate academic findings. It does not appear in primary peer-reviewed source research. There are no known peer reviewed research papers that claim “G lineages are Neolithic survivors pushed to the Celtic fringe.”
The actual ancient DNA record for Britain points to I2a, not G2a, as Britain’s dominant Neolithic paternal lineage, which undercuts the premise these secondary sources are built on. [32] However, the absence of G haplogroup ancient YDNA in peer reviewed scholarly studies does not necessarily disprove this hypothetical explanation.
Later Historic Intrusions
Some specific, less common, downstream subclades of the G haplogroup have arrived in Wales and the British Isle through later, smaller-scale migrations from continental Europe. Some of the more prominent time periods where these specific lineages possibly arrived are the following:
- Roman Influence: The Roman Empire included and extended into areas with higher G frequencies, such as Anatolia and the Levant. Soldiers or settlers from these Roman controlled regions may have introduced specific G lineages in Britain.
- Anglo-Saxon Migration: A plausible narrative is that specific G haplogroup lineages living in Germanic northwest areas of Western Europe utilized established Anglo-Saxon-Frisian dominated North Sea trading networks to migrate to eastern areas of the post Roman era British Isle. This is the hypothesized path for the Griff(is)(es)(ith) lineage.
- Viking Age Incursions: Scandinavian migration, which introduced higher frequencies of other haplogroups (like I1 and R1a), may have brought small numbers of G2a, particularly to western Wales, Scotland and Northern England.
- Norman Invasion: This line of research explicitly includes descendants of haplogroup G2a as part of “the Viking thumbprint” alongside I1, N, R1a and R1b, on the reasoning that Norman warbands themselves carried a residual Scandinavian-associated genetic profile inherited from Rollo’s Norse settlers in Normandy.
- Flemish Influence: Several waves of Flemish migration to England, Wales and Scotland occurred in the medieval ages. The term “Flemish” has been used to refer to natives of the ‘Low Countries’ in general rather than Flanders specifically. While the historic and predominant YDNA haplogroup for the Flemish population is R1b, and to a lesser extent haplogroup I1, trace percentages of haplogroups J, E3b (E-V13), and G2a appear, reflecting secondary Neolithic and Roman-era contributions.
The Roman influence
Based on peer-reviewed ancient-DNA literature and modern genealogical-genetics papers, there is not a large body of academic work confirming G-haplogroup arrival in Britain specifically during the Roman era. Most rigorous ancient DNA studies find little to no Roman-period presence for haplogroup G.
Rome occupied Wales for roughly 350 years with an estimated 30,000 troops by 70 CE, drawing soldiers and civilians from Syria, Turkey, the Balkans, Spain, and Gaul — a genuinely multi-ethnic colony centered on Caerleon, not just a military camp. Elizabeth Hirschman argues many Roman-era families stayed after the empire’s collapse. Hirschman points to supporting haplogroups, including G-Z727/M201/Z725, G-M377, R-Z326, G-P15/G2, and T-M70, matched to modern samples from Germany, Armenia, Syria, and elsewhere in the former Roman world. [33]
Hirschman also argues that Carthaginian traders — descendants of Canaanite / Phoenician seafarers — sailed past Gibraltar seeking Cornish and Welsh tin (needed for bronze) and may have established a mining/trading settlement on the Bristol Channel lasting roughly 200 years, until the Punic Wars. She proposes the Silures, the Welsh tribe of southeastern Wales, may have partly descended from these settlers rather than being purely Celtic — citing Tacitus’s description of their “swarthy faces and twisted locks” and shared burial customs with North Africa. DNA evidence cited includes haplogroups G-M285/M201, E-M34, E-M183, G-P303 (linked to Carthaginian-founded Ibiza), T-M70, J-Z640, and a mtDNA U5b match between a Welsh woman and an excavated Carthaginian male from Byrsa Hill, Tunisia. [34]
Researchers, however, should treat Hirshman’s work as a provocative hypothesis generating essay rather than a peer-reviewed genetic study, and should weigh its claims against more rigorously reviewed literature on Welsh population genetics before citing its specific conclusions. [35]
In another study, Christiana Scheib and associates sequenced 52 ancient genomes from Roman-period Cambridgeshire (100–400 CE) and found exactly one G2a individual (sample DUX006, from Duxford) among their Roman-era males. However, the researchers explicitly attribute this lineage to an earlier Iron Age introduction from the continent, based on its presence in the earlier Iron Age dataset from a study by Patterson and associates, not to a new Roman-period arrival. Their broader conclusion is that Roman occupation left “no evidence of long-distance migration from elsewhere in the Empire” in this rural sample and that “present-day patterns of genetic ancestry composition in Britain emerged after the Roman period.” [36]
A 2016 study by Rui Martiniano and associates sequenced the Roman-era York (Driffield Terrace) cemetery. The Y-haplogroups found were R1b (six of seven individuals) and one J2-L228 individual of likely Middle Eastern origin — no G haplogroup was identified. [37]
Anglo-Saxon Migration
In the post Roman era, specific minority G haplogroup lineages that were members of Anglo, Saxon, Frisian social groups in the northwest areas of Western Europe utilized established Anglo-Saxon-Frisian North Sea trading networks to migrate to eastern areas of the British Isle. These migratory paths are in context with larger migratory waves associated with social groups associated with the dominant R1b haplogroup. As discussed in previous stories, this is the hypothesized path for the Griff(is)(es)(ith) lineage. [38]
Since 2002, several peer-reviewed studies argue the Anglo-Saxon migration left a substantial mark on YDNA in parts of Britain, though estimates of scale vary considerably and later ancient-DNA work has tempered the more extreme early figures. In 2002, Michael Weale and associates sampled 313 men across seven towns on an east-west transect from East Anglia to North Wales, in addition to 177 Frisian and Norwegian comparison samples. Their study found Central English towns were genetically near-indistinguishable from the Frisian samples, while North Welsh towns differed sharply from both. The authors of the study concluded this was best explained by a mass migration of Anglo-Saxon Y chromosomes contributing 50–100 percent to the Central English male gene pool at the time, with no comparable migration into North Wales. [39]
In a 2003 study, Christian Capelli and fourteen other research associates analyzed 1,772 Y chromosomes across 25 British and Irish locations plus Norwegian, Danish, German, and Irish comparison samples. They found a more heterogeneous, geographically patchy pattern of continental input than Weale’s earlier study — different parts of the British Isles show “sharply different paternal histories.” Their estimates for England ranged from 24.4 percent to 72.5 percent (mean 54.1 percent), using Danish – north German populations as Anglo-Saxon proxies, estimates that were lower and more variable than Weale’s figures, but still substantial. [40]
Mark Thomas, Michael Stumpf and Heinrich Härke in 2006 took the Weale/Capelli Y-chromosome findings as a starting puzzle. How could an historically small migrant population, plausibly 10,000–200,000 people, produce 50–100 percent Y-chromosome replacement? They proposed that a socially stratified system, limiting intermarriage between Anglo-Saxons and native Britons, combined with a reproductive/status advantage for the incoming group, could push an initial 5–20 percent immigrant Y-chromosome share past 50 percent within five to fifteen generations through non-random mating rather than sheer numbers. [41]
In 2016, Martiniano and associates sequenced 9 ancient genomes from York: seven from the Roman-era, one from the Iron Age, and one from the Anglo-Saxon era. Six of the seven Roman genomes were R1b-L52/L11 and closely resembled the earlier Iron Age sample and modern Welsh populations — but the single Anglo-Saxon-period genome (I1-S107, a Nordic-associated haplogroup) differed sharply, which the authors read as consistent with the Anglo-Saxon migration driving “major genetic change in Eastern Britain,” while explicitly cautioning that one sample can not be over-interpreted. The paper also cites Leslie et al.’s genome-wide (not Y-specific) finding of a 35 percent German-source contribution to modern central/southern English ancestry. [42]
Gretzinger and eighty research associates perhaps produced the most rigorous word on the subject in 2022. The study by Gretzinger et al. provided revolutionary scale and clarity to the debate over early medieval population shifts in Britain. By analyzing genome-wide ancient DNA from roughly 460 medieval individuals, it proved that early English society was shaped by large-scale, population-level migration rather than just a small ruling elite, showing that people in eastern England derived up to 76 percent of their ancestry from the continental North Sea zone. [43]
The study analyzed four hundred and sixty genome-wide ancient DNA samples (278 from England) spanning 200 to 1300 CE, the largest early-medieval aDNA study to date. It explicitly contrasts its whole-genome results against the older Y-chromosome-only studies, noting those had inferred 50–100 percent male-lineage replacement in eastern England. This genome-wide data instead show continental northern European (CNE) ancestry reaching roughly 76 percent in some early medieval eastern English individuals but averaging closer to 30–40 percent in the modern southeastern English gene pool overall — a substantial but less all-encompassing picture than the pure-Y-DNA studies suggested and one that reveals the migration as demographically large but regionally uneven and mixed with sustained intermarriage rather than simple wholesale replacement.
Based on the results of their study, they argued that a large-scale, family-based migration from the continental North Sea zone into post-Roman England lead to a major population turnover in much of eastern and central England. This lead to a structured, regionally variable early English gene pool. It also concluded that early medieval social and burial practices cannot be reduced to simple “immigrant vs local” or “elite vs native” dichotomies. [44]
The 2022 Gretzinger study, using much larger genome-wide ancient DNA rather than modern Y-chromosomes, is benchmark study. It confirms a substantial and geographically patterned continental YDNA and autosomal impact concentrated in eastern England, while showing the process was more mixed and less uniformly “50-100%” than the earliest Y-chromosome papers implied, and the Anglo-Saxon influence essentially absent in Wales.
Viking Age Incursions
While there is no dedicated peer-reviewed papers that directly discuss the “haplogroup G arriving in Britain via Viking incursions”, there is evidence bearing on the question. It points to something more nuanced than a direct Britain-bound G haplogroup migration.
In a landmark 2020 Nature study, Ashot Margaryan and eight-nine other research associates sequenced 442 Viking-era genomes from Scandinavia and Viking-contact sites across Europe (including Scotland, Ireland, the Baltic, Ukraine, Russia and Greenland) and found that alongside the dominant Scandinavian Y-lineages (R1a, R1b, I1), a small number of individuals carried rarer haplogroups: G (n=3), J (n=3), and T (n=2). The authors explicitly flagged this as evidence of a “possible non-Scandinavian male genetic component in Viking Age Northern Europe,” noting that the carriers of these lineages date to the later Viking Age (tenth century and after), which “might indicate some male gene influx into the Viking population during the Viking period“. [45]
A 2023 review compiling ancient G-P15 frequencies across cultures cites the same 3-in-276 figure for the pooled “Viking” grouping (Sweden, Russia, Norway, Estonia, UK, Denmark, 700–1100 CE) but does not break the three positives down by country, so it is possible — but not documented — that one came from a Britain. [46]
‘Citizen-science’ genealogy projects go further than the academic literature. FamilyTreeDNA’s Viking & Invader YDNA Project explicitly lists G (specifically G2a) alongside F, I1, I2, N, R1a and R1b as haplogroups “reasonably thought to have participated in the Viking and Invader migration,” describing G2a as part of “the Viking thumbprint”. This reflects community level pattern matching on modern testers’ results rather than ancient-DNA verification, so it should be weighted as a hypothesis generating source, not a confirmed finding. [47]
Nonetheless, this is a plausible hypothesis. Haplogroup G is fundamentally a Near Eastern/Caucasus-derived Neolithic farmer lineage that is rare but present at low frequency across Scandinavia by the Viking Age through earlier southern / eastern admixture (the same gene flow Margaryan et al. describe as entering Scandinavia “from the south and east” before and during the Viking period). A Scandinavian-based G carrier could in principle have been swept into Viking raiding/settlement parties bound for Britain, even though no such individual has yet been sequenced there.
The consistent scholarly consensus across these works is that Wales suffered real but comparatively limited and non-colonizing Viking activity — mostly coastal raiding (Anglesey, St David’s, Pembrokeshire, Gower) rather than the settlement and political absorption seen in Ireland, England’s Danelaw, or Orkney — which is precisely why the genetic and toponymic [48] influence is fainter than in those regions. [49]
Norman Invasion
Peer-reviewed population genetics treats 1066 CE Norman invasion as a minor contributor to Britain’s YDNA pool. From a genetic standpoint, it had more of an impact on the social groups associated with the upper Feudalist class structure than on the middle and lower population strata. Various studies also do not single out haplogroup G as a Norman marker.
The 2022 Nature Gretzinger study by Gretzinger et al of the early English gene pool, which does detect a clear signal for the Anglo-Saxon migration (large increases in R1b-U106, R1a-M420, I2a1-L460, and I1-M253 in early medieval England), does not identify any post-1066 continental YDNA signature for haplogroup G. The Norman period is not treated as a detectable inflection point for that haplogroup in the ancient-DNA record. [50]
The University of Leicester’s King & Jobling body of work, which is a standard academic framework for connecting the Conquest to genetic genealogy, focuses on establishing that hereditary surnames arrived with the Normans and spread down through society by the fourteenth–sixteenth centuries. This is treated as the Conquest’s real genetic genealogy legacy (the tool that lets researchers link YDNA to documented ancestry), not a claim that the Normans specifically imported haplogroup G males. [51]
The University of Leicester’s genetic sampling on the Cotentin Peninsula aimed to measure the intensity and scale of ninth and tenth-century Scandinavian colonization in the core Norman homeland. By testing local DNA, researchers sought to see if invading Vikings largely replaced local populations or merely formed a ruling elite. The Leicester’s Cotentin Peninsula sampling of the Norman homeland itself found G2a as part of a residual “other” category behind R1b and I1, not flagged as a distinguishing Norman-import lineage. [52] The one academic paper explicitly probing Norman patrilineal origins discusses continental haplogroups broadly and even the possibility of a residual Scandinavian contribution from the “last Norman invaders,” but never names haplogroup G as part of that discussion. [53]
Flavio De Angelis and colleagues utilized ancient DNA from the Priory Orchard cemetery at Godalming (Surrey) to test how the Norman Conquest of 1066 CE affected the genetic makeup of a rural English community (see illustration four). In short, the study finds that this rural population shows long‑standing North Sea–linked ancestry, with substantial Scandinavian (Viking‑related) and Saxon components, but no detectable genome‑wide shift in ancestry composition across the Conquest horizon, implying demographic continuity rather than mass replacement. [54]
Illustration Four: Location and excavation of the Priory Orchard of Godalming (POG) cemetery in Surrey, England

Their results suggest that rural southern England experienced demographic continuity through the Norman Conquest, rather than a sudden influx or replacement of people from Normandy. The visible Norman impact—on language, administration, and elite culture—appears largely decoupled from large‑scale population turnover at the level of this rural community. The study therefore argues that the “Norman legacy” in rural England is primarily social and institutional, mediated through elite networks and later cross‑Channel contacts, not through a dramatic change in local genetic ancestry. [55]
De Angelis et al.’s findings sit very comfortably with the emerging picture from both large‑scale aDNA panels and what one can reasonably infer from post‑Conquest YDNA work: big demographic shifts across the North Sea happened mainly in the fifth to seventh centuries, whereas 1066 looks like a political and elite turnover with only limited, locally variable genetic impact in rural southern England.
Academically, the Conquest is not identified as a driver of haplogroup G migration into England and Wales. The ancient-DNA and Leicester surname-based literature centers Anglo-Saxon and Viking migrations for detectable YDNA shifts, and treats Norman-era G2a as incidental background diversity in the Norman homeland population.
In ‘citizen-science’ based genetic genealogy, by contrast, it is fairly common to see haplogroup G bucketed into a broader “Norman minority cluster” (with E, I1, J1, J2) on pattern-matching grounds — a rarity in Britain relative to the continent, and geographic association with Norman-settled regions. This is an ongoing project-level hypothesis that is steadily accumulating documented findings. There is historical research that provides support to this ”hypothesis’. [56]
Flemmish Influence
Flemish settlers permanently altered the culture and geography of medieval Wales, leaving a legacy that remains visible today. Medieval migrations brought people from the ‘Low Countries’ to Britain. People often called them “Flemish” even if they were not from Flanders. The main male genetic marker for these groups is R1b, along with some I1. Small amounts of J, E3b, and G2a also show up from older Roman and Neolithic times.
The most significant and lasting Flemish settlement occurred in south Pembrokeshire during the early twelfth century. King Henry I expelled a large number of Flemish immigrants from England and resettled them in Wales around 1108. The English Crown used the battle-hardened Flemish as a human buffer zone to secure newly conquered lands against Welsh uprisings. Settlers completely pushed out the native Welsh population from the southern half of the county. [57]
The settlement was so dense that south Pembrokeshire became known as “Little England beyond Wales” because the Welsh language disappeared from the area. The Flemish adopted English quickly, and their presence permanently established English as the primary language of the region centuries before it spread elsewhere in Wales. Local village names like ‘Flemington’ and ‘Flemish Way’ still mark their historical footprint. [58]
No major genetic studies focus specifically on Flemish migrations bringing the G haplogroup to Wales. However, broad DNA data and regional studies provide a clear picture of how these two histories intersect. Genetic data from organizations like the FamilyTreeDNA Flanders-Flemish DNA Project shows that while R1b and I1 dominate the region, Haplogroup G-M201 consistently appears as a trace marker (around three to four percent of the population). This means that the pool of twelfth-century Flemish migrants heading to Pembrokeshire almost certainly included some males carrying the G haplogroup. [59]
Genetic genealogical projects, such as the FamilyTreeDNA Flanders-Flemish DNA project [60], document G2a YDNA members that trace their earliest known ancestors to Flemish regions.
Wales Differed from the Rest of England
Based on three decades of genetic studies, the consensus is the Welsh region of the British Isle preserved a pre-Roman insular Bronze/Iron Age genetic profile whose paternal core is the product of steppe-mediated migration of Beaker-cultured derived social groups associated with R1b-P312/L21. The Welsh region retained a Bronze Age western European genetic layer under relative isolation, while England received a substantial later admixture (Iron Age continental and Anglo-Saxon) of genetic influences. This genetic isolation was based on at least four major factors.
Geography set the initial conditions. Wales is mountainous and peripheral, with the Cambrian Mountains forming a natural buffer, and the Anglo-Saxon advance moved west from the eastern and southern coasts most exposed to North Sea crossings — the earliest and heaviest settlement was always going to concentrate in the flatter, more accessible east before (if ever) reaching the Welsh uplands.
Political and military resistance maintained the boundary for centuries. Weale et al. explicitly argue that the genetic barrier reflects sustained conflict between Welsh and Anglo-Saxon kingdoms — Anglo-Saxon culture and settlement spread throughout England but never substantially crossed into Wales, and many Britons are believed to have retreated into Wales as the Anglo-Saxons advanced.
This political-military separation was formalized by Offa’s Dyke [61], a 240 km earthwork built around 790 CE, and persisted as an effective ethnic/political frontier until Edward I’s conquest of Wales in 1282 — roughly 1,500 years during which male-mediated gene flow across that border was actively restricted. Weale’s paper makes the striking point that “the Welsh border was more of a genetic barrier to Anglo-Saxon Y-chromosome gene flow than the North Sea” — i.e., the cultural/political boundary mattered more than geographic distance itself, since the Central English samples were statistically indistinguishable from Frisia across the sea, yet sharply distinct from North Wales just tens of kilometers away.
‘Commoner-level’ migration into Wales during this time period was massive and deliberate — not incidental to the Norman elite conquest. Marcher lords viewed “deep settlement of foreign peasantsas a more effective method of control than a thin layer of noblemen“. Breton, Flemish, Norman, and English commoners were recruited into south Wales from the 1100s onward. [62]
Linguistic and cultural separation reinforced the barrier. The survival of a distinct Welsh (Brythonic Celtic) language and cultural identity throughout this period both reflects and likely helped maintain low intermarriage rates across the border, the same mechanism Thomas, Stumpf & Härke’s 2006 model invokes to explain how a demographically modest migration achieved outsized Y-chromosome impact in England — a mechanism that, by the same logic, would have had far less traction in a population it never substantially penetrated.
The result was genetic continuity rather than replacement. Many of the Welsh-specific studies converge on the same theme: Wales retained a Y-chromosome and broader genomic signature tracing to a pre-Roman insular Bronze/Iron Age profile whose paternal core is steppe-mediated, Beaker-derived R1b-P312/L21. The Welsh area retained a Bronze Age western European genetic layer under relative isolation, while England received substantial later admixture (Iron Age continental and Anglo-Saxon influences).
Trace amounts of other YDNA lineages, such as the G haplogroup, entered into the Welsh region at different historical time periods as ‘cultural hitchhikers’ with social groups that genetically represented Rib haplogroups. The ability to document these specific lines of descent are largely based on unpublished genetic genealogical work. Based on the advancements in YDNA testing and analysis through commercial DNA companies, this genetic genealogical work has led to incremental discoveries and documentation of specific migratory paths of G haplogroup ancestors into the area that is now called Wales.
Sources
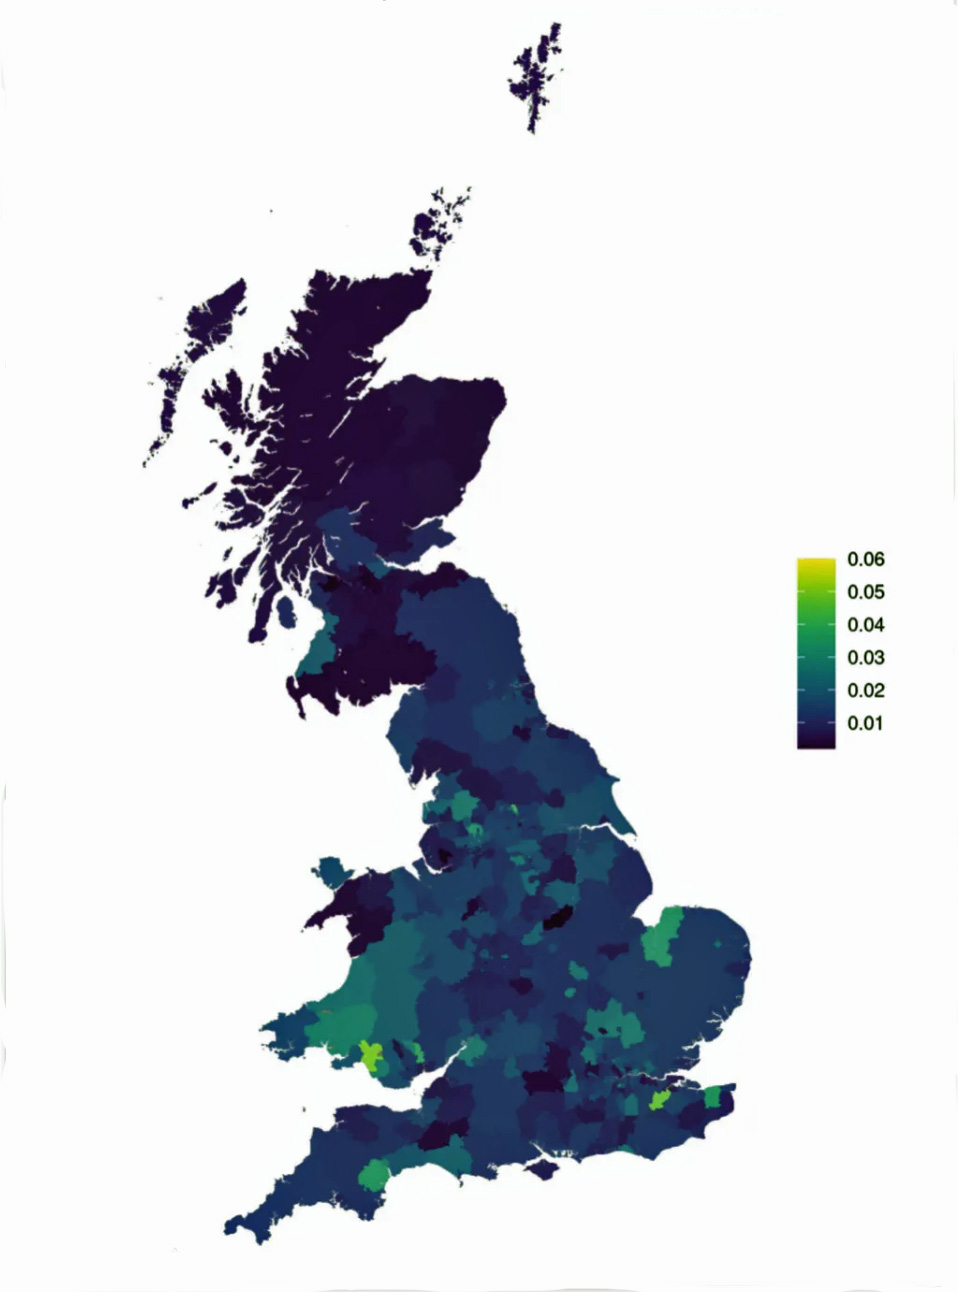
Feature Image: The banner depicts five density distribution maps of specific G haplogroups of sampled men in a 2022 study on the possible effect of Y chromosome variation on coronary artery disease and mortality in the United Kingdom. The maps graphically depict the trace imprint of the G haplogroup across Great Britain and its relatiively greater presence in the Welsh areas of the island.
Background of the study: The study systematically assessed the association between genetic variation in the male-specific region of the Y chromosome (MSY) and cardiovascular disease outcomes. The researchers conducted a kin-cohort analysis of family disease history using the largest sample to date. The study involved testing 90 MSY haplogroups against several cardiovascular health indicators including coronary artery disease, hypertension, blood pressure, classical lipid levels, and all-cause mortality. Although the study did not find a relationship between genetic variation and heart disease, the Timmers and Wilson study is distinctive for several conceptual and methodological contributions that set a new standard for Y chromosome association research.
Source: Timmers PRHJ, Wilson JF. Limited Effect of Y Chromosome Variation on Coronary Artery Disease and Mortality in UK Biobank-Brief Report. Arterioscler Thromb Vasc Biol. 2022 Sep;42(9):1198-1206. doi: 10.1161/ATVBAHA.122.317664. Epub 2022 Jul 14. PMID: 35861954; PMCID: PMC9394501. https://pubmed.ncbi.nlm.nih.gov/35861954/
See also Timmers, Paul RHJ; Wilson, James F. (2022). Prevalence of Y chromosome haplogroups by area of birth in UK Biobank, [image]. University of Edinburgh. https://doi.org/10.7488/ds/3472. https://datashare.ed.ac.uk/items/9689deac-38af-4c5c-996a-168d4d759770
[1] See Jim Griffis, Is the Huntington NY Griff(is)(es)(ith) Family Name Welsh?, 17 Mar 2023, Griffis Family: Selected Series from the Past, https://griffis.org/is-the-huntington-ny-griffisesith-family-name-welsh/
[2] In 1100 CE, Wales was a collection of independent Welsh kingdoms—most notably Gwynedd and Powys—that were actively resisting Norman encroachment. Following the Norman Conquest of England, foreign lords had seized significant portions of southern and border lands, creating the Welsh Marches (Marchia Wallia). Consequently, Wales was split between Pura Wallia (“pure Wales,” under native rule) and the militarized, Norman-controlled borderlands. It lacked a single, unified government, functioning instead as a society defined by warrior aristocracy and tribal allegiances.
The primary kingdoms, which were resisting Norman encroachment, were Gwynedd in the northwest, Powys in the east, and Deheubarth in the southwest. Following the Norman Conquest of England (1066), Norman Marcher Lords (such as Hugh of Avranches, Earl of Chester) moved quickly to seize Welsh lands. By 1093, the Normans had occupied most of Wales and built many castles. After a period of initial success by the Normans, a major Welsh revolt broke out in 1094. By 1100, the Welsh had largely regained control of much of their territory, specifically driving the Normans out of Gwynedd, Ceredigion, and most of Powys.
Wales in the High Middle Ages, Wikipedia, This page was last edited on 8 February 2026, https://en.wikipedia.org/wiki/Wales_in_the_High_Middle_Ages
Wales in the Middle Ages, Wikipedia, This page was last edited on 8 March 2026, https://en.wikipedia.org/wiki/Wales_in_the_Middle_Ages
[3] Cymry is the native Welsh-language word for the Welsh people. It comes from the old Brythonic word combrogi, which means “fellow-countrymen” or “compatriots”. (The name for the country of Wales itself is spelled Cymru).
Cymru, Wikipedia, This page was last edited on 27 June 2026, https://en.wikipedia.org/wiki/Cymru
Welsh People, Wikipedia, This page was last edited on 11 August 2026, https://en.wikipedia.org/wiki/Welsh_people
Wales, Wikipedia, This page was last edited on 5 August 2026, https://en.wikipedia.org/wiki/Wales
Etymology of Wales, Wikipedia, This page was last edited on 30 October 2025, https://en.wikipedia.org/wiki/Etymology_of_Wales
[4] Charles-Edwards, T. M., Wales and the Britons, 350-1064 (Oxford, 2012; online edn, Oxford Academic, 24 Jan. 2013), https://doi.org/10.1093/acprof:oso/9780198217312.001.0001
[5] Charles-Edwards, T. M., ‘Introduction: The Lands of the Britons’, Wales and the Britons, 350-1064(Oxford, 2012; online edn, Oxford Academic, 24 Jan. 2013), https://doi.org/10.1093/acprof:oso/9780198217312.003.0001
[6] Thomas R. Kymry, Walenses, Brytaniaid, Britones: Naming the Welsh in the Middle Ages. Early Medieval England and its Neighbours. 2025;51:e6. doi:10.1017/ean.2024.8, https://www.cambridge.org/core/journals/early-medieval-england-and-its-n/article/kymry-walenses-brytaniaid-britones-naming-the-welsh-in-the-middle-ages/72393FB4685400271F0A0A4F3C094471
[7] Thomas R. Kymry, Walenses, Brytaniaid, Britones: Naming the Welsh in the Middle Ages. Early Medieval England and its Neighbours. 2025;51:e6. doi:10.1017/ean.2024.8, https://www.cambridge.org/core/journals/early-medieval-england-and-its-n/article/kymry-walenses-brytaniaid-britones-naming-the-welsh-in-the-middle-ages/72393FB4685400271F0A0A4F3C094471
Historia Brittonum, Wikipedia, This page was last edited on 1 July 2026, https://en.wikipedia.org/wiki/Historia_Brittonum
Armes Prydein, Wikipedia, This page was last edited on 22 July 2026, https://en.wikipedia.org/wiki/Armes_Prydein
[8] Thomas R. Kymry, Walenses, Brytaniaid, Britones: Naming the Welsh in the Middle Ages. Early Medieval England and its Neighbours. 2025;51:e6. doi:10.1017/ean.2024.8, https://www.cambridge.org/core/journals/early-medieval-england-and-its-n/article/kymry-walenses-brytaniaid-britones-naming-the-welsh-in-the-middle-ages/72393FB4685400271F0A0A4F3C094471
[9] Endonym and exonym, Wikipedia, This page was last edited on 15 July 2026, https://en.wikipedia.org/wiki/Endonym_and_exonym
[10] Thomas R. Kymry, Walenses, Brytaniaid, Britones: Naming the Welsh in the Middle Ages. Early Medieval England and its Neighbours. 2025;51:e6. doi:10.1017/ean.2024.8, https://www.cambridge.org/core/journals/early-medieval-england-and-its-n/article/kymry-walenses-brytaniaid-britones-naming-the-welsh-in-the-middle-ages/72393FB4685400271F0A0A4F3C094471
[11] Charles-Edwards, T. M., ‘Introduction: The Lands of the Britons’, Wales and the Britons, 350-1064(Oxford, 2012; online edn, Oxford Academic, 24 Jan. 2013), https://doi.org/10.1093/acprof:oso/9780198217312.003.0001 , https://academic.oup.com/book/10443/chapter-abstract/158279660?redirectedFrom=fulltext
[12] As of the writing of this story, the most recent publically recognized haplogroup for the YDNA lineage for the Griff(is)(es)(ith) lineage G-BY211678. There is insufficient information to estimate the location of the most recent common ancestor asociated with haplogroup G-BY211678. The geographical location of the preceding haplogroup, G-Y132505, is estimated to be in an area currently known as Wales. Hence, the Griff(is)(es)(ith)YDNA lineage is estimated to have been in the Wales since approximately 1100 CE.
Recent YDNA Lineage for G-Y211678
| Haplogroup | Age Estimate | Years before Prior Haplogroup | Immediate Descendants | Number of Tested Modern Descendants |
|---|---|---|---|---|
| Haplogroup | Age Estimate | Time Passed | Immediate Descendant Haplogroups | Tested Modern Descendants |
| G-BY211678 | 1400 CE | 300 years | 2 | 11 |
| G-Y132505 | 1100 C | 150 years | 4 | 14 |
| G-Z40857 | 950 CE | 250 years | 4 | 60 |
| G-Y38335 | 700 CE | <100 years | 2 | 62 |
| G-Z6748 | 650 CE | 2,850 years | 2 | 153 |
[13] In Wales, it represents the dominant paternal lineage, appearing in a large majority of Welsh men. It links the native population to the ancient, seafaring Insular Celtic groups of Western Europe.
“This haplogroup first emerges in the Early Bronze Age in Britain and Ireland, where the earliest samples begin to appear. Its introduction was part of a large genetic transformation associated with the Bell Beaker culture, wherein steppe descended peoples largely replaced Britain’s earlier Neolithic population. The lineage reached a frequency of 90% in early Bronze Age Britain (being nearly absent in contemporary samples from the continent), it gradually declined through the Middle Bronze Age to 70% by the Iron Age (due to continental migrations which also increased the levels of EEF admixture among Britons). It later fell to its modern levels in Britain after the Anglo-Saxon invasions. However, it still remains the dominant lineage in Ireland, Scotland, Brittany and Wales.“
Haplogroup R-L21, Wikipedia, This page was last edited on 18 August 2026, https://en.wikipedia.org/wiki/Haplogroup_R-L21
See also:
R1b-L21: How the Atlantic Celtic Lineage Entered Britain, 16 Jan 2026, explore Your DNA, https://www.exploreyourdna.com/article/88/r1b-l21-how-the-atlantic-celtic-lineage-entered-britain
Flood, Joe, “The Phylogenealogy of R-L21: Four and a Half Millennia of Expansion and Redistribution” (working paper, 2016), accessed August 2, 2026, http://www.bellavistaranch.net/genealogy/photos/Flood%20-%20L21%20subclades.pdf . **
** The Flood paper does not appear to have been published in a peer-reviewed journal. It circulates as a self-posted working paper — hosted on Academia.edu (first posted April 23, 2016) and mirrored on a private genealogy site — and is cited informally by FamilyTreeDNA project pages. If citing the Academia.edu copy specifically, substitute the URL: https://www.academia.edu/24686284/The_Phylogenealogy_of_R-L21_four_and_a_half_millennia_of_expansion_and_redistribution.
[14] The “rugged landscape as a wall” explanation is more of an inference layered on top than something these specific studies test directly. The broader landscape-genetics literature does support terrain as a real barrier mechanism in general — e.g., work on mountain ranges as physical barriers to gene flow shows environmental, topographic discontinuities can suppress gene flow independent of simple distance.
But for Wales specifically, most of the historical genetic literature (e.g., Thomas, Stumpf & Härke’s 2006 “apartheid-like social structure” model, and the Härke 2002 archaeological-genetic reconciliation) frames the boundary as a compound effect of terrain plus deliberate political – military frontiers (later formalized as Offa’s Dyke and the Marches), language divergence, and differential intermarriage rates limiting how Anglo-Saxon Y-lineages spread westward — rather than topography alone doing the work. So the genetic outcome (stability of Welsh paternal lineages) is very well documented; the “mountains as a wall” causal story is a reasonable but partly interpretive extension that sits alongside political-boundary and social endogamy explanations in the scholarship, not a finding the following papers state in isolation. [a]
Weale et al., “Y Chromosome Evidence for Anglo-Saxon Mass Migration” sampled 313 men from seven towns along an east–west transect from East Anglia to North Wales. Central English towns were genetically homogeneous and statistically indistinguishable from a Frisian sample, while the two North Welsh towns differed sharply from Central England (and from each other). Their population-genetic modeling concluded this reflects a mass Anglo-Saxon migration contributing 50–100 percent of the Central English male gene pool — with no comparable influx reaching North Wales. This study however is limited in its ability to generalize to the southern regions of Wales.[b]
Capelli et al. , “A Y Chromosome Census of the British Isles” extended this observation with 1,772 Y chromosomes from 25 locations, comparing British samples to Norway, Denmark, Germany, and Ireland. They found “sharply different paternal histories” across regions, with genetic continuity (i.e., retained pre-Germanic ancestry) systematically higher moving west and north — Wales showing much less replacement than central/eastern England. [c]
Leslie et al. , “The Fine-Scale Genetic Structure of the British Population” — the Peoples of the British Isles (PoBI) project — used genome-wide SNP data (not just Y-DNA) from 2,039 individuals and found the very first split in the entire dataset separates Wales from the rest of Britain, with a subsequent north/south Wales split. As stated in the Wellcome Trust summary of the paper, the Welsh clusters “represent populations that are more similar to the early post-Ice-Age settlers of Britain than those from elsewhere in the UK,” and a pre-Roman continental migration that reshaped much of England, Scotland, and Ireland “had little impact in Wales.” The same study documented genetic evidence for the Landsker Line — the centuries-old boundary in Pembrokeshire between Welsh- and English-speaking areas — showing that even sub-regional cultural/linguistic borders left a measurable genetic signature. [d]
The “thousands of years” stability is backed by ancient-DNA work rather than just modern-sample inference. Patterson et al. , “Large-Scale Migration into Britain During the Middle to Late Bronze Age” (Reich Lab) traced Y-haplogroup R1b-L21/M529 from ~89±5 percent in Chalcolithic/Early Bronze Age Britain, declining only modestly to ~68±4 percent by the Iron Age, then diverging sharply post-Anglo-Saxon: 43±3 percent surviving in Wales and western England today versus just 14±2 percent in central/eastern England — a statistically significant regional split that the paper attributes to the same historical event Weale and Capelli identified. The related Nature 2025 paper on Iron Age Britain confirms this R1b-L21 continuity held steady through the Iron Age before the Anglo-Saxon-era divergence. [e]
[a] Thomas MG, Stumpf MP, Härke H. Evidence for an apartheid-like social structure in early Anglo-Saxon England. Proc Biol Sci. 2006 Oct 22;273(1601):2651-7. doi: 10.1098/rspb.2006.3627. PMID: 17002951; PMCID: PMC1635457. https://pmc.ncbi.nlm.nih.gov/articles/PMC1635457/
Pattison, John E., Integration versus Apartheid in post-Roman Britain: a Response to Thomas et al. , Human Biology: Vol. 83: Iss. 6, Article 9. 2008, Available at: http://digitalcommons.wayne.edu/humbiol_preprints/18
[b] Weale ME, Weiss DA, Jager RF, Bradman N, Thomas MG. Y chromosome evidence for Anglo-Saxon mass migration. Mol Biol Evol. 2002 Jul;19(7):1008-21. doi: 10.1093/oxfordjournals.molbev.a004160. PMID: 12082121. https://pubmed.ncbi.nlm.nih.gov/12082121/
[c] Capelli C, Redhead N, Abernethy JK, Gratrix F, Wilson JF, Moen T, Hervig T, Richards M, Stumpf MP, Underhill PA, Bradshaw P, Shaha A, Thomas MG, Bradman N, Goldstein DB. A Y chromosome census of the British Isles. Curr Biol. 2003 May 27;13(11):979-84. doi: 10.1016/s0960-9822(03)00373-7. PMID: 12781138. https://pubmed.ncbi.nlm.nih.gov/12781138/
[d] Leslie S, Winney B, Hellenthal G, Davison D, Boumertit A, Day T, Hutnik K, Royrvik EC, Cunliffe B; Wellcome Trust Case Control Consortium 2; International Multiple Sclerosis Genetics Consortium; Lawson DJ, Falush D, Freeman C, Pirinen M, Myers S, Robinson M, Donnelly P, Bodmer W. The fine-scale genetic structure of the British population. Nature. 2015 Mar 19;519(7543):309-314. doi: 10.1038/nature14230. PMID: 25788095; PMCID: PMC4632200. https://pubmed.ncbi.nlm.nih.gov/25788095/
Who do you think you really are? The first fine-scale genetic map of the British Isles, 18 March 2015, Press Release, Welcome Trust, https://wellcome.org/press-release/who-do-you-think-you-really-are-first-fine-scale-genetic-map-british-isles
[e] Patterson, N. et al., Large-scale migration into Britain during the Middle to Late Bronze Age. Nature, 2021, https://doi.org/10.1038/s41586-021-04287-4
Cassidy, L.M., Russell, M., Smith, M. et al. Continental influx and pervasive matrilocality in Iron Age Britain. Nature 637, 1136–1142 (2025). https://doi.org/10.1038/s41586-024-08409-6
[15] Haplogroup R-M269, Wikipedia, This page was last edited on 31 July 2026, https://en.wikipedia.org/wiki/Haplogroup_R-M269
Balaresque P, Bowden GR, Adams SM, Leung H-Y, King TE, et al. (2010) A Predominantly Neolithic Origin for European Paternal Lineages. PLoS Biol 8(1):e1000285. doi:10.1371/journal.pbio.1000285, https://journals.plos.org/plosbiology/article/file?id=10.1371/journal.pbio.1000285&type=printable
Wales in the Middle Ages, Wikipedia, This page was last edited on 8 March 2026, https://en.wikipedia.org/wiki/Wales_in_the_Middle_Ages
Gruffudd, Pyrs, Carter, Harold, Smith, J(enkyn) Beverley. “Wales”. Encyclopedia Britannica, 19 Mar. 2026, https://www.britannica.com/place/Wales .
Davies, Rees, Wales: A Culture Preserved, 17 Feb 2011, BBC , https://www.bbc.co.uk/history/british/middle_ages/culture_preserved_01.shtml#:~:text=Top-,Weaknesses,how%20final%20was%20the%20solution?
Gretzinger, J., Sayer, D., Justeau, P. et al. The Anglo-Saxon migration and the formation of the early English gene pool. Nature 610, 112–119 (2022). https://doi.org/10.1038/s41586-022-05247-2
[16] Iyavoo, Sasitarian and Sharlize Pedroza-Matute, Thomas Haizel, Exploring Y-DNA haplogroup diversity in the British Isles, 30th Congress of the International Society for Forensic Genetics, Universidade de Santiago de Compostela, 2025, pp. 297-303
DOI: https://dx.doi.org/10.15304/cc.2025.1869 , https://zenodo.org/records/15593352
Genetic history of the British Isles, Wikipedia, This page was last edited on 26 January 2026, https://en.wikipedia.org/wiki/Genetic_history_of_the_British_Isles
Hay, Maciamo, Genetic history of the British and the Irish, Oct 2016, Eupedia, https://www.eupedia.com/genetics/britain_ireland_dna.shtml
Warburton, Ray, Genetic History of the British and the Irish, 5 Nov 2019, The Warburton Website, https://warburton.one-name.net/?p=125
Selina Brace, Yoan Diekmann, Thomas J. Booth1, Lucy van Dorp, Zuzana Faltyskova, Nadin Rohland, Swapan Mallick, Iñigo Olalde, Matthew Ferry, Megan Michel, Jonas Oppenheimer, Nasreen Broomandkhoshbacht, Kristin Stewardson, Rui Martiniano, Susan Walsh, Manfred Kayser , Sophy Charlton, Garrett Hellenthal, Ian Armit,Rick Schulting, Oliver E. Craig, Alison Sheridan, Mike Parker Pearson, Chris Stringer, David Reich, Mark G. Thomas and Ian Barnes, Ancient genomes indicate population replacement in Early Neolithic Britain, Nature Ecology & Evolution, 15 Apr 2019, https://reich.hms.harvard.edu/sites/reich.hms.harvard.edu/files/inline-files/2019_Brace_NatureEcologyEvolution_2.pdf
Olalde I, Brace S, Allentoft ME, Armit I, Kristiansen K, Booth T, Rohland N, Mallick S, Szécsényi-Nagy A, Mittnik A, Altena E, Lipson M, Lazaridis I, Harper TK, Patterson N, Broomandkhoshbacht N, Diekmann Y, Faltyskova Z, Fernandes D, Ferry M, Harney E, de Knijff P, Michel M, Oppenheimer J, Stewardson K, Barclay A, Alt KW, Liesau C, Ríos P, Blasco C, Miguel JV, García RM, Fernández AA, Bánffy E, Bernabò-Brea M, Billoin D, Bonsall C, Bonsall L, Allen T, Büster L, Carver S, Navarro LC, Craig OE, Cook GT, Cunliffe B, Denaire A, Dinwiddy KE, Dodwell N, Ernée M, Evans C, Kuchařík M, Farré JF, Fowler C, Gazenbeek M, Pena RG, Haber-Uriarte M, Haduch E, Hey G, Jowett N, Knowles T, Massy K, Pfrengle S, Lefranc P, Lemercier O, Lefebvre A, Martínez CH, Olmo VG, Ramírez AB, Maurandi JL, Majó T, McKinley JI, McSweeney K, Mende BG, Modi A, Kulcsár G, Kiss V, Czene A, Patay R, Endrődi A, Köhler K, Hajdu T, Szeniczey T, Dani J, Bernert Z, Hoole M, Cheronet O, Keating D, Velemínský P, Dobeš M, Candilio F, Brown F, Fernández RF, Herrero-Corral AM, Tusa S, Carnieri E, Lentini L, Valenti A, Zanini A, Waddington C, Delibes G, Guerra-Doce E, Neil B, Brittain M, Luke M, Mortimer R, Desideri J, Besse M, Brücken G, Furmanek M, Hałuszko A, Mackiewicz M, Rapiński A, Leach S, Soriano I, Lillios KT, Cardoso JL, Pearson MP, Włodarczak P, Price TD, Prieto P, Rey PJ, Risch R, Rojo Guerra MA, Schmitt A, Serralongue J, Silva AM, Smrčka V, Vergnaud L, Zilhão J, Caramelli D, Higham T, Thomas MG, Kennett DJ, Fokkens H, Heyd V, Sheridan A, Sjögren KG, Stockhammer PW, Krause J, Pinhasi R, Haak W, Barnes I, Lalueza-Fox C, Reich D. The Beaker phenomenon and the genomic transformation of northwest Europe. Nature. 2018 Mar 8;555(7695):190-196. doi: 10.1038/nature25738. Epub 2018 Feb 21. Erratum in: Nature. 2018 Mar 21;555(7697):543. doi: 10.1038/nature26164. PMID: 29466337; PMCID: PMC5973796. https://pmc.ncbi.nlm.nih.gov/articles/PMC5973796/
Busby GB, Brisighelli F, Sánchez-Diz P, Ramos-Luis E, Martinez-Cadenas C, Thomas MG, Bradley DG, Gusmão L, Winney B, Bodmer W, Vennemann M, Coia V, Scarnicci F, Tofanelli S, Vona G, Ploski R, Vecchiotti C, Zemunik T, Rudan I, Karachanak S, Toncheva D, Anagnostou P, Ferri G, Rapone C, Hervig T, Moen T, Wilson JF, Capelli C. The peopling of Europe and the cautionary tale of Y chromosome lineage R-M269. Proc Biol Sci. 2012 Mar 7;279(1730):884-92. doi: 10.1098/rspb.2011.1044. Epub 2011 Aug 24. PMID: 21865258; PMCID: PMC3259916 https://pmc.ncbi.nlm.nih.gov/articles/PMC3259916/
[17] Genetic history of the British Isles, Wikipedia, This page was last edited on 26 January 2026, https://en.wikipedia.org/wiki/Genetic_history_of_the_British_Isles
Gretzinger, J., Sayer, D., Justeau, P. et al. The Anglo-Saxon migration and the formation of the early English gene pool. Nature 610, 112–119 (2022). https://doi.org/10.1038/s41586-022-05247-2
Iyavoo, Sasitarian and Sharlize Pedroza-Matute, Thomas Haizel, Exploring Y-DNA haplogroup diversity in the British Isles, 30th Congress of the International Society for Forensic Genetics, Universidade de Santiago de Compostela, 2025, pp. 297-303
DOI: https://dx.doi.org/10.15304/cc.2025.1869 , https://zenodo.org/records/15593352
[18] Capelli C, Redhead N, Abernethy JK, Gratrix F, Wilson JF, Moen T, Hervig T, Richards M, Stumpf MP, Underhill PA, Bradshaw P, Shaha A, Thomas MG, Bradman N, Goldstein DB. A Y chromosome census of the British Isles. Curr Biol. 2003 May 27;13(11):979-84. doi: 10.1016/s0960-9822(03)00373-7. PMID: 12781138. https://pubmed.ncbi.nlm.nih.gov/12781138/
Weale ME, Weiss DA, Jager RF, Bradman N, Thomas MG. Y chromosome evidence for Anglo-Saxon mass migration. Mol Biol Evol. 2002 Jul;19(7):1008-21. doi: 10.1093/oxfordjournals.molbev.a004160. PMID: 12082121. https://pubmed.ncbi.nlm.nih.gov/12082121/
Schiffels S, Haak W, Paajanen P, Llamas B, Popescu E, Loe L, Clarke R, Lyons A, Mortimer R, Sayer D, Tyler-Smith C, Cooper A, Durbin R. Iron Age and Anglo-Saxon genomes from East England reveal British migration history. Nat Commun. 2016 Jan 19;7:10408. doi: 10.1038/ncomms10408. PMID: 26783965; PMCID: PMC4735688. https://pubmed.ncbi.nlm.nih.gov/26783965/
Thomas MG, Stumpf MP, Härke H. Evidence for an apartheid-like social structure in early Anglo-Saxon England. Proc Biol Sci. 2006 Oct 22;273(1601):2651-7. doi: 10.1098/rspb.2006.3627. PMID: 17002951; PMCID: PMC1635457. https://pubmed.ncbi.nlm.nih.gov/17002951/
Pattison JE. Is it necessary to assume an apartheid-like social structure in Early Anglo-Saxon England? Proc Biol Sci. 2008 Nov 7;275(1650):2423-9; discussion 2419-21. doi: 10.1098/rspb.2008.0352. PMID: 18430641; PMCID: PMC2603190. https://pubmed.ncbi.nlm.nih.gov/18430641/
Pattison JE. Integration versus apartheid in post-Roman Britain: a response to Thomas et Al. (2008). Hum Biol. 2011 Dec;83(6):715-33. doi: 10.3378/027.083.0604. PMID: 22276970. https://pubmed.ncbi.nlm.nih.gov/22276970/
Scheib CL, Hui R, Rose AK, D’Atanasio E, Inskip SA, Dittmar J, Cessford C, Griffith SJ, Solnik A, Wiseman R, Neil B, Biers T, Harknett SJ, Sasso S, Biagini SA, Runfeldt G, Duhig C, Evans C, Metspalu M, Millett MJ, O’Connell TC, Robb JE, Kivisild T. Low Genetic Impact of the Roman Occupation of Britain in Rural Communities. Mol Biol Evol. 2024 Sep 4;41(9):msae168. doi: 10.1093/molbev/msae168. PMID: 39268685; PMCID: PMC11393495. https://pubmed.ncbi.nlm.nih.gov/39268685/
[19] The Neolithic period, or New Stone Age, lasted roughly from 10,000 BCE to 3,000 BCE, though the exact dates vary greatly depending on the region. In Britain, it lasted from about 4300 BCE to 2000 BCE.
Neolithic Revolution, Wikipedia, This page was last edited on 16 August 2026, https://en.wikipedia.org/wiki/Neolithic_Revolution
Grigsby, Paul ,Neolithic Britain, University of Warwick, Tue 10 Aug 2021, https://warwick.ac.uk/fac/arts/classics/warwickclassicsnetwork/romancoventry/resources/prehistoricbritain/neolithic/
See also:
Patterson N, Isakov M, Booth T, Büster L, Fischer CE, Olalde I, Ringbauer H, Akbari A, Cheronet O, Bleasdale M, Adamski N, Altena E, Bernardos R, Brace S, Broomandkhoshbacht N, Callan K, Candilio F, Culleton B, Curtis E, Demetz L, Carlson KSD, Edwards CJ, Fernandes DM, Foody MGB, Freilich S, Goodchild H, Kearns A, Lawson AM, Lazaridis I, Mah M, Mallick S, Mandl K, Micco A, Michel M, Morante GB, Oppenheimer J, Özdoğan KT, Qiu L, Schattke C, Stewardson K, Workman JN, Zalzala F, Zhang Z, Agustí B, Allen T, Almássy K, Amkreutz L, Ash A, Baillif-Ducros C, Barclay A, Bartosiewicz L, Baxter K, Bernert Z, Blažek J, Bodružić M, Boissinot P, Bonsall C, Bradley P, Brittain M, Brookes A, Brown F, Brown L, Brunning R, Budd C, Burmaz J, Canet S, Carnicero-Cáceres S, Čaušević-Bully M, Chamberlain A, Chauvin S, Clough S, Čondić N, Coppa A, Craig O, Črešnar M, Cummings V, Czifra S, Danielisová A, Daniels R, Davies A, de Jersey P, Deacon J, Deminger C, Ditchfield PW, Dizdar M, Dobeš M, Dobisíková M, Domboróczki L, Drinkall G, Đukić A, Ernée M, Evans C, Evans J, Fernández-Götz M, Filipović S, Fitzpatrick A, Fokkens H, Fowler C, Fox A, Gallina Z, Gamble M, González Morales MR, González-Rabanal B, Green A, Gyenesei K, Habermehl D, Hajdu T, Hamilton D, Harris J, Hayden C, Hendriks J, Hernu B, Hey G, Horňák M, Ilon G, Istvánovits E, Jones AM, Kavur MB, Kazek K, Kenyon RA, Khreisheh A, Kiss V, Kleijne J, Knight M, Kootker LM, Kovács PF, Kozubová A, Kulcsár G, Kulcsár V, Le Pennec C, Legge M, Leivers M, Loe L, López-Costas O, Lord T, Los D, Lyall J, Marín-Arroyo AB, Mason P, Matošević D, Maxted A, McIntyre L, McKinley J, McSweeney K, Meijlink B, Mende BG, Menđušić M, Metlička M, Meyer S, Mihovilić K, Milasinovic L, Minnitt S, Moore J, Morley G, Mullan G, Musilová M, Neil B, Nicholls R, Novak M, Pala M, Papworth M, Paresys C, Patten R, Perkić D, Pesti K, Petit A, Petriščáková K, Pichon C, Pickard C, Pilling Z, Price TD, Radović S, Redfern R, Resutík B, Rhodes DT, Richards MB, Roberts A, Roefstra J, Sankot P, Šefčáková A, Sheridan A, Skae S, Šmolíková M, Somogyi K, Somogyvári Á, Stephens M, Szabó G, Szécsényi-Nagy A, Szeniczey T, Tabor J, Tankó K, Maria CT, Terry R, Teržan B, Teschler-Nicola M, Torres-Martínez JF, Trapp J, Turle R, Ujvári F, van der Heiden M, Veleminsky P, Veselka B, Vytlačil Z, Waddington C, Ware P, Wilkinson P, Wilson L, Wiseman R, Young E, Zaninović J, Žitňan A, Lalueza-Fox C, de Knijff P, Barnes I, Halkon P, Thomas MG, Kennett DJ, Cunliffe B, Lillie M, Rohland N, Pinhasi R, Armit I, Reich D. Large-scale migration into Britain during the Middle to Late Bronze Age. Nature. 2022 Jan;601(7894):588-594. doi: 10.1038/s41586-021-04287-4. Epub 2021 Dec 22. PMID: 34937049; PMCID: PMC8889665. https://pmc.ncbi.nlm.nih.gov/articles/PMC8889665/
Schiffels S, Haak W, Paajanen P, Llamas B, Popescu E, Loe L, Clarke R, Lyons A, Mortimer R, Sayer D, Tyler-Smith C, Cooper A, Durbin R. Iron Age and Anglo-Saxon genomes from East England reveal British migration history. Nat Commun. 2016 Jan 19;7:10408. doi: 10.1038/ncomms10408. PMID: 26783965; PMCID: PMC4735688. https://pubmed.ncbi.nlm.nih.gov/26783965/
Gretzinger, J., Sayer, D., Justeau, P. et al. The Anglo-Saxon migration and the formation of the early English gene pool. Nature 610, 112–119 (2022). https://doi.org/10.1038/s41586-022-05247-2
Weale ME, Weiss DA, Jager RF, Bradman N, Thomas MG. Y chromosome evidence for Anglo-Saxon mass migration. Mol Biol Evol. 2002 Jul;19(7):1008-21. doi: 10.1093/oxfordjournals.molbev.a004160. PMID: 12082121. https://pubmed.ncbi.nlm.nih.gov/12082121/
Martiniano R, Caffell A, Holst M, Hunter-Mann K, Montgomery J, Müldner G, McLaughlin RL, Teasdale MD, van Rheenen W, Veldink JH, van den Berg LH, Hardiman O, Carroll M, Roskams S, Oxley J, Morgan C, Thomas MG, Barnes I, McDonnell C, Collins MJ, Bradley DG. Genomic signals of migration and continuity in Britain before the Anglo-Saxons. Nat Commun. 2016 Jan 19;7:10326. doi: 10.1038/ncomms10326. PMID: 26783717; PMCID: PMC4735653. https://pmc.ncbi.nlm.nih.gov/articles/PMC4735653/
Margaryan, A., Lawson, D.J., Sikora, M. et al. Population genomics of the Viking world.Nature 585, 390–396 (2020). https://doi.org/10.1038/s41586-020-2688-8, https://www.nature.com/articles/s41586-020-2688-8
Leslie S, Winney B, Hellenthal G, Davison D, Boumertit A, Day T, Hutnik K, Royrvik EC, Cunliffe B; Wellcome Trust Case Control Consortium 2; International Multiple Sclerosis Genetics Consortium; Lawson DJ, Falush D, Freeman C, Pirinen M, Myers S, Robinson M, Donnelly P, Bodmer W. The fine-scale genetic structure of the British population. Nature. 2015 Mar 19;519(7543):309-314. doi: 10.1038/nature14230. PMID: 25788095; PMCID: PMC4632200. https://pmc.ncbi.nlm.nih.gov/articles/PMC4632200/
Leslie, S., Winney, B., Hellenthal, G. et al. The fine-scale genetic structure of the British population. Nature 519, 309–314 (2015). https://doi.org/10.1038/nature14230, https://www.nature.com/articles/nature14230
[20] Leslie S, Winney B, Hellenthal G, Davison D, Boumertit A, Day T, Hutnik K, Royrvik EC, Cunliffe B; Wellcome Trust Case Control Consortium 2; International Multiple Sclerosis Genetics Consortium; Lawson DJ, Falush D, Freeman C, Pirinen M, Myers S, Robinson M, Donnelly P, Bodmer W. The fine-scale genetic structure of the British population. Nature. 2015 Mar 19;519(7543):309-314. doi: 10.1038/nature14230. PMID: 25788095; PMCID: PMC4632200. https://pmc.ncbi.nlm.nih.gov/articles/PMC4632200/
[21] Leslie S, Winney B, Hellenthal G, Davison D, Boumertit A, Day T, Hutnik K, Royrvik EC, Cunliffe B; Wellcome Trust Case Control Consortium 2; International Multiple Sclerosis Genetics Consortium; Lawson DJ, Falush D, Freeman C, Pirinen M, Myers S, Robinson M, Donnelly P, Bodmer W. The fine-scale genetic structure of the British population. Nature. 2015 Mar 19;519(7543):309-314. doi: 10.1038/nature14230. PMID: 25788095; PMCID: PMC4632200. https://pmc.ncbi.nlm.nih.gov/articles/PMC4632200/
Population Genetics, People of the British Isles, University of Oxford, https://peopleofthebritishisles.web.ox.ac.uk/population-genetics
[22] The World’s Largest Y-DNA Haplotree, 1 Aug 2026, FamilyTreeDNA Blog, https://blog.familytreedna.com/largest-y-dna-haplotree/
Y-DNA Haplogroup Project for SNP G-Z6748, FamilyTreeDNA, https://www.familytreedna.com/groups/g-z6748/about
[23] Estes, Roberta, STRs vs SNPs, Multiple DNA Personalities, DNAeXplained – Genetic Genealology, 10 Feb 2014, https://dna-explained.com/2014/02/10/strs-vs-snps-multiple-dna-personalities/
Making SNPs Make Sense, Learn Genetics, https://learn.genetics.utah.edu/content/precision/snips/
What are single nucleotide polymorphisms (SNPs)?, MedlinePlus, https://medlineplus.gov/genetics/understanding/genomicresearch/snp/
[24] Important nuance for the British Isles: Direct ancient-DNA sampling from British and Irish Neolithic contexts shows haplogroup I2a (particularly the M284/British-Irish-specific subclade) as numerically dominant among sequenced males, with G2a present as a genuine but minority lineage — e.g., the Hazleton North/broader English Neolithic megalithic dataset assembled from Reich-lab releases shows roughly 50 I-haplogroup individuals to 5 G-haplogroup individuals, and Cassidy’s Irish Neolithic dataset is likewise dominated by I2 with G2a-P303 appearing only as a “late arrival” lineage in her thesis analysis.
The G2a is best characterized in the secondary literature as one of the diagnostic paternal markers of the broader Anatolian-descended Neolithic farmer package (source population, LBK, Cardial/Iberian and Atlantic-facade sites), present in Britain/Ireland as a documented minority founder lineage alongside a locally more numerous I2a component — rather than the single dominant British Y-DNA haplogroup, which several general-audience genetics pages (e.g. Eupedia webpages, Wikipedia’s Haplogroup G-M201 article) can overstate if read out of context. [a]
The strongest evidence that Neolithic Britain’s population — and its farming economy — arrived via migration rather than local adoption comes from large-scale ancient genome studies:
Brace et al. (2019, Nature Ecology & Evolution), “Ancient genomes indicate population replacement in Early Neolithic Britain,” sequenced 6 Mesolithic and 67 Neolithic genomes from Britain and found “overwhelming support for agriculture being introduced to Britain by incoming continental farmers,” with the incoming population’s ancestry traced ultimately to Aegean/Anatolian farmers who reached Britain via the Iberian Atlantic route, essentially replacing the resident hunter-gatherer gene pool. [b]
Cassidy et al. (2016, PNAS) provided the first genome-wide ancient Irish data, showing that a Neolithic woman from Ballynahatty was genetically close to other European Neolithic farmers, with no Steppe ancestry, confirming the same continental-farmer-descended founding population reached Ireland. [c]
Carlin et al. (2025, Nature), sequencing dozens more Irish Neolithic passage-tomb individuals (including the Newgrange “dynastic elite” case), further mapped the genetic structure of this megalithic farming population, as reviewed in later syntheses of Irish Neolithic kinship. [d]
Fowler, Olalde et al. (2021/2022, Nature), the Hazleton North long-cairn study, reconstructed a five-generation patrilineal pedigree from 35 Early Neolithic individuals (c. 3700–3600 BC), directly documenting the social structure of one of these incoming farming communities about a century after farming reached Britain. [e]
Olalde et al. (2018, Nature), the Beaker-phenomenon study, situates these Neolithic farmer genomes (“Y haplogroups known to be common across Europe during the earlier Neolithic period, such as I and G2”) as the baseline population later swamped by Bell Beaker/Steppe-derived migrants around 2450 BCE. [f]
Independent of the DNA studies, zooarchaeology and organic residue analysis confirm that cattle, sheep/goats, and pigs appear abruptly in Britain with no local domestication precursor:
Rowley-Conwy et al., “The earliest farming in Britain: towards a new synthesis,” document that Early Neolithic faunal assemblages from around 4000 BCE are dominated by domestic cattle with no transitional wild/domestic mixture, and the analysis of mitochondrial DNA ruled out local domestication. [g]
Cummings & Morris (2018, Environmental Archaeology), “Neolithic Explanations Revisited: Modelling the Arrival and Spread of Domesticated Cattle into Neolithic Britain,” model how a small founder herd imported from continental Europe (probably the Paris/Rhine basins) could seed the whole island’s cattle population. [h]
Copley et al. / Evershed et al. (2003, PNAS), “Direct chemical evidence for widespread dairying in prehistoric Britain,” used lipid residue analysis on Early Neolithic pottery to show dairying of cattle, sheep, and goats was already an established practice when farming reached Britain in the late 5th millennium CE. [I]
A University of Southampton faunal review similarly concludes “there was no local domestication of cattle or pigs… both have now been shown to have been brought to Britain from continental Europe,” while sheep and goats (which have no wild British ancestor) must, by definition, have been introduced. [j]
G2a is well established in the archaeogenetic literature as one of the principal paternal lineages carried by the Anatolian-derived farmer expansion, though its representation specifically within Britain needs a careful caveat:
Mathieson et al. (2015, Nature) found 8 of 13 Early Neolithic males from Barcın in northwest Anatolia (c. 6500–6200 BC) belonged to G2a subclades, establishing it as a founder lineage at the source population for the whole European farming expansion (summarized at Eupedia, Wikipedia). [k]
Rivollat et al. (2020, Science Advances) and a 2024 Nature Communications follow-up analysis note G2a as “the most frequent Y-chromosome Neolithic haplogroup” across the continen. [l]
Along the Mediterranean/Atlantic route most relevant to Britain, G2a2 is documented in Early Neolithic Iberian farmers (Iberian biomolecular prehistory study, PNAS 2018, PMC) and in Normandy’s Fleury-sur-Orne Neolithic monument complex, where G2a2 was the dominant lineage in the earliest phase before 4000 cal BC — the same Atlantic-facing farming culture zone that fed into Britain and Ireland. [m]
Secondary syntheses (e.g. Eupedia’s review of British/Irish genetics) note that Atlantic Megalithic-culture Y-DNA samples tested to date (Britain, Ireland) include a substantial G2a component alongside haplogroup I2a, concluding that megalith builders were “predominantly G2a and I2a people“. [n]
[a] Estes , Roberta, DNA from 459 Ancient British Isles Burials Reveals Relationships – Does Yours Match?, 2 Feb 2022, DNAeXplained, https://dna-explained.com/2022/02/01/dna-from-459-ancient-british-isles-burials-reveals-relationships-does-yours-match/
Genetic continuity and change in prehistoric Ireland (Lara Cassidy Thesis), Eurogenetics Blog, May 22, 2020, https://eurogenes.blogspot.com/2020/05/genetic-continuity-and-change-in.html
Cassidy, Lara,, A Genomic Compendium of an Island: Documenting Continuity and Change across Irish Human Prehistory, Trinity College Dublin.School of Genetics & Microbiology. GENETICS, 2018, https://www.tara.tcd.ie/items/3bfbf18e-d1b8-4ad0-ab0c-f290576e4f83
[b] Brace S, Diekmann Y, Booth TJ, van Dorp L, Faltyskova Z, Rohland N, Mallick S, Olalde I, Ferry M, Michel M, Oppenheimer J, Broomandkhoshbacht N, Stewardson K, Martiniano R, Walsh S, Kayser M, Charlton S, Hellenthal G, Armit I, Schulting R, Craig OE, Sheridan A, Parker Pearson M, Stringer C, Reich D, Thomas MG, Barnes I. Ancient genomes indicate population replacement in Early Neolithic Britain. Nat Ecol Evol. 2019 May;3(5):765-771. doi: 10.1038/s41559-019-0871-9. Epub 2019 Apr 15. Erratum in: Nat Ecol Evol. 2019 Jun;3(6):986-987. doi: 10.1038/s41559-019-0912-4. PMID: 30988490; PMCID: PMC6520225. https://pmc.ncbi.nlm.nih.gov/articles/PMC6520225/
Caygill, Bex, Ancient DNA shows migrants introduced farming to Britain from Europe, 15 April 2019, UCL News, https://www.ucl.ac.uk/news/2019/apr/ancient-dna-shows-migrants-introduced-farming-britain-europe
[c] Cassidy LM, Martiniano R, Murphy EM, Teasdale MD, Mallory J, Hartwell B, Bradley DG. Neolithic and Bronze Age migration to Ireland and establishment of the insular Atlantic genome. Proc Natl Acad Sci U S A. 2016 Jan 12;113(2):368-73. doi: 10.1073/pnas.1518445113. Epub 2015 Dec 28. PMID: 26712024; PMCID: PMC4720318. https://pmc.ncbi.nlm.nih.gov/articles/PMC4720318/
[d] Carlin, Neil, Smyth, Jessica, Frieman, Catherine J. et al. (2025) Social and Genetic Relations in Neolithic Ireland: Re-evaluating Kinship. Cambridge Archaeological Journal. pp. 435-455. ISSN: 0959-7743, https://eprints.whiterose.ac.uk/id/eprint/225172/1/social-and-genetic-relations-in-neolithic-ireland-re-evaluating-kinship.pdf
[e] Chris Fowler, Iñigo Olalde, Vicki Cummings, Ian Armit, Lindsey Büster, Sarah Cuthbert, Nadin Rohland, Olivia Cheronet, Ron Pinhasi & David Reich, A high-resolution picture of kinship practices in an Early Neolithic tomb, 22 Dec 2021, Nature, https://reich.hms.harvard.edu/sites/reich.hms.harvard.edu/files/inline-files/FowlerOlalde_Hazleton_Nature_MainManuscript_2021_1.pdf
[f] Iñigo Olalde, Selina Brace, Morten E. Allentoft, Ian Armit, Kristian Kristiansen, et al, The Beaker phenomenon and the genomic transformation of northwest Europe, Nature, doi:10.1038/nature25738, https://reich.hms.harvard.edu/sites/reich.hms.harvard.edu/files/inline-files/nature25738_Olalde_0_1.pdf
Olalde, I., Brace, S., Allentoft, M. et al. The Beaker phenomenon and the genomic transformation of northwest Europe. Nature 555, 190–196 (2018). https://doi.org/10.1038/nature25738
[g] Rowley-Conwy, P., Gron, K.J., Bishop, R.R. et al. (2020) The earliest farming in Britain : towards a new synthesis. In: Gron, K.J., Sorensen, L. and Rowley-Conwy, P., (eds.) Farmers at the Frontier: A Pan European Perspective on Neolithisation. Oxbow Books, Oxford, UK, pp. 401-424. ISBN: 9781789251401. https://eprints.whiterose.ac.uk/id/eprint/157765/3/Rowley%20Conwy%20et%20al_Accepted_Earliest%20farming%20Britain%20ch%2019.pdf
[h] Vicki Cummings & James Morris (2018): Neolithic Explanations Revisited: Modelling the Arrival and Spread of Domesticated Cattle into Neolithic Britain, Environmental Archaeology, DOI: 10.1080/14614103.2018.1536498 https://doi.org/10.1080/14614103.2018.1536498
[I] M.S. Copley, R. Berstan, S.N. Dudd, G. Docherty, A.J. Mukherjee, V. Straker, S. Payne, & R.P. Evershed, Direct chemical evidence for widespread dairying in prehistoric Britai Proc. Natl. Acad. Sci. U.S.A. 100 (4) 1524-1529, https://doi.org/10.1073/pnas.0335955100 (2003)
[j] Serjeantson, Dale, Review of Animal Remains from the Neolithic and Early Bronze Age of Southern Britain (4000 BC – 1500 BC) Research Department Report Series no 29-2011, Eastney Portsmouth: Archaeological Science,English Heritage, 2011 https://eprints.soton.ac.uk/342334/1/2011_RDRS_29-2011_WEB_REPORT.pdf
[k] Hay, Maciamo, Haplogroup G2a, Jul 2023, Expedia, https://eupedia.com/europe/Haplogroup_G2a_Y-DNA.shtml
Haplogroup G-M201, Wikipedia, This page was last edited on 26 July 2026, https://en.wikipedia.org/wiki/Haplogroup_G-M201
Mathieson, I., Lazaridis, I., Rohland, N. et al. Genome-wide patterns of selection in 230 ancient Eurasians. Nature 528, 499–503 (2015). https://doi.org/10.1038/nature16152
[l] Rivollat M, Jeong C, Schiffels S, Küçükkalıpçı İ, Pemonge MH, Rohrlach AB, Alt KW, Binder D, Friederich S, Ghesquière E, Gronenborn D, Laporte L, Lefranc P, Meller H, Réveillas H, Rosenstock E, Rottier S, Scarre C, Soler L, Wahl J, Krause J, Deguilloux MF, Haak W. Ancient genome-wide DNA from France highlights the complexity of interactions between Mesolithic hunter-gatherers and Neolithic farmers. Sci Adv. 2020 May 29;6(22):eaaz5344. doi: 10.1126/sciadv.aaz5344. PMID: 32523989; PMCID: PMC7259947. https://pubmed.ncbi.nlm.nih.gov/32523989/ also https://www.science.org/doi/10.1126/sciadv.aaz5344
[m] M. Rivollat, A. Thomas, E. Ghesquière, A.B. Rohrlach, E. Späth, M. Pemonge, W. Haak, P. Chambon, & M. Deguilloux, Ancient DNA gives new insights into a Norman Neolithic monumental cemetery dedicated to male elites, Proc. Natl. Acad. Sci. U.S.A. 119 (18) e2120786119, https://doi.org/10.1073/pnas.2120786119 (2022).
Valdiosera C, Günther T, Vera-Rodríguez JC, Ureña I, Iriarte E, Rodríguez-Varela R, Simões LG, Martínez-Sánchez RM, Svensson EM, Malmström H, Rodríguez L, Bermúdez de Castro JM, Carbonell E, Alday A, Hernández Vera JA, Götherström A, Carretero JM, Arsuaga JL, Smith CI, Jakobsson M. Four millennia of Iberian biomolecular prehistory illustrate the impact of prehistoric migrations at the far end of Eurasia. Proc Natl Acad Sci U S A. 2018 Mar 27;115(13):3428-3433. doi: 10.1073/pnas.1717762115. Epub 2018 Mar 12. PMID: 29531053; PMCID: PMC5879675. https://pmc.ncbi.nlm.nih.gov/articles/PMC5879675/
[n] Hay, Maciamo, Genetic history of the British and the Irish, Oct 2016, Expedia, https://eupedia.com/genetics/britain_ireland_dna.shtml
[25] Y-DNA Haplogroup G (M201) is deeply intertwined with the Neolithic Revolution. As hunter-gatherers in the Near East and Caucasus transitioned to settled agriculture about 10,000 to 11,000 years ago, its major subclade—G2a—became the dominant paternal lineage of the early farming populations who expanded from Anatolia into Europe
Neolithic Revolution, Wikipedia, This page was last edited on 2 August 2026, https://en.wikipedia.org/wiki/Neolithic_Revolution
Burkhard Berger, Harald Niederstätter, Daniel Erhart, Christoph Gassner, Harald Schennach, Walther Parson, High resolution mapping of Y haplogroup G in Tyrol (Austria), Forensic Science International: Genetics, Volume 7, Issue 5, 2013, Pages 529-536, ISSN 1872-4973, https://doi.org/10.1016/j.fsigen.2013.05.013.
(https://www.sciencedirect.com/science/article/pii/S1872497313001361)
Rootsi S, Myres NM, Lin AA, Järve M, King RJ, Kutuev I, Cabrera VM, Khusnutdinova EK, Varendi K, Sahakyan H, Behar DM, Khusainova R, Balanovsky O, Balanovska E, Rudan P, Yepiskoposyan L, Bahmanimehr A, Farjadian S, Kushniarevich A, Herrera RJ, Grugni V, Battaglia V, Nici C, Crobu F, Karachanak S, Hooshiar Kashani B, Houshmand M, Sanati MH, Toncheva D, Lisa A, Semino O, Chiaroni J, Di Cristofaro J, Villems R, Kivisild T, Underhill PA. Distinguishing the co-ancestries of haplogroup G Y-chromosomes in the populations of Europe and the Caucasus. Eur J Hum Genet. 2012 Dec;20(12):1275-82. doi: 10.1038/ejhg.2012.86. Epub 2012 May 16. PMID: 22588667; PMCID: PMC3499744. https://pmc.ncbi.nlm.nih.gov/articles/PMC3499744/
Brace S, Diekmann Y, Booth TJ, van Dorp L, Faltyskova Z, Rohland N, Mallick S, Olalde I, Ferry M, Michel M, Oppenheimer J, Broomandkhoshbacht N, Stewardson K, Martiniano R, Walsh S, Kayser M, Charlton S, Hellenthal G, Armit I, Schulting R, Craig OE, Sheridan A, Parker Pearson M, Stringer C, Reich D, Thomas MG, Barnes I. Ancient genomes indicate population replacement in Early Neolithic Britain. Nat Ecol Evol. 2019 May;3(5):765-771. doi: 10.1038/s41559-019-0871-9. Epub 2019 Apr 15. Erratum in: Nat Ecol Evol. 2019 Jun;3(6):986-987. doi: 10.1038/s41559-019-0912-4. PMID: 30988490; PMCID: PMC6520225. https://pmc.ncbi.nlm.nih.gov/articles/PMC6520225/
[26] Iñigo Olalde, Selina Brace, Morten E. Allentoft, Ian Armit, Kristian Kristiansen, Thomas Booth, Nadin Rohland, Swapan Mallick, Anna Szécsényi-Nagy, et al, The Beaker phenomenon and the genomic transformation of northwest Europe, Nature 2018, https://reich.hms.harvard.edu/sites/reich.hms.harvard.edu/files/inline-files/nature25738_Olalde_0_1.pdf; Supplementary Material https://reich.hms.harvard.edu/sites/reich.hms.harvard.edu/files/inline-files/2019_Brace_NatureEcologyEvolution_Supplement.pdf
Brace, S., Diekmann, Y., Booth, T. J., van Dorp, L., Faltyskova, Z., Rohland, N., … & Barnes, I.Ancient genomes indicate population replacement in Early Neolithic Britain. Nature Ecology & Evolution, 3(5), 2019, 765-771, https://www.researchgate.net/publication/332430722_Ancient_genomes_indicate_population_replacement_in_Early_Neolithic_Britain
[27] Quote is from: Haplogroup G-M201, Wikipedia, This page was last edited on 26 July 2026, https://en.wikipedia.org/wiki/Haplogroup_G-M201
See also:
Athey, Thomas Whit, A Major Subclade of Haplogroup G2, Journal of Genetic Genealogy, 3(1):14-18, 2007, https://www.researchgate.net/publication/265072125_A_Major_Subclade_of_Haplogroup_G2
Goff PG, Athey TW (2006) Diagnostic Y-STR markers in Haplogroup G. Journal of Genetic Genealogy, 2:12-17, 2006, https://www.csueastbay.edu/museum/files/docs/exhibit/dna/dna-diagnostic-y-str.pdf
Origins, age, spread and ethnic association of European haplogroups and subclades, Expedia, https://www.muturzikin.com/documents/Origins,%20age,%20spread%20and%20ethnic%20association%20of%20European%20haplogroups%20and%20subclades.pdf
[28] See, for example:
Hay, Maciamo, Genetic history of the British and the Irish, October 2016., Expedia, https://www.eupedia.com/genetics/britain_ireland_dna.shtml#google_vignette
Hay, Maciamo, Haplogroup G2a (YDNA), Expedia, https://www.eupedia.com/europe/Haplogroup_G2a_Y-DNA.shtml
[29] Y-chromosome haplogroup previously known as G2a3b1 is now officially named G-P303 (or G2a2b2a under updated phylogenetic tree naming conventions)
Haplogroup G-P303, Wikipedia, This page was last edited on 26 January 2026, https://en.wikipedia.org/wiki/Haplogroup_G-P303
[30] Hay, Maciamo, Genetic history of the British and the Irish, October 2016., Expedia, https://www.eupedia.com/genetics/britain_ireland_dna.shtml#google_vignette
[31] Hay, Maciamo, Haplogroup G2a (YDNA), Expedia, https://www.eupedia.com/europe/Haplogroup_G2a_Y-DNA.shtml
[32] See the following:
Patterson, Nick, Michael Isakov, Thomas Booth, Lindsey Büster, Claire-Elise Fischer, Iñigo Olalde, Harald Ringbauer, et al. “Large-Scale Migration into Britain during the Middle to Late Bronze Age.” Nature 601, no. 7894 (2022): 588–594. Published online December 22, 2021. https://doi.org/10.1038/s41586-021-04287-4.
- The paper has 223 authors (large-consortium ancient-DNA study); Nick Patterson is first author, David Reich is last/senior author.
- This is the paper reporting that R1b-P312/L21 was present at 89±5% in Chalcolithic/Early Bronze Age Britain versus ~0% in the preceding Neolithic, and tracking the subsequent EEF-ancestry increase into the Iron Age.
Dulias, Katharina, M. George B. Foody, Pierre Justeau, Marina Silva, Rui Martiniano, Gonzalo Oteo-García, Alessandro Fichera, et al. “Ancient DNA at the Edge of the World: Continental Immigration and the Persistence of Neolithic Male Lineages in Bronze Age Orkney.” Proceedings of the National Academy of Sciences 119, no. 8 (2022): e2108001119. Published February 7, 2022. https://doi.org/10.1073/pnas.2108001119.
- Full author list includes the Scottish Genomes Partnership as a collective author; James F. Wilson and Martin B. Richards are among the senior authors.
- This is the paper reporting that all 14 well-resolved Neolithic Orkney Y-DNA samples belong to haplogroup I2a (mostly I2a1b-M423 and I2a1b1-S185), which is the direct evidence.
[33] Hirschman, Elizabeth, How Did So Much Middle Eastern Dna Get To Wales? Examining Three Possible Sources: Carthaginians, Romans, English Jews, IOSR Journal of Humanities And Social Science (IOSR-JHSS), Volume 26, Issue 7, Series 8 (July. 2021) 45-63, e-ISSN: 2279-0837, p-ISSN, 2279-0845, https://www.iosrjournals.org/iosr-jhss/papers/Vol.26-Issue7/Series-8/G2607084563.pdf
[34] Hirschman, Elizabeth, How Did So Much Middle Eastern Dna Get To Wales? Examining Three Possible Sources: Carthaginians, Romans, English Jews, IOSR Journal of Humanities And Social Science (IOSR-JHSS), Volume 26, Issue 7, Series 8 (July. 2021) 45-63, e-ISSN: 2279-0837, p-ISSN, 2279-0845, https://www.iosrjournals.org/iosr-jhss/papers/Vol.26-Issue7/Series-8/G2607084563.pdf
[35] The article’s evidentiary base is weaker than its confident framing suggests. Its methodology consists largely of matching individual FamilyTreeDNA project entries to comparative samples one at a time, a case-by-case approach vulnerable to selection bias and coincidental matches rather than systematic population-level analysis. The surname and hagionymic arguments are speculative and not corroborated by onomastic scholarship. The venue itself is a journal outside the fields of population genetics or Celtic history, and the piece does not appear to have been reviewed by geneticists or historians with domain expertise.
Hirschman, Elizabeth, How Did So Much Middle Eastern Dna Get To Wales? Examining Three Possible Sources: Carthaginians, Romans, English Jews
[36] Christiana L Scheib, Ruoyun Hui, Alice K Rose, Eugenia D’Atanasio, Sarah A Inskip, Jenna Dittmar, Craig Cessford, Samuel J Griffith, Anu Solnik, Rob Wiseman, Benjamin Neil, Trish Biers, Sarah-Jane Harknett, Stefania Sasso, Simone A Biagini, Göran Runfeldt, Corinne Duhig, Christopher Evans, Mait Metspalu, Martin J Millett, Tamsin C O’Connell, John E Robb, Toomas Kivisild, Low Genetic Impact of the Roman Occupation of Britain in Rural Communities, Molecular Biology and Evolution, Volume 41, Issue 9, September 2024, msae168, https://doi.org/10.1093/molbev/msae168
Patterson N, Isakov M, Booth T, Büster L, Fischer CE, Olalde I, Ringbauer H, Akbari A, Cheronet O, Bleasdale M, Adamski N, Altena E, Bernardos R, Brace S, Broomandkhoshbacht N, Callan K, Candilio F, Culleton B, Curtis E, Demetz L, Carlson KSD, Edwards CJ, Fernandes DM, Foody MGB, Freilich S, Goodchild H, Kearns A, Lawson AM, Lazaridis I, Mah M, Mallick S, Mandl K, Micco A, Michel M, Morante GB, Oppenheimer J, Özdoğan KT, Qiu L, Schattke C, Stewardson K, Workman JN, Zalzala F, Zhang Z, Agustí B, Allen T, Almássy K, Amkreutz L, Ash A, Baillif-Ducros C, Barclay A, Bartosiewicz L, Baxter K, Bernert Z, Blažek J, Bodružić M, Boissinot P, Bonsall C, Bradley P, Brittain M, Brookes A, Brown F, Brown L, Brunning R, Budd C, Burmaz J, Canet S, Carnicero-Cáceres S, Čaušević-Bully M, Chamberlain A, Chauvin S, Clough S, Čondić N, Coppa A, Craig O, Črešnar M, Cummings V, Czifra S, Danielisová A, Daniels R, Davies A, de Jersey P, Deacon J, Deminger C, Ditchfield PW, Dizdar M, Dobeš M, Dobisíková M, Domboróczki L, Drinkall G, Đukić A, Ernée M, Evans C, Evans J, Fernández-Götz M, Filipović S, Fitzpatrick A, Fokkens H, Fowler C, Fox A, Gallina Z, Gamble M, González Morales MR, González-Rabanal B, Green A, Gyenesei K, Habermehl D, Hajdu T, Hamilton D, Harris J, Hayden C, Hendriks J, Hernu B, Hey G, Horňák M, Ilon G, Istvánovits E, Jones AM, Kavur MB, Kazek K, Kenyon RA, Khreisheh A, Kiss V, Kleijne J, Knight M, Kootker LM, Kovács PF, Kozubová A, Kulcsár G, Kulcsár V, Le Pennec C, Legge M, Leivers M, Loe L, López-Costas O, Lord T, Los D, Lyall J, Marín-Arroyo AB, Mason P, Matošević D, Maxted A, McIntyre L, McKinley J, McSweeney K, Meijlink B, Mende BG, Menđušić M, Metlička M, Meyer S, Mihovilić K, Milasinovic L, Minnitt S, Moore J, Morley G, Mullan G, Musilová M, Neil B, Nicholls R, Novak M, Pala M, Papworth M, Paresys C, Patten R, Perkić D, Pesti K, Petit A, Petriščáková K, Pichon C, Pickard C, Pilling Z, Price TD, Radović S, Redfern R, Resutík B, Rhodes DT, Richards MB, Roberts A, Roefstra J, Sankot P, Šefčáková A, Sheridan A, Skae S, Šmolíková M, Somogyi K, Somogyvári Á, Stephens M, Szabó G, Szécsényi-Nagy A, Szeniczey T, Tabor J, Tankó K, Maria CT, Terry R, Teržan B, Teschler-Nicola M, Torres-Martínez JF, Trapp J, Turle R, Ujvári F, van der Heiden M, Veleminsky P, Veselka B, Vytlačil Z, Waddington C, Ware P, Wilkinson P, Wilson L, Wiseman R, Young E, Zaninović J, Žitňan A, Lalueza-Fox C, de Knijff P, Barnes I, Halkon P, Thomas MG, Kennett DJ, Cunliffe B, Lillie M, Rohland N, Pinhasi R, Armit I, Reich D. Large-scale migration into Britain during the Middle to Late Bronze Age. Nature. 2022 Jan;601(7894):588-594. doi: 10.1038/s41586-021-04287-4. Epub 2021 Dec 22. PMID: 34937049; PMCID: PMC8889665. https://pmc.ncbi.nlm.nih.gov/articles/PMC8889665/
[37] Martiniano, R., Caffell, A., Holst, M. et al. Genomic signals of migration and continuity in Britain before the Anglo-Saxons. Nat Commun 7, 10326 (2016). https://doi.org/10.1038/ncomms10326
[38] See: Jim Griffis, Migrating to East Anglia, 31 mar 2026, Griffis Family: Selected Stories from the Past, https://griffis.org/migrating-to-east-anglia/
[39] Michael E. Weale, Deborah A. Weiss, Rolf F. Jager, Neil Bradman, Mark G. Thomas, Y Chromosome Evidence for Anglo-Saxon Mass Migration, Molecular Biology and Evolution, Volume 19, Issue 7, July 2002, Pages 1008–1021, https://doi.org/10.1093/oxfordjournals.molbev.a004160
[40] Capelli C, Redhead N, Abernethy JK, Gratrix F, Wilson JF, Moen T, Hervig T, Richards M, Stumpf MP, Underhill PA, Bradshaw P, Shaha A, Thomas MG, Bradman N, Goldstein DB. A Y chromosome census of the British Isles. Curr Biol. 2003 May 27;13(11):979-84. doi: 10.1016/s0960-9822(03)00373-7. PMID: 12781138. https://pubmed.ncbi.nlm.nih.gov/12781138/
[41] Thomas MG, Stumpf MP, Härke H. Evidence for an apartheid-like social structure in early Anglo-Saxon England. Proc Biol Sci. 2006 Oct 22;273(1601):2651-7. doi: 10.1098/rspb.2006.3627. PMID: 17002951; PMCID: PMC1635457. https://pmc.ncbi.nlm.nih.gov/articles/PMC1635457/
[42] Martiniano, R., Caffell, A., Holst, M. et al. Genomic signals of migration and continuity in Britain before the Anglo-Saxons. Nat Commun 7, 10326 (2016). https://doi.org/10.1038/ncomms10326
Leslie, S., Winney, B., Hellenthal, G. et al. The fine-scale genetic structure of the British population. Nature 519, 309–314, 2015, https://pmc.ncbi.nlm.nih.gov/articles/PMC4632200/
[43] Howells, Caleb, What Do Genetic Studies Reveal About the Anglo-Saxon Migration?, 8 Oct 2025, The Collector, https://www.thecollector.com/genetic-studies-anglo-saxon-migration/
Gretzinger, J., Sayer, D., Justeau, P. et al. The Anglo-Saxon migration and the formation of the early English gene pool. Nature 610, 112–119 (2022). https://doi.org/10.1038/s41586-022-05247-2
Gretzinger J, Sayer D, Justeau P, Altena E, Pala M, Dulias K, Edwards CJ, Jodoin S, Lacher L, Sabin S, Vågene ÅJ, Haak W, Ebenesersdóttir SS, Moore KHS, Radzeviciute R, Schmidt K, Brace S, Bager MA, Patterson N, Papac L, Broomandkhoshbacht N, Callan K, Harney É, Iliev L, Lawson AM, Michel M, Stewardson K, Zalzala F, Rohland N, Kappelhoff-Beckmann S, Both F, Winger D, Neumann D, Saalow L, Krabath S, Beckett S, Van Twest M, Faulkner N, Read C, Barton T, Caruth J, Hines J, Krause-Kyora B, Warnke U, Schuenemann VJ, Barnes I, Dahlström H, Clausen JJ, Richardson A, Popescu E, Dodwell N, Ladd S, Phillips T, Mortimer R, Sayer F, Swales D, Stewart A, Powlesland D, Kenyon R, Ladle L, Peek C, Grefen-Peters S, Ponce P, Daniels R, Spall C, Woolcock J, Jones AM, Roberts AV, Symmons R, Rawden AC, Cooper A, Bos KI, Booth T, Schroeder H, Thomas MG, Helgason A, Richards MB, Reich D, Krause J, Schiffels S. The Anglo-Saxon migration and the formation of the early English gene pool. Nature. 2022 Oct;610(7930):112-119. doi: 10.1038/s41586-022-05247-2. Epub 2022 Sep 21. Erratum in: Nature. 2022 Nov;611(7934):E3. doi: 10.1038/s41586-022-05429-y. PMID: 36131019; PMCID: PMC9534755. https://pmc.ncbi.nlm.nih.gov/articles/PMC9534755/
[44] Genetic history of the British Isles, Wikipedia, This page was last edited on 16 August 2026, https://en.wikipedia.org/wiki/Genetic_history_of_the_British_Isles
The Anglo-Saxon migration and the formation of the early English gene pool, https://knowledge.lancashire.ac.uk/id/eprint/44034/
[45] The landmark 2020 Nature study, “Population genomics of the Viking world”, was the culmination of a major six-year international research project led primarily by geneticist Eske Willerslev at the University of Copenhagenand the University of Cambridge. The effort brought together dozens of institutions worldwide to sequence the genomes of 442 humans from archaeological sites spanning across Europe and Greenland. It united a vast interdisciplinary network of geneticists, archaeologists, and anthropologists from institutions across Scandinavia, the UK (such as the University of Bristol and UHI), Europe, and Russia.
Margaryan, A., Lawson, D.J., Sikora, M. et al. Population genomics of the Viking world.Nature 585, 390–396 (2020). https://doi.org/10.1038/s41586-020-2688-8
Quiles, Carlos, Vikings, Vikings, Vikings! “eastern” ancestry in the whole Baltic Iron Age, 20 Jul 2019, Indo-European.eu: Languages, Cultures & Peoples, https://indo-european.eu/2019/07/vikings-vikings-vikings-influx-of-eastern-ancestry-in-the-whole-baltic-iron-age/
World’s largest DNA sequencing of Viking skeletons reveals they weren’t all Scandinavian, 16 Sep 2020, Science Daily, https://www.sciencedaily.com/releases/2020/09/200916113544.htm
UHI academics contribute to international Viking DNA research project, 30 Sep 2020, UHI Archaeology Institute, https://archaeologyorkney.com/2020/09/30/uhi-academics-contribute-to-international-viking-dna-research-project/
Lind, Mie, Population genomics of the Viking world, 23 Sep 2020, UrbNeet, Aarhus University, https://urbnet.au.dk/news/nyhed/artikel/population-genomics-of-the-viking-world
[46] Estes, Roberta, 442 Ancient Viking Skeletons Hold DNA Surprises – Does Your Y or Mitochondrial DNA Match? Daily Updates Here!, 18 Sep 2020, DNAeXplained – Genetic Genealogy, https://dna-explained.com/2020/09/18/442-ancient-viking-skeletons-hold-dna-surprises-does-your-y-or-mitochondrial-dna-match-daily-updates-here/
E.K. Khusnutdinova, N.V. Ekomasova, M.A. Dzhaubermezov, L.R. Gabidullina, Z.R. Sufianova, I.M. Khidiyatova, A.V. Kazantseva, S.S. Litvinov , A.Kh. Nurgalieva1, D.S. Prokofieva, Distribution of Haplogroup G-15 of the Y-Chromosome Among Representatives of Ancient Cultures and Modern Populations of Northern Eurasia, Opera Med Physiol. 2023. Vol. 10 (4), 57 – 72, doi: 10.24412/2500-2295-2023-4-57-72, https://operamedphys.org/system/tdf/pdf/06_DISTRIBUTION%20OF%20HAPLOGROUP%20G-P15_0.pdf?file=1&type=node&id=555&force=0
[47] Viking & Invader YDNA, About Us, FamilyTreeDNA, https://www.familytreedna.com/groups/vikingydna/about/results
[48] Toponymic influence refers to the power of place names (toponyms) to shape language, cultural identity, political power, and historical memory within a geographic space. Naming a place acts as an expression of authority, reflecting who controls the land and whose history is prioritized or erased.
Toponymy, Wikipedia, This page was last edited on 11 July 2026, https://en.wikipedia.org/wiki/Toponymy
Gartner, Georg, Map It, Name It: The Power of Place Names in Maps, Summer 2025, ArcNews, https://www.esri.com/about/newsroom/arcnews/map-it-name-it-the-power-of-place-na, mes-in-maps
C. Hough, Place Names, Encyclopedia of Language & Linguistics (Second Edition), Elsevier,
2006, Pages 613-620, ISBN 9780080448541,
https://doi.org/10.1016/B0-08-044854-2/00441-7.
(https://www.sciencedirect.com/science/article/pii/B0080448542004417)
[49] Scholarly treatments include:
- A comparative VSNR study, “The Vikings in Brittany,” which draws direct parallels between Welsh and Breton patterns of raiding and resistance. [a]
- Wendy Davies, “Vikings” (chapter in Wales in the Early Middle Ages, Oxford, 1990) — a foundational academic analysis of Viking raids beginning mid-9th century and the question of Scandinavian political presence in Wales.academic.oup [b]
- H.R. Loyn’s work (cited repeatedly as the standard framework), which proposes three distinct phases of Viking activity in Wales, each with a different character of interaction. [c]
- Nancy Edwards, Life in Early Medieval Wales (Oxford University Press, 2023), chapter “Power and Authority” — covers the archaeological and political dimensions of Norse impact on Wales, including the Anglesey settlement focus and Dublin-Chester trade routes. [d]
- T.M. Charles-Edwards, Wales and the Britons, 350–1064* — a major synthesis situating Viking incursions within broader Welsh political history. [e]
- Colmán Etchingham’s reinterpretation of Wales within an “insular Viking zone” spanning Scotland, the Isles, and Scandinavia, discussed in relation to 11th-century Anglo-Welsh-Norse relations.cambridge [f]
- Mark Redknap, “Limits of Viking influence in Wales,” British Archaeology, Issue 40 (1998) — the standard archaeological survey, covering excavations at Llanbedrgoch on Anglesey and the broader material record of raids, burials, and hoards. [g]
- Katherine Cross, Enemy and Ancestor: Viking Identities and Ethnic Boundaries in England and Normandy, c.950– c.1015 . Katherine Cross’s UCL doctoral thesis, Enemy and Ancestor: Viking Identities and Ethnic Boundaries in England and Normandy, c.950–c.1015, is presented as the first study to systematically compare ethnicity in Viking Age England and Normandy across genealogies, histories, hagiographies, charters, and law codes. Its central theoretical anchor is Fredrik Barth’s model of ethnicity as a socially constructed boundary rather than a fixed set of cultural traits — meaning the thesis deliberately separates “ethnic identity” from cultural markers like names, dress, art, and language. [h]
Archaeological Studies:
- Ongoing excavation research at Llanbedrgoch, Anglesey, conducted by Amgueddfa Cymru (National Museum Wales), which has substantially reshaped understanding of Viking-Age life on the island. [i]
- “Viking Connections: Proceedings of the Nineteenth Viking Congress” (Liverpool University Press, 2026), edited by Clare Downham, Fiona Edmonds, Nancy Edwards, and David Griffiths — this very recent volume includes several Wales-specific chapters, notably Ben Guy’s “Poetry and Taxes: Welsh responses to Viking attacks in the late tenth century,” John Hines’s “Exploitation of the unfree: the impact of the Viking Age on Welsh society and economy,” and Mark Redknap’s “Vikings, Places, Silver and Contexts: a Welsh perspective”. [j]
Genetic (Y-DNA) Studies:
- Capelli et al., “A Y Chromosome Census of the British Isles,” Current Biology 13(11), 2003 — the landmark study comparing 1,772 Y chromosomes across 25 British Isles locations against Norwegian, Danish, and German reference populations; found comparatively low Scandinavian genetic signal in Wales relative to Orkney and eastern England. [k]
- Weale et al. (2002), referenced widely in follow-up literature, found Central England Y-chromosome patterns resembling Frisian samples but distinctly different from North Wales — used to argue for minimal Anglo-Saxon/Norse paternal migration into North Wales specifically. [l]
- Lall, Larmuseau, Wetton et al., “Subdividing Y-chromosome haplogroup R1a1 reveals Norse Viking dispersal lineages in Britain,” European Journal of Human Genetics 29, 2021 — a more granular follow-up using Y-SNP subclades of R1a1 as a Viking marker across 10,338 male samples including Wales, comparing R1a1-GML8 and R1a1-GML9 frequencies against Norway. [m]
- Bryan Sykes, Saxons, Vikings, and Celts: The Genetic Roots of Britain and Ireland* — includes discussion of a hypothesized Norse settlement signal in parts of Pembrokeshire, though Sykes notes this lacks strong archaeological or toponymic corroboration. [n]
Doctoral Dissertation:
Oliver Egan’s dissertation, “Why was Wales relatively unaffected by the Viking expansion in the British Isles?” (Open University, A329 module, May 2021), opens by noting that despite raiding, colonizing, and controlling large parts of Europe and the North Atlantic — including Dublin, the Isle of Man, Shetland, Orkney, and the Danelaw — the Welsh kingdoms came through the Viking Age comparatively unscathed. He cites H. R. Loyn noting “no dramatic crisis [or] confrontation” in the primary Welsh records, minimal impact on Welsh language and political structures, and a lack of Viking-founded urban centers. He also points to genetic data from the Leslie, Winney & Hellenthal 2015 Nature study showing a distinct lack of Norse, Swedish, and Danish DNA in Wales relative to the rest of the British Isles — reinforcing Wales’s status as a genuine anomaly [o]
The dissertation organizes its inquiry around three questions: the impact of Wales’s fragmented political structure, whether Wales was a good raiding target, and whether Wales was a good settlement target — since raiding and settlement were the two primary mechanisms of Viking influence elsewhere.
Egan’s bottom line: Wales was relatively unaffected because it was a poor target for both of the two mechanisms that defined Viking impact elsewhere. Its exclusion from the earliest Viking network delayed contact; effective, repeated Welsh military resistance in the first phase set the “Viking timetable” back roughly a century. Its geography made it agriculturally unattractive; and its potential strategic value (trade, raiding-base functions) was already redundantly supplied by earlier, better-positioned settlements in Dublin, the Hebrides, the Isle of Man, and the Danelaw. He qualifies this, though: Viking influence was not entirely absent, and the third phase — mercenary service, ransom, and alliance politics feeding into Gruffydd ap Llywelyn’s unification of Wales in 1055 — may represent the period of deepest, if least visible, Viking impact, working through political integration rather than conquest or settlement.
Sources for footnote 49:
[a] Davies, Wendy, ‘Vikings’, Patterns of Power in Early Wales (Oxford, 1990; online edn, Oxford Academic, 3 Oct. 2011), https://doi.org/10.1093/acprof:oso/9780198201533.003.0004
[b] Egan, Oliver, Why was Wales relatively unaffected by the Viking expansion in the British Isles?,May 2021, Submitted for A329 ‘The making of Welsh history’, https://oro.open.ac.uk/78807/3/EGAN_A329_RVOR.pdf
[c] This short pamphlet is widely described as “a classic account of Viking activity and impact” and it introduces the three-phase framework for Viking activity in Wales that subsequent scholarship builds on.
Phase 1 (~850–914): A “backwash” of Viking aggression, as raids on Wales stemmed from Viking activity centered elsewhere — notably their establishment in Ireland (830s) and the Hebrides/Sudreys (850s) — rather than direct targeted conquest.
Phase 2 (~950 onward): Characterized by the “exporting of violence” from established Viking settlements around the Irish Sea, with raids increasingly targeting coastal lowland areas of Wales directly (Open University research paper; World History Encyclopedia).
Phase 3 (11th century): A later period marked by increased Viking presence in the Severn Estuary/Bristol Channel, including figures like Count Eilaf (a Dane in Cnut’s service) raiding Glamorgan, alongside a shift toward Vikings serving Welsh kings as mercenaries rather than raiders (World History Encyclopedia; War History).
Loyn, Henry, The Viking in Wales, The Dorothea Coke Memorial Lecture
in Northern Studies delivered at University College London 2 March 1976, London, University College, 1976, http://vsnrweb-publications.org.uk/Vikings%20in%20Wales.pdf
See also:
H. R. Loyn, Wikipedia, This page was last edited on 27 June 2026, https://en.wikipedia.org/wiki/H._R._Loyn
The Vikings in Ireland 795 – 1014, Part III, 29 Mar 2020, War History, https://warhistory.org/article/the-vikings-in-ireland-795-1014-part-iii
Toth, Mike, Vikings in Wales, 20 April 2023, World History Encyclopedia, https://www.worldhistory.org/article/2222/vikings-in-wales
[d] Edwards, Nancy, ‘Power and Authority’, Life in Early Medieval Wales (Oxford, 2023; online edn, Oxford Academic, 24 Aug. 2023), https://doi.org/10.1093/oso/9780198733218.003.0012
[e] Charles-Edwards, T. M., ‘The Britons and the Empire of Britain’, Wales and the Britons, 350-1064(Oxford, 2012; online edn, Oxford Academic, 24 Jan. 2013), https://doi.org/10.1093/acprof:oso/9780198217312.003.0017
[f]Thomas R. The View from Wales: Anglo-Welsh Relations in the Time of England’s Conquests. In: Ashe L, Ward EJ, eds. Conquests in Eleventh-Century England: 1016, 1066. Boydell & Brewer; 2020:287-306. https://www.cambridge.org/core/books/abs/conquests-in-eleventhcentury-england-1016-1066/view-from-wales-anglowelsh-relations-in-the-time-of-englands-conquests/BF6DD74A0B4F23BF961CA7B7F302372A
[g] Redknap, Mark, Limits of Viking influence in Wales from British Archaeology, Issue 40 (1998) online in Medievalist, https://www.medievalists.net/2013/03/limits-of-viking-influence-in-wales/
[h] Katherine Cross, Enemy and Ancestor: Viking Identities and Ethnic Boundaries in England and Normandy, c.950– c.1015 https://discovery.ucl.ac.uk/id/eprint/1417574/1/Cross%20phd%20thesis%20final.pdf
[i] When the Vikings invaded North Wales, 2 April 2007, Argueddfa Cymru Blog, https://museum.wales/blog/1019/When-the-Vikings-invaded-North-Wales
[j] Griffiths, David, et al., editors. Viking Connections: Proceedings of the Nineteenth Viking Congress. Liverpool University Press, 2026. JSTOR, https://doi.org/10.2307/jj.34207007.
Guy, Ben. “Poetry and Taxes: Welsh Responses to Viking Attacks in the Late 10th Century.” Viking Connections: Proceedings of the Nineteenth Viking Congress, edited by David Griffiths et al., Liverpool University Press, 2026, pp. 14–25. JSTOR, https://doi.org/10.2307/jj.34207007.8.
Hines, John. “Exploitation of the Unfree: The Impact of the Viking Age on Welsh Society and Economy.” Viking Connections: Proceedings of the Nineteenth Viking Congress, edited by DAVID GRIFFITHS et al., Liverpool University Press, 2026, pp. 26–36. JSTOR, https://doi.org/10.2307/jj.34207007.9.
Redknap, Mark. “Vikings, Places, Silver and Contexts: A Welsh Perspective.” Viking Connections: Proceedings of the Nineteenth Viking Congress, edited by DAVID GRIFFITHS et al., Liverpool University Press, 2026, pp. 37–54. JSTOR, https://doi.org/10.2307/jj.34207007.10
[k] Capelli C, Redhead N, Abernethy JK, Gratrix F, Wilson JF, Moen T, Hervig T, Richards M, Stumpf MP, Underhill PA, Bradshaw P, Shaha A, Thomas MG, Bradman N, Goldstein DB. A Y chromosome census of the British Isles. Curr Biol. 2003 May 27;13(11):979-84. doi: 10.1016/s0960-9822(03)00373-7. PMID: 12781138. https://pubmed.ncbi.nlm.nih.gov/12781138
[l]Thomas MG, Stumpf MP, Härke H. Evidence for an apartheid-like social structure in early Anglo-Saxon England. Proc Biol Sci. 2006 Oct 22;273(1601):2651-7. doi: 10.1098/rspb.2006.3627. PMID: 17002951; PMCID: PMC1635457. https://pmc.ncbi.nlm.nih.gov/articles/PMC1635457
[m] Lall, G.M., Larmuseau, M.H.D., Wetton, J.H. et al. Subdividing Y-chromosome haplogroup R1a1 reveals Norse Viking dispersal lineages in Britain. Eur J Hum Genet 29, 512–523 (2021). https://doi.org/10.1038/s41431-020-00747-z
[n] Sykes, Bryan. Saxons, Vikings, and Celts: The Genetic Roots of Britain and Ireland. W. W. Norton & Company, 2006. https://www.goodreads.com/book/show/6987.Saxons_Vikings_and_Celts
[o] Egan, Oliver, Why was Wales relatively unaffected by the Viking expansion in the British Isles?, Submitted for A329 ‘The making of Welsh history’May 2021, https://oro.open.ac.uk/78807/3/EGAN_A329_RVOR.pdf
[50] Gretzinger, J., Sayer, D., Justeau, P. et al. The Anglo-Saxon migration and the formation of the early English gene pool. Nature 610, 112–119 (2022). https://doi.org/10.1038/s41586-022-05247-2
[51] King TE, Jobling MA. What’s in a name? Y chromosomes, surnames and the genetic genealogy revolution. Trends Genet. 2009 Aug;25(8):351-60. doi: 10.1016/j.tig.2009.06.003. Epub 2009 Aug 7. PMID: 19665817. https://pubmed.ncbi.nlm.nih.gov/19665817/
[52] Welcome Trust, Y Chromosome And Surname Study Challenges Infidelity ‘Myth’, February 11, 2009, Science Daily, https://www.sciencedaily.com/releases/2009/02/090211111002.htm
The Historical Genetics of the Cotentin Peninsula, University of Leicester, https://le.ac.uk/history/research/current-research-grants/previous-research-grants-and-projects/the-impact-of-diasporas-on-the-making-of-britain/related-projects/the-historical-genetics-of-the-cotentin-peninsula
Surugue, Léa, Did the Normans descend from the Vikings? What genetics tell us about Viking legacy, 16 May 2016, International Business Times, https://www.ibtimes.co.uk/did-normans-descend-vikings-what-genetics-tell-us-about-viking-legacy-1560298
[53] Creuly, Philippe, Patrilineal origins (Y DNA) of Norman conquerors settled on the British islands after 1066 : Validity of lines of research, 26 Jul 2017, https://www.academia.edu/34041595/Patrilineal_origins_Y_DNA_of_Norman_conquerors_settled_on_the_British_islands_after_1066_Validity_of_lines_of_research
[54] De Angelis F, Nelson EA, Leggett S, Kassadjikova K, Pelayo TR, Poulton R, Rae TC, Fehren-Schmitz L, Betti L, Amorim CEG. The Genomic Legacy of the Norman Conquest in Rural England. bioRxiv [Preprint]. 2026 Apr 10:2026.04.10.716983. doi: 10.64898/2026.04.10.716983. PMID: 41993455; PMCID: PMC13081982. https://pmc.ncbi.nlm.nih.gov/articles/PMC13081982/
[55] Simms, Chris, Huge study of ancient British DNA reveals only minor Roman influence 11 May 2026, New Scientist, https://www.newscientist.com/article/2525923-huge-study-of-ancient-british-dna-reveals-only-minor-roman-influence/
Science Notes: Using isotopes to reveal patterns in early medieval migration, 31 Jan 2026, The Past, Current Archaeology Issue 432, https://the-past.com/news/science-notes-using-isotopes-to-reveal-patterns-in-early-medieval-migration/
[56] Davies, John, A history of Wales, London, New York : Penguin Books, https://archive.org/details/historyofwales0000davi_g1b0/page/n5/mode/2up
Welsh Marches, Wikipeida, This page was last edited on 30 June 2026, https://en.wikipedia.org/wiki/Welsh_Marches
Owen Lewis,‘A Species of Heathen?’ A Social History of English Migrants in Wales, c.1850-1914, Page 19 -20, PhD Thesis, Aberystwyth University, 30 Sep 2018, https://pure.aber.ac.uk/ws/portalfiles/portal/30022093/Owen_Lewis.pdf
Brady, Lindy, Writing the Welsh Borderlands in Anglo-Saxon England, Manchester University Press, 2017, https://books.google.com/books/about/Writing_the_Welsh_Borderlands_in_Anglo_S.html?id=FyzWyAEACAAJ
[57] Flemish settlement in Pembrokeshire, Wikipedia, This page was last edited on 16 November 2025, https://en.wikipedia.org/wiki/Flemish_settlement_in_Pembrokeshire
Felton, Richard, A historical tour through Pembrokeshire, Printed for Longman, Hurst, Rees, Orme & Co., etc., 1811, page 202, https://archive.org/details/b22013179/page/n7/mode/2up
Oksanen E. Flemish immigration to England. In: Flanders and the Anglo-Norman World, 1066–1216. Cambridge Studies in Medieval Life and Thought: Fourth Series. Cambridge University Press; 2012: 178-218. https://www.cambridge.org/core/books/abs/flanders-and-the-anglonorman-world-10661216/flemishimmigrationto-england/444C6837C810B3F451D89E14A336709C
Davies, Rees, Wales: A Culture Preserved, 17 Feb 2011, BBC, https://www.bbc.co.uk/history/british/middle_ages/culture_preserved_01.shtml
Trudgill P. And Further West: Across the Irish Sea, 800–1200. In: The Long Journey of English: A Geographical History of the Language. Cambridge University Press; 2023:66-75. https://www.cambridge.org/core/books/abs/long-journey-of-english/and-further-west-across-the-irish-sea-8001200/B451D55AF5B93E9FE5B39F0265C3B9AB
Laws, Edward, The history of Little England beyond Wales and the non-Kymric colony settled in Pembrokeshire, London : George Bell, 1888, Chapter IX, https://archive.org/details/b21781023/page/106/mode/2up
Owen, George, The description of Penbrokshire, edited, with notes and an appendix, by Henry Owen Volume One, London: Printed for Henry Owen, 1892, https://babel.hathitrust.org/cgi/pt?id=oxu1.606608575&seq=6
[58] Pembrokeshire, the Association of British Counties, https://abcounties.com/counties/county-profiles/pembrokeshire/
Flemish settlement in Pembrokeshire, Wikipedia, This page was last edited on 16 November 2025, https://en.wikipedia.org/wiki/Flemish_settlement_in_Pembrokeshire
[59] Flanders-Flemish DNA, About Us, FamilyTreeDNA, https://www.familytreedna.com/groups/flanders/about/results
Mertens, G., Jehaes, E., Leijnen, G., Rand, S., Jacobs, W. and Van Marck, E. (2007), Twelve-Locus Y-STR Haplotypes in the Flemish Population. Journal of Forensic Sciences, 52: 755-757. https://doi.org/10.1111/j.1556-4029.2007.00445.x
[60] Flanders & Flemish DNA Project – Y-DNA Results Overview, Accessed 1 Aug 2026, https://www.familytreedna.com/public/Flanders?iframe=ydna-results-overview
[61] Offa’s Dyke, Wikipedia, This page was last edited on 11 July 2026, https://en.wikipedia.org/wiki/Offa%27s_Dyke.
Williams, Ann, Offa’s Dyke: ‘the Stuff that Dreams are Made of 15 Dec 2019, Offa’s Dyke Journal SP – 32 (1), 10.23914/odj.v1i0.249, https://www.researchgate.net/publication/338550343_Offa’s_Dyke_’the_Stuff_that_Dreams_are_Made_of’
[62] Owen Lewis,‘A Species of Heathen?’ A Social History of English Migrants in Wales, c.1850-1914, Page 19 -20, PhD Thesis, Aberystwyth University, 30 Sep 2018, https://pure.aber.ac.uk/ws/portalfiles/portal/30022093/Owen_Lewis.pdf
Davies, John, A history of Wales, London, New York : Penguin Books, https://archive.org/details/historyofwales0000davi_g1b0/page/n5/mode/2up
Welsh Marches, Wikipeida, This page was last edited on 30 June 2026, https://en.wikipedia.org/wiki/Welsh_Marches