The Impact of Autosomal DNA Tests: A Profound Discovery

I did not receive ground breaking results from my initial completion of autosomal DNA (atDNA) tests back thirteen years ago. Perhaps I did not totally understand and appreciate how to use the results provided by autosomal tests to the fullest. I think I was more interested in the ethnicity estimates produced by the atDNA than the actual matches with other possible living, distant relatives. When I completed the AncestryDNA test around 2012, autosomal DNA testing was at its commercial infancy. The database of completed tests was comparatively small so the DNA matches were not as notable as they are today. [1]

I had my father and his sister take the tests for my curiosity sake. I wanted to see how the test results differed between each of our tests. My genealogical research at that time was focused on the more traditional aspects of finding historical facts and evidence on various family lines of descent and information on specific individuals.

All this changed when I received a message on October 23rd, 2019. The test results led to a discovery of two half brothers! As an only child, I would at times wonder what it would be like to have brothers.

While I was dumbfounded and flummoxed by the discovery, I have now been gifted with having two brothers through this discovery. Further collaborative work with my half brothers have revealed how this connection unfolded in our lives.

While this news was earth shattering to me, my half brothers and for all families involved, each family has accepted and embraced the genetic revelations. The adoptive parents of Greg, who are still alive, are fully supportive of the three of us establishing family relationships.

Since my half brothers are alive, for purposes of privacy I have only referred to them by their first name in this story.

Discovering Siblings Through Genetic Testing

There are numerous anecdotal stories of people discovering biological family members through atDNA testing. These stories underline that interpreting DNA results often goes beyond sterile numbers. It involves navigating complex emotional territories where understanding ‘shared centimorgans’ can facilitate reconnecting lost, unknown, or separated family members. As such, a shared centimorgan is a powerful tool that can help piece together scattered familial puzzles, reveal hidden secrets and offer not just answers but also emotional closure for many. [2]

“Discovering “new” family members through DNA genealogy testing can trigger a wide range of emotions, including happiness, anxiety, sadness, or even anger. In fact, the emotional experience may be so intense that many genealogy sites state they are not liable for any “emotional distress” that may result from using the service.” [3]

According to studies on direct-to-consumer atDNA testing, a small but significant percentage of people discover they have a full or half sibling they were previously unaware of through their results. This makes it a relatively common occurrence, though not the majority experience for most users. While “sibling” is often used in this context, the discovered sibling could also be a half-sibling (sharing only one parent) [4]

In one study that attempted to gain an understanding of the prevalence of discoveries and associated experiences of atDNA testers, it was found that “most (82%) … learned the identity of at least one genetic relative. Separately, most respondents (61%) reported learning something new about themselves or their relatives, including potentially disruptive information such as that a person they believed to be their biological parent is in fact not or that they have a sibling they had not known about.” [5]

Adoptees often pursue genetic genealogy testing to find biological relatives. Another primary reason for atDNA testing is to gain insights from medical genomic testing. Adoptees understandably seek genetic medical testing for various reasons, primarily related to understanding their health risks and making informed decisions about their medical care in absence of knowing the medical histories of biological kin. They may choose direct-to-consumer testing because of its affordability and accessibility. [6]

Reaching Out and Revealing the Discovery

DNA testing companies typically offer internal communication platforms or features that allow users to reach out to potential DNA matches. While these companies provide communication platforms, users typically have control over their privacy settings and can choose whether to make themselves visible or contactable by matches. Additionally, the specific features and functionality of these communication platforms vary and can be subject to change as companies update their services. [7]

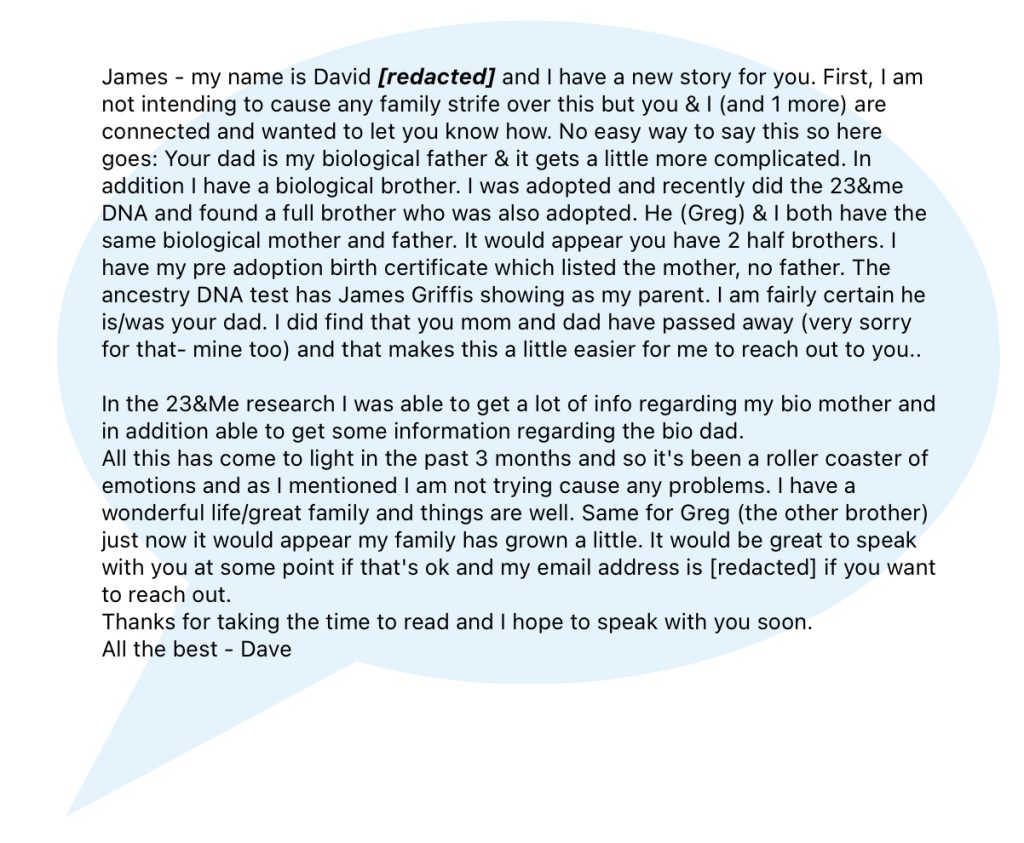
I received an AncestryDNA internal message on October 23, 2019 from David that contained information that not only were we half-brothers, but I had another half brother that was his full brother. It was a lot to mentally and emotionally digest!

October 23, 2019 ancestry.com Internal Mail Message
Click for Larger View | Source: AncestryDNA correspondence

I thought David did a great job in succinctly conveying a number of points surrounding his discovery. He got straight to the point with the news. He was empathetic to my situation of receiving this news. He also made sure reaching out to me would not cause any ripples in my family. Since his adoptive parents and my parents had passed, he considered the timing of reaching out to me.

David indicated that all the revelations of his having a full and half brother came to light within a three month time period. His discovery of our relationship was the result of completing an AncestryDNA test after he completed a 23andMe test where his full brother Greg discovered the relationship with Dave.

My Immediate Reaction

I was waiting for the car to warm up on a cold fall morning and was quickly going through messages I had received in the night. I was preparing to drive to a remote area for a morning gravel cycling ride. I rarely receive notices from AncestryDNA so Dave’s message caught my eye. I read and reread David’s message a few times. I sat in the car rereading the message for about ten minutes. I decided to digest what I had read on my bike then reach out to Dave when I got home.

I had many thoughts swirling in my head, trying to reconcile potential facts with family history and my father’s colorful life. I was trying to fit all of this together. For my father to have two children from the same person and then give them up for adoption was racking my brain and heart.

At the same time I could only imagine what he must have been going through to follow through this process. We do not know and will never know. He took this part of his life to the grave. I only can make conjectures on what happened and why, given what his life was like at the end of the 1950’s and early ’60’s. I could imagine that he was clearly boxed in by his actions and the subsequent demands placed on his life. Perhaps in his view, his only recourse was to help with the births and adoption. Otherwise the life he knew would have been torn asunder. 

My father and mother married when they were 20 and I came along within that year. He was trying to finish college, adjusting to married life, and caring for a family. He was living in a new world full of responsibilities, economic challenges and social pressures. I know that during his 20’s and 30’s, my father enjoyed living in two worlds, one associated with being a father and husband and the other world which was on the edge, staying out late gambling, playing cards and betting on horses and associating with a ‘different crowd’. I witnessed many arguments as a child, not really knowing what the adults were fighting over.

Over time my father became my best friend and best man in my weddings. Since the time I had a ‘consistent paying’ job in the early 80’s, I had called my father at lunch or after work everyday. The calls could have been 30 minutes or a short minute just to say hello. They became part of our ritual. I considered it unique and special to have a best friend and father all wrapped up into one.

While best friends always have secrets, I figured I knew my dad’s past fairly well. I was aware of the good and the not so good in his life.. He had a successful career in sales, was an accomplished regional master’s tennis player, started his own business, and immeasurably helped his family and friends in many ways throughout his life. He had a huge heart and like many, made a few mistakes along the way. His trajectory through life was full of twists and turns. My father had many facets to his life. This was my father that my family knew.

Having two children out of wedlock was certainly a surprise. However, having two children with the same person was more perplexing for me. This reflected something more than a fling or brief encounter. I also wondered but could understand why he never discussed this part of his life to me or others. While I was trying to make sense of this, I looked forward in getting more information from my newly found brothers, Dave and Greg, to figure it out.

When I returned from my bike ride, I wrote an email to Dave full of questions. He was genuinely happy to hear from me. We both harbored no ill will or bad feelings. We both wanted to simply obtain a clear, objective picture of the narrative, he from the adoptive side; and me from the revelation that I have brothers from another relationship of my father’s.

The DNA Results

When I conveyed to my extended family that I had discovered two half siblings through DNA testing, one of my relatives asked, “How do you know if the DNA tests are accurate or legit?“. My direct answer was the results were accurate. My answer, however, was based on both genetic knowledge and also traditional genealogical sleuthing for facts.

Between the three of us, we completed atDNA tests with 23andMe and AncestryDNA. All three of us completed tests with 23andMe. The only DNA test we do not have is an AncestryDNA test for Greg. This test would document the genetic relationship between our father and Greg.

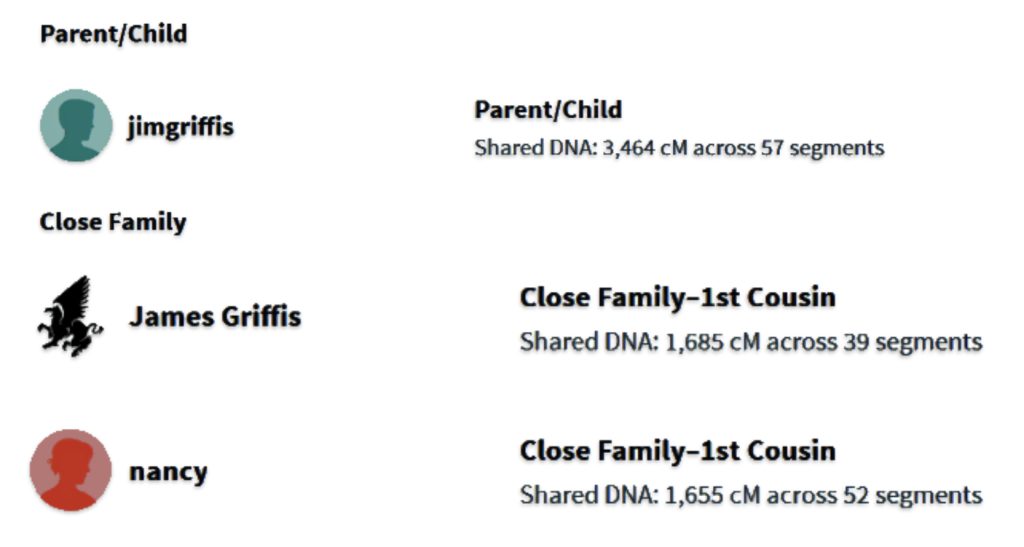
As stated previously, I as well as my father and paternal aunt completed autosomal tests seven years prior to Dave’s discovery. Having my father at the time complete an atDNA test provided prescient knowledge about our family genetics. Dave’s initial AncestryDNA test results indicated that ‘jimgriffis’ was his biological father and that my paternal aunt and I were close family members, possibly first cousins. (See illustration one.)

Illustration One: Dave’s AncestryDNA Autosomal Results
Screenshot

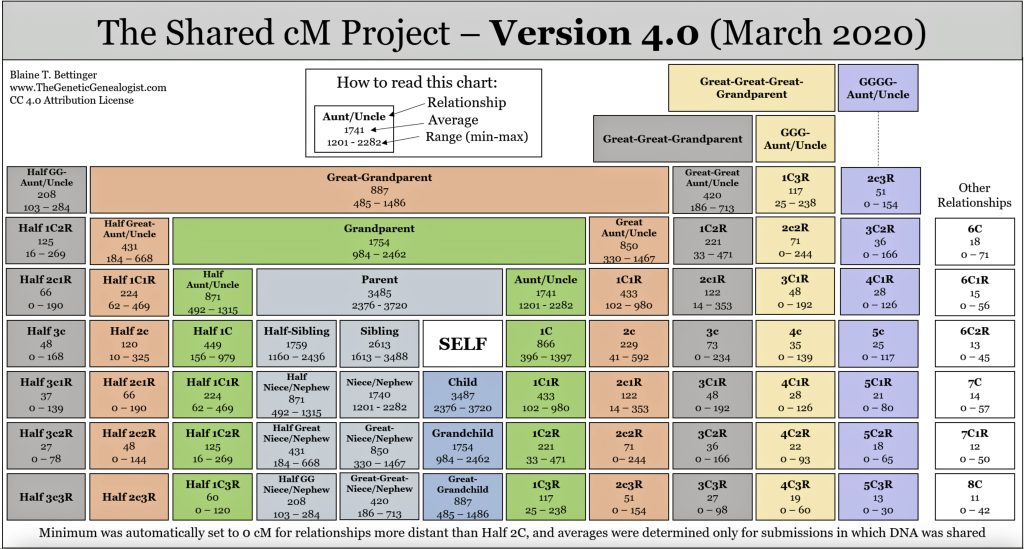
Half-siblings on Ancestry DNA will show up as “Close Family” or “First Cousins” and are expected to share an average of 1,759 centimorgans with a range of 1,160-2,436 centimorgans, according to data from the Shared Centimorgan Project.[8]

Half-siblings typically share approximately 25 percent of their DNA, between 1,160-2,436 cMs, and unlike full siblings, do not share fully identical regions (FIR). [9] There is a bit of an overlap of shared cMs for a number of genetic relationships in this cM range. If you do not have other forms of genealogical information, half-sibling DNA patterns can be confused with niece/nephew relationships, aunt/uncle relationships, and grandparent/grandchild pairs.

When interpreting autosomal DNA statistics, one must be careful to distinguish between the distribution of shared DNA for given relationships and the distribution of relationships for given amounts of shared DNA.” [10]

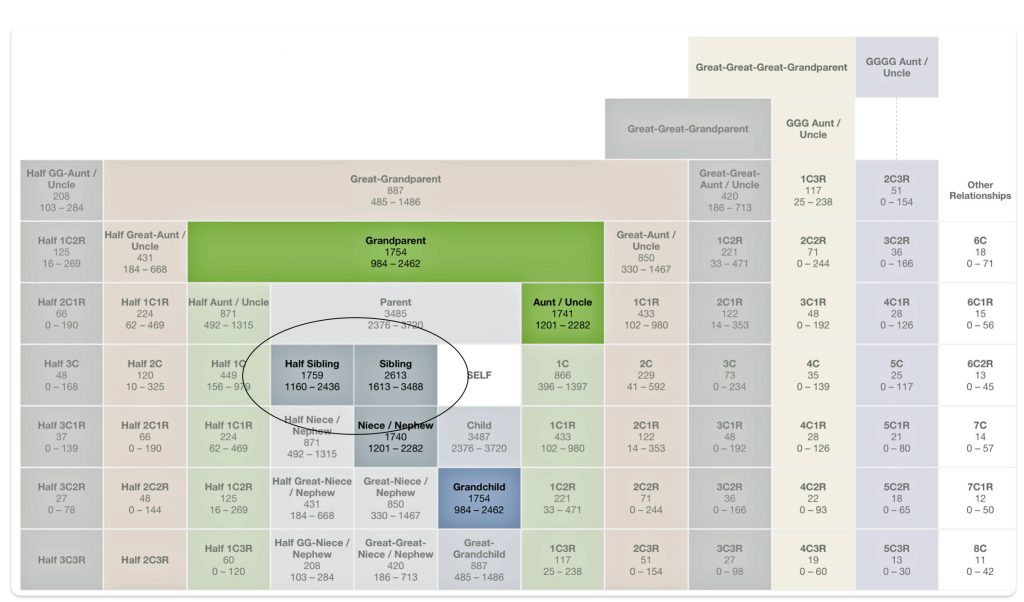
This overlap is reflected in a genetic relationship chart produced by the Shared cM Project [11], see illustration two below. I have used a cM value of 1722 and 1735 since the atDNA shared cM test value with me for Dave is about 1735 cMs and with Greg is about 1722 cMs for the 23andMe test results. [12]

Illustration Two: Possible Relationships with a cM Value of 1722 and 1735
Click for Larger View | Source: Johnny Perl, Introducing the updated shared cM tool, 27 Mar 2020, DNA Painter Blog, https://dnapainter.com/blog/introducing-the-updated-shared-cm-tool/

Aside from the possible relationships that can be found with a cM value of 1722, it is interesting to note the overlap between sibling and half-sibling relationships in illustration two. The cM range for siblings is 1313 – 3488 and the range for half-siblings is 1160 – 2436, with an over lap of 823 cMs.

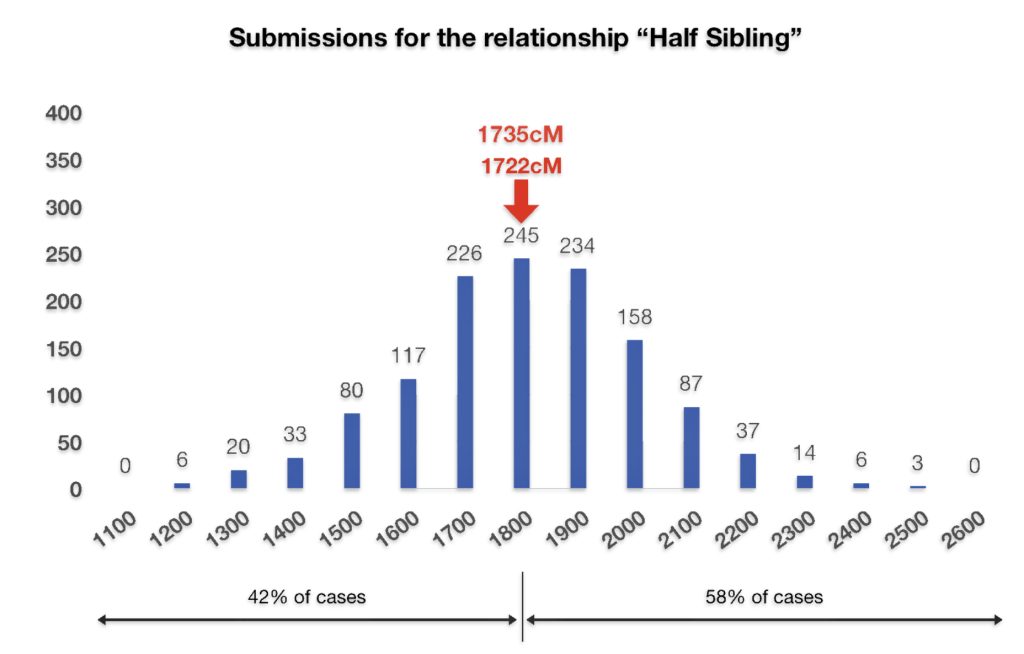
If we look at the total number of submissions in the Shared cM Project for ‘half-sibling’ relationships, there were 1266 submissions for the Half Sibling relationship with a mean value of 1759 cM and a standard deviation of 207cM. Illustration three provides the distribution frequency of the cM values for half-sibling matches. Basically, a value of 1722 or 1735 is hovering around the middle of the distribution of cM values for half siblings. Hence, my answer to the question of the legitimacy of the test results is the results are pretty solid and reliable.

Illustration Three: Distribution of cM Values for Half Sibling Relationships in the Shared cM Project
Click for Larger View | Source: Johnny Perl, Introducing the updated shared cM tool, 27 Mar 2020, DNA Painter Blog, https://dnapainter.com/blog/introducing-the-updated-shared-cm-tool/

The cM test results for matches can differ between DNA companies. For example table one below reflects the estimated cM values for matches between me and my half brothers based on AncestryDNA and 23andMe test results. Both companies report results in different ways. Depending on the DNA company, the predicted relationship is depicted by different measures: the total percentage of shared DNA, the number of shared segments, the length of the shared segments, the longest block of cMs. Different companies may also provide slightly different relationship estimates due to variations in their testing algorithms and reference databases.

Essentially 23andMe provide percent of shared cMs and AncestryDNA provides number of shared cMs to document genetic relationships.

Table One: cM Match Results between Jim, Dave and Greg

cM Share
Half-Sibling
Relationship
with Jim
Percent
Shared cM
(23andMe)
AncestryDNA
Number of
matched cMs
cM Conversion
using Shared cM
Project conversion
Conversion using
68 x % Shared
David23.32168517351585.76
Greg23.14– –17221573.52
See footnote [q]

The cM ranges for each of the DNA companies and the Shared cM Project also differ, as reflected in table two.

Table Two: cM Ranges for Half Sibling Relationships

SourcecM Range
for Half Sibling
23andMe1264 – 2529 cM
AncestryDNA1450 – 2050 cM
Shared cM Project1160 – 2436 cM

When Dave notified me of our genetic relationship, I revisited and reviewed my DNA matches in AncestryDNA. I had not reviewed my matches in a long time; and there was Dave as a half brother!

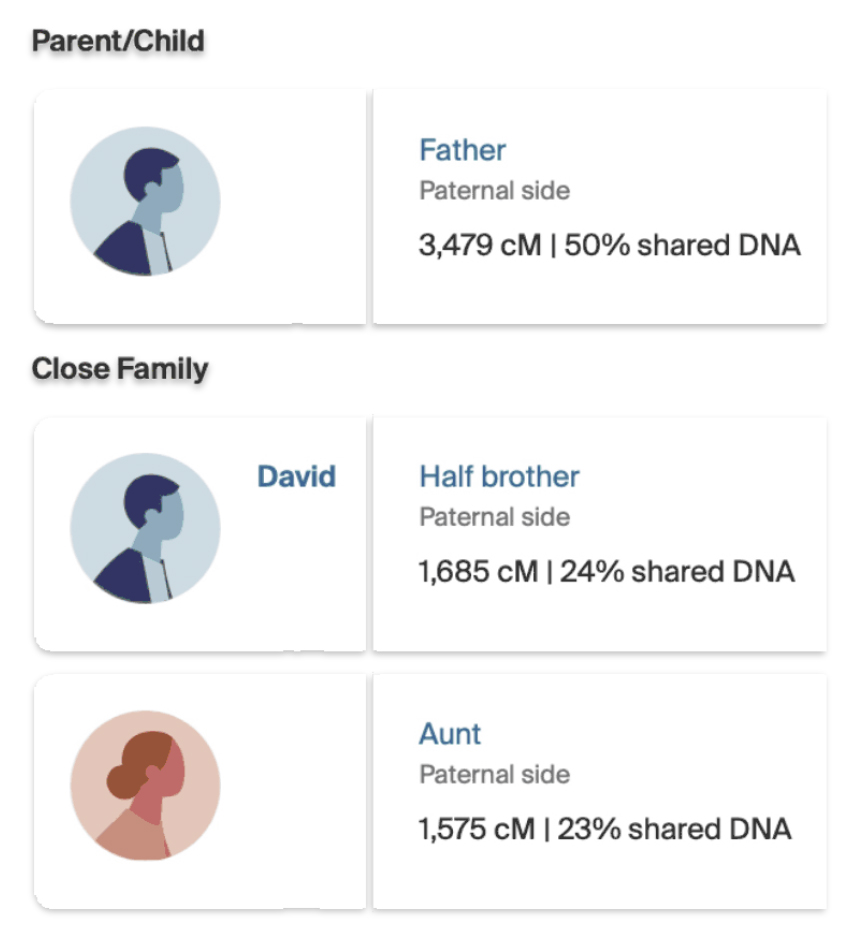
The number of shared cMs between my father were similar to the results Dave received in his test results. I shared 3,479 cMs across 26 segments with my father ‘jimgriffis’. Dave shared 3,464 cMs with ‘jimgriffis’ across 57 segments. (See illustrations Three and Four.)

Illustration Four: My AncestryDNA Autosomal Matches
Click for Larger View | Source: AncestryDNA matches for James Griffis

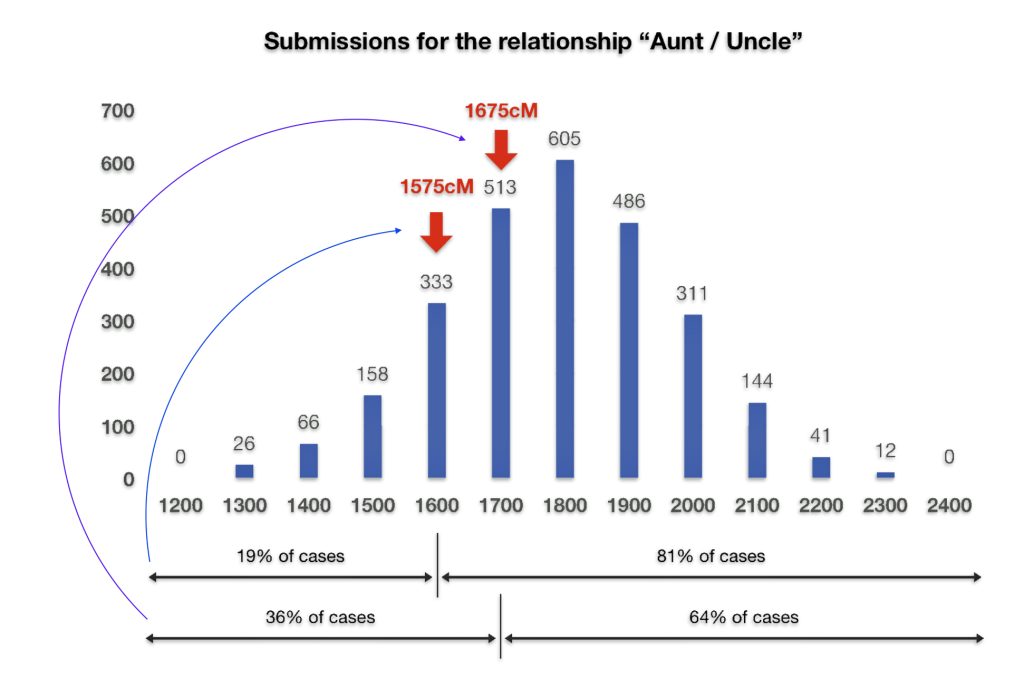
Both Dave and I also have similar matches with our paternal aunt. I share 1,575 cMs and 41 segments with my paternal aunt. Dave shares 1655 and 52 segments with our paternal aunt. The ancestryDNA numbers are within the cM range for an aunt/nephew relationship, as reflected in illustration five..

Illustration Five: Shared cM Project Submissions for Aunt/Uncle
Click for Larger View | Source: Johnny Perl, Introducing the updated shared cM tool, 27 Mar 2020, DNA Painter Blog, https://dnapainter.com/blog/introducing-the-updated-shared-cm-tool/

At the beginning of November 2019, I completed an atDNA 23andMe test to validate the DNA connection between the three of us. Before completing the test, I only had a test connection with Dave. The following are the results of my 23and Me atDNA test.

Illustration Six: 23andMe Autosomal Matches
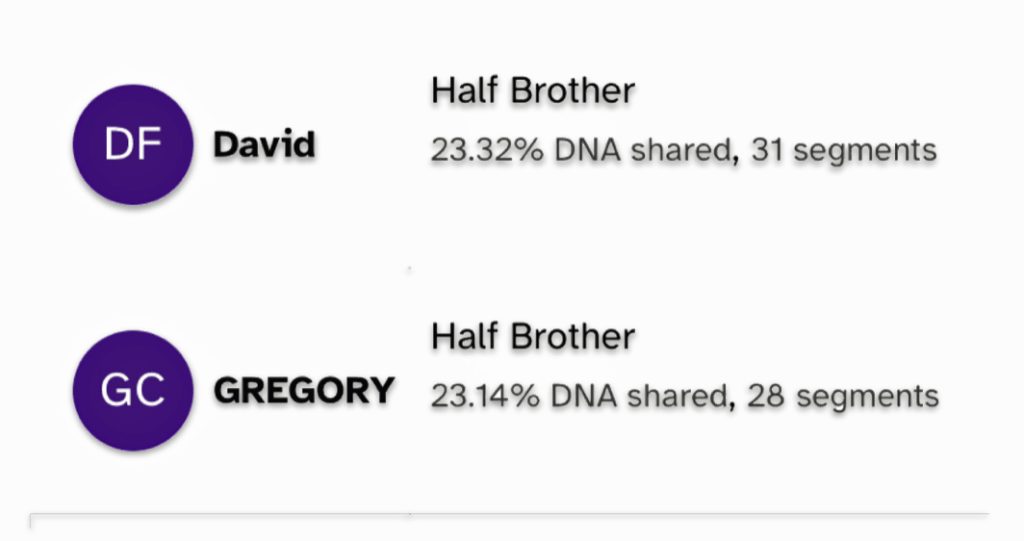
Click for Larger View | Source: 23andMe DNA matches for James Griffis

As reflected in illustration six above, the numbers are very close for each half sibling relationship.

Based on the science, half-sibling DNA relationships show distinct patterns that can be reliably identified through atDNA testing. Modern DNA tests can achieve up to 99.9% accuracy for half-sibling relationships when confirming shared centimorgan (cM) ranges, using tests that analyze hundreds of thousands of DNA markers, and including the known parent’s DNA in testing. [13]

As the youtube video below discusses, atDNA tests can identify half-siblings with a high degree of accuracy, additional relationship testing or analysis may sometimes be needed for full confirmation, especially in complex cases. The tests are generally very reliable for distinguishing half-siblings from full siblings or unrelated individuals.

Can atDNA Tests Find Siblings or Half Siblings?

(A) DNA test can prove half-siblings. As a matter of fact, it’s the only accurate way to establish the biological relationship between the people in question. In a half-sibling situation, the siblings share one biological parent.  But you need to test the parent. Here is are the steps involved:

  1. The potential half-siblings need to share 1160-2436 cm.
  2. If the potential siblings are in range AND share more than 1600 cm, there must not be any fully identical regions. If there are, then it’s more likely a full sibling relationship.
  3. Each potential half-sibling must share 2500-3720 cm with the parent.

If all three steps are true, then you’ve got yourself a half-sibling relationship.[14]

Background of the Full Brothers’ Discovery and Research

Similar to many individuals who were adopted, Dave and Greg completed atDNA tests to understand their medical predispositions and fill gaps in their family health history, which becomes increasingly important as one ages and have children of their own. This information helps providing answers to routine medical questions about hereditary conditions and genetic risks that doctors typically ask during examinations.

In addition to exploring genetic health history, Greg had been trying to find out more about his biological past since 2007. He knew from his adoptive parents that he was born in Rochester, New York. The adoption agency in Rochester sent him a note back in 2007 that stated his father was a salesman, married, and his mother was a nurse. Both were college educated. The father helped with the costs of birth and adoption. The note stated that ‘both parents were very religious and the controversy would have been too much so adoption was the solution‘.

In the summer of 2019 Greg discovered Dave as a full brother from a 23andMe match after Dave completed the test. Similar to Greg, Dave also completed the 23andMe test at his wife’s behest, to gain knowledge about his genetic medical past. At the time, Dave said he did not have much faith in the results.

Greg reached out to Dave on July 29, 2019 with “Hello Bro” as the subject line in an email. This started the ball rolling. According to the 23andMe analysis, they both are full siblings.

After this email, Dave started a concerted effort at obtaining additional information about his biological past. Greg had been conducting research previously and tracked their mother, Esther, to Arizona and her marriage in 1973 and her subdeath in 1996. Esther was a nurse by profession. Her nursing career took her many places, from Albany, New York to New Haven, Connecticut, to Alaska, and then to Phoenix, Arizona where she was married and had three sons. Through their collective efforts, Dave and Greg discovered four half siblings!

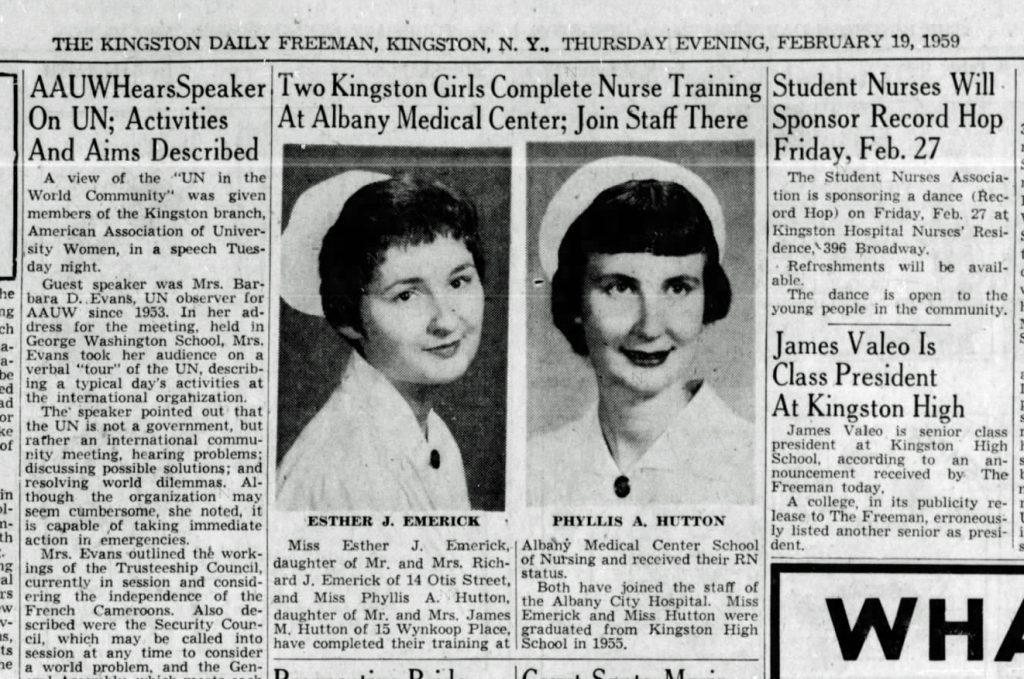
Using various sources, Dave started to piece together Esther’s family who was originally from the Kingston, New York area. He found a friend of Esther’s and nursing school classmate of Esther’s named Phylis Hutton. Both started their nursing careers in Albany, New York.

When Dave discovered Phylis in 2019, she was in her 80’s and living in Kingston, New York. He had a short telephone conversation with her. She indicated she remembered and knew about Esther going to Pittsfield to have a child. Dave was born in Pittsfield, Massachusetts. Dave asked if she knew of the father. She said she did not remember the name but she recalled that his father was a reverend and recalled that he was an orderly at the hospital and that ‘he was extremely handsome’.

Newspaper Announcement – Esther Emerick and Phyllis Hutton
Click for Larger View | Source: The Kingston Daily Freeman, Kingston New York, Thursday, 19 Feb 1959

A short time after his call with Phyllis, Dave received another call from a newly found first cousin from his biological mother’s side. His cousin was contacted by Phyllis about the news and her telephone call with Dave. Dave’s first cousin then received information from another cousin and advised Dave to follow up on a name ‘James D. Griffis’ from Troy, NY. The cousin stated that his father was Harold W Griffis, a prominent minister back in the 1950s-1960s. It was thought that James was Esther’s suitor at the time and that James had a brother John and a sister.

In early August 2019, Dave received his pre-adoption birth certificate. The father was not listed but his mother was listed as Esther Emerick, born 1938, Kingston, New York.

Working Together: Verifying Facts, Time and Place

At the time Dave initially reached out to me, the historical information regarding their biological father did not entirely jibe between Greg and Dave’s research. The biological father on both Dave and Gregs’ adoption forms indicated that their father was a salesman. Phyllis Hutton, from Esther’s nursing past, indicated that the father was an orderly at the hospital that she and Esther were employed in Albany. Before his passing, Dave’s adoptive father indicated that he knew his biological father was a salesman and his biological mother was a nurse.

To obtain additional or potential new leads, Dave completed an ancestry.com DNA test to see if people would show up as close relatives. He received his results October 17, 2019. He opened the results and looked at DNA matches on October 21, 2019. I, Nancy, and my father showed up as close relatives. Dave then sent me the note on the 22nd of October.

After a few email exchanges, Dave and I scheduled a telephone conversation about a week after his initial contact with me. We had a two hour conversation on many subjects. One part of the conversation, tied the facts and events together.

My dad was a salesman but he also had a second job as an hospital orderly around 1959 – 1961. This would explain the discrepancy between the stated occupation on the adoption documents and oral history that was obtained from Esther’s family and friend.

I recalled my father working nights when I was in first grade. I recall one time meeting my father with my mother in our car one morning near a big brick building which was the Albany Medical center. The adults were talking. but I paid little attention to what was discussed. As a child in the back seat of the car, I recall my Dad leaning into the window as he was standing beside the car. I did not listen but I recall my Dad saying at the end of teh conversation, “Well, I need to go to my other job now” and they said their goodbyes and my mother drove on to do errands.

When my father got married, my paternal grandparent’s ‘social contract’ with my father was that they would financially help him with college until he got married. Once he got married, he was on his own, he had to pay for his own education and living costs.

My parents married when my father was a Junior in college. My dad subsequently worked two jobs to support a family and school costs. I was born while he was in college. One of his two jobs was working as an hospital orderly in the state mental institution on the night shift while he finished college.

After graduation, he and his young family moved back to the Troy, New York area. He continued his colorful ways. He accrued a lot of debt probably through gambling. He received financial assistance from his brother’s father-in-law who was a banker.

I believe this was a melting point for him, for my mother, and his parents Harold and Evelyn. He needed funds to supplement his current standard of living associated with his day job to pay off the debt. He again got a night job based on the skill sets he knew he had – being an orderly at Albany Medical. 

I told all of this to Dave and asked when and where his mother was a nurse in Albany. Dave directed me to the newspaper article above. She was nurse at Albany Medical in 1959-1960. Phyllis’ story started to make sense. My dad was a salesman at Kimmey Company, a plumbing construction company, and also an orderly at Albany Medical. 

Dave was born in 1960 in Pittsfield, MA. His brother Greg was born in 1961 in Rochester, NY. Based on information gleaned from Dave and Gregs’ adoption papers, our father was fully aware of their births and it appears he provided financial support to Esther in the birth and adoption process.

Non-Marital Pregnancies and Adoptions in the late 1950s and early 1960s

Having and keeping a child out of wedlock would have been quite a challenge for Esther. Esther was from a ‘prominent religious oriented’ family in Kingston, New York. The possibility of raising two children out of wedlock was inconceivable. James had a young family, was married to a practicing Catholic wife and was raised by a Methodist minister. Based on their upbringing, abortion was not a moral choice for both Esther and James even if it were legally available at the time. For various unknown reasons on both sides, divorce was not an option as well.

Esther was starting her nursing career in 1959. To have two children and be a single mother back to back in 1960 and 1961 would have been daunting.  I can only imagine the stress and social and economic challenges that must have been placed on our father, Esther and my mother.  I do not know if my mother was aware of the births.  I assume that she was aware.

This was a period in American history that was known as the Baby Scoop Era. It  started after the end of World War II and ended in the early 1970s, characterized by an increasing rate of pre-marital pregnancies over the preceding period, along with a higher rate of newborn adoption. [15]

It was common knowledge that many white unwed mothers had the resources to conceal their pregnancies, often by traveling far from home to have their babies, to states that didn’t record illegitimacy on birth certificates. ” [16]

The ability to avert having a child in the late 50’s was difficult given the limited options for contraception and the legal and religious prohibitions placed on abortion. For non-wed mothers, the viable option was having the child and offering the child up for adoption.

The legal status and accessibility of birth control was severely restricted by the 1873 Comstock Law, which criminalized contraceptives and banned their distribution through mail or interstate commerce. [17]

In the 1950s, “Americans spend an estimated $200 million a year on contraceptives. Due to massive improvements over the past decade in condom quality and a growing awareness of the inadequacies of douches, “rubbers” are the most popular form of birth control on the market.

Although the vast majority of doctors approve of birth control for the good of families, anti-birth control laws on the books in thirty states still prohibit or restrict the sale and advertisement of contraceptive devices. It is a felony in Massachusetts to “exhibit, sell, prescribe, provide, or give out information” about them. In Connecticut, it is a crime for a couple to use contraception.” [18]

The year that Dave was born, “(t)he adoption of the birth control pill grew rapidly after its FDA approval on June 23, 1960. 400,000 women sought prescriptions in the first year, despite the high cost of $10 (equivalent to $80 today).” [19] The first pill, Envoid, in addition to prohibitive cost, it also produced some negative side effects: nausea in the first few months and weight gain.

In the 1950s, abortion was heavily restricted across the United States with severe consequences for both providers and women seeking the procedure. By 1950, abortion was illegal in every state except when necessary to save the woman’s life. Forty-four states only permitted abortion when the woman’s life was endangered. [20]

By the middle of the twentieth century, almost every state in the country had brought their adoption laws into alignment with the principles laid out by two influential groups: the U.S. Children’s Bureau (USCB) and the Child Welfare League of America (CWLA) guidelines and the Child Welfare League of America. [21]

The USCB was created by the federal government in 1912 as a Progressive Era organization that introduced public health interventions to reduce infant mortality. It also became a national leader in making policy related to illegitimacy and unmarried mothers. The group was motivated by multiple scandals with commercial and unregulated adoptions that had lethal consequences for the infants. The CWLA, which brought together public and private service groups starting in 1915, later initiated efforts to standardize adoptions that culminated with its influential 1958 publication Standards for Adoption Service.[22]

By the late 1940s, existing service organization like the National Florence Crittenton Mission—later called the Florence Crittenton Association— encouraged single mothers it served to relinquish their infants. It is not known if Dave and Greg were born in a Maternity home in Pittsfield and Rochester. [23]

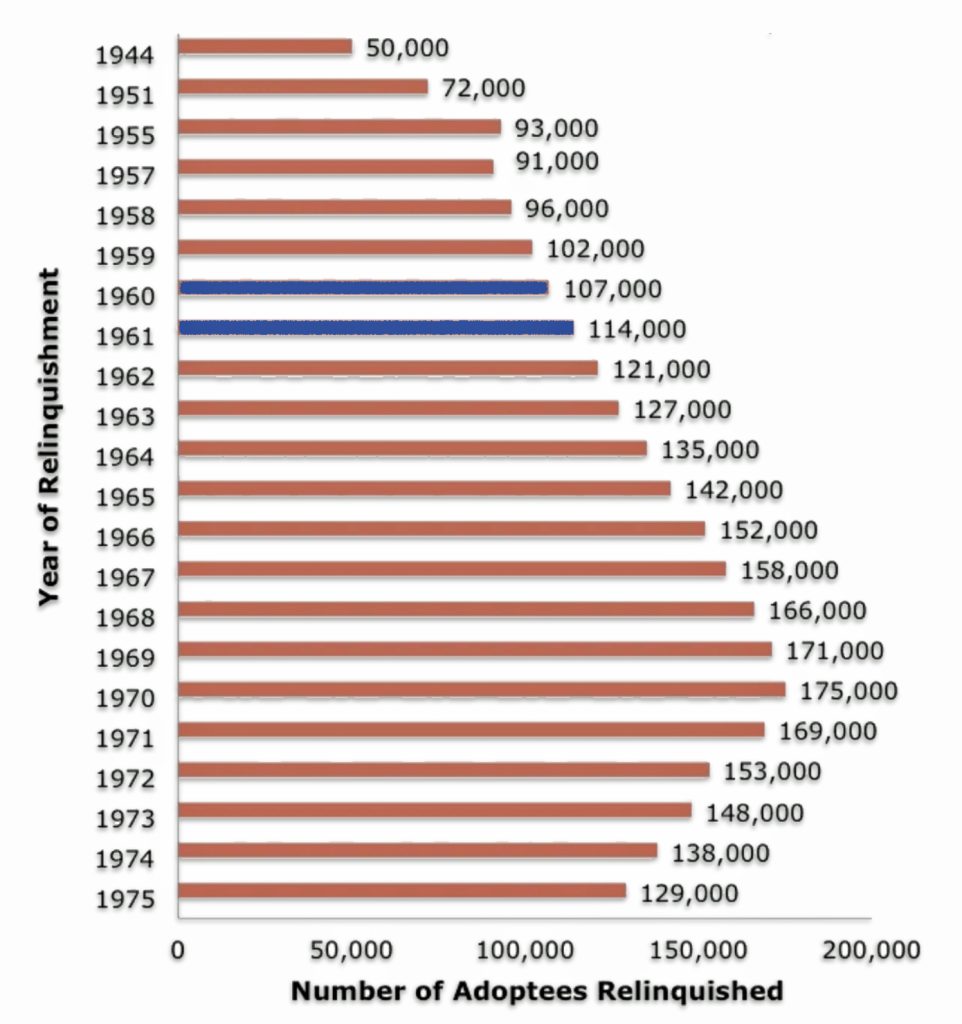
Figures vary for the number of adoptions during the postwar decades, since most of them went unrecorded. One source indicates the number of adoptions more than doubled (128 percent) from an estimated 50,000 in 1945 to 114,000 in 1961, the year that Greg was born. As reflected in illustration seven, Dave (born 1960) and Greg (born 1961) were born and adopted in a period where there was a steady rising nationwide wave of adoptions. [24]

Illustration Seven: Adoption Trends 1944 – 1961
Click for Larger View | Source: Penelope L. Maza, “Adoption Trends: 1944-1975”, Child Welfare Research Notes No. 9 (U.S. Children’s Bureau, August 1984

The heyday for domestic adoption was the mid-20th century. Between 1940 and 1964, the rates of so-called “illegitimate” pregnancy doubled and tripled, from 89,500 in 1940 to 275,700 in 1964.[25]

Family Support

Without judgement, I shared the surprising discovery of having two half-siblings to my immediate and extended family in an e-mail. I concluded with the following:

Each of you had a unique relationship with my father. Based on that relationship, I am confident to state that he treated you like, as he would say, aces. He was there for you and loved you dearly even when there were hard times. So I hope before you cast judgment, as he would do, you see through your heart and then open your arms.

I told Dave and Greg that I was very happy that they have found answers to questions that I imagine adopted children always have in the back of their minds. I told them I hoped they have or had wonderful parents and their life was good. I also told them I welcomed them as my brothers and looked forward to having them in my life. As an only child I always longed to have brothers.

Many of my family members replied to this news. One of my aunts indicated, “Jim was a young wild character and got into a lot of trouble with his marriage to Peggy, gambling and finances, and his relationships with other women. He grew up the hard way over his lifetime and became the loyal person we love and admire. He extended his care and loyalty to all of us.”

One of my cousins said in a reply to my email:

I love that this family can accept this type of news- hold Uncle Jim accountable for the affairs, but forgive, love, and move forward, free of judgement. We truly are a class act clan!

My cousin’s sentiment sums up the common sentiment I have received from family members. We as a family are strong, tolerant, have a good sense of humor and full of different personalities. We all are not perfect and if someone takes a misstep, we help them regain their balance. When you are connected by so much family and love, forgiveness and collectively moving on in life is much easier.

I know David and Greg appreciate the positive support.  In addition to our communication, I have provided copies of a commemorative book I created that chronicles our father’s life. The book gives them an idea of what their biological father was like throughout his life.

Conversely, I have been introduced to many of Dave’s friends and his family on ‘his turf’. I have also have communicated with Greg’s step-parents who are proud and happy that we have found each other.
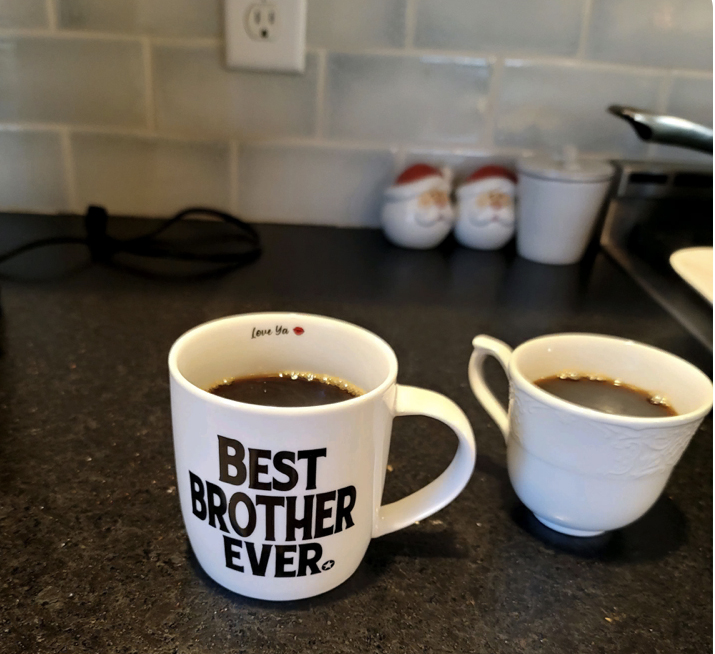
This is a photograph of a holiday gift I had given to each of my brothers in 2024. This is Dave’s coffee mug in use.

Moving Forward and Continuing the Journey

Discovering siblings late in life can be a complex and emotionally charged experience, involving a mix of excitement, confusion, curiosity, and sometimes even grief, as individuals grapple with a new family dynamic, a revised understanding of their identity, and the potential for a significant relationship that was previously unknown. This can be influenced by the circumstances surrounding the discovery, like adoption, family secrets, or a parent’s hidden past, leading to varying levels of adjustment and impact on personal relationships.

For Dave, Greg and me, I think we handled the discovery with excitement, gratitude and promise. We are in agreement that it would have been nice if we were able to experience having our brothers in our lives when we were in earlier stages of our lives. In absence of the shared past, we are grateful to presently have each other in our lives.

We discovered our relationship as siblings when we ranged in ages of 59 to 66. We do not have shared histories as children, adolescents, young adults, and when we went through mid-life experiences. We were not there for each other through our ups and downs. Our bond lacks all those experiences of ‘growing up’. Our bond is based on our unique past and the future, learning about each other’s past life and our respective families, and presently enjoying our time together as brothers.

A Zoom Call
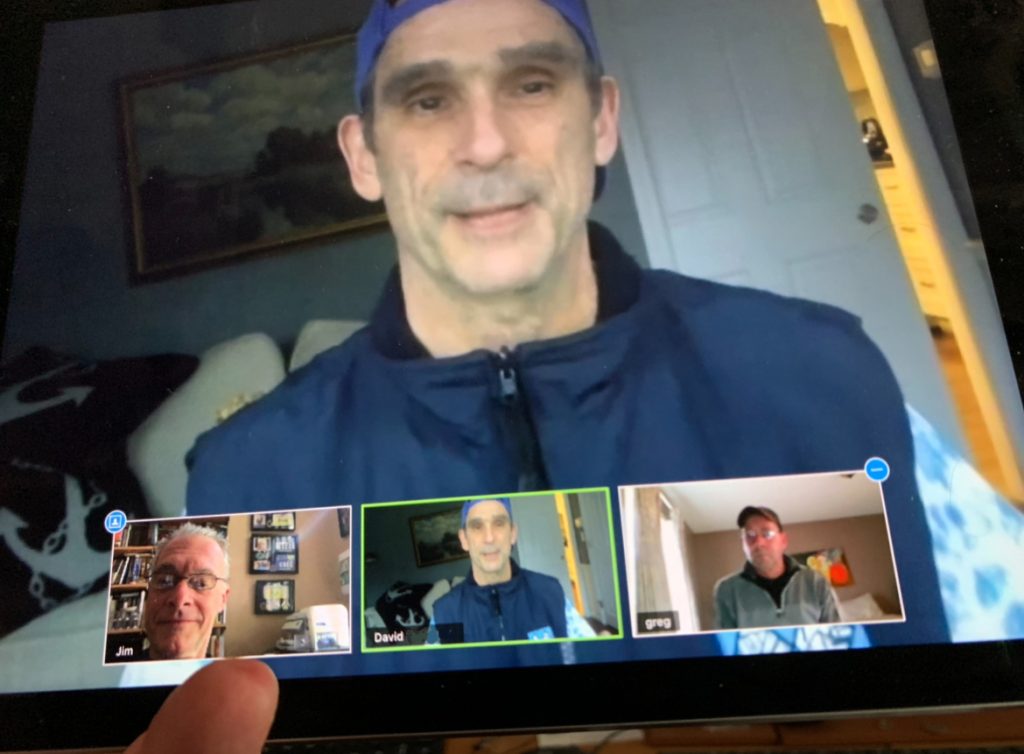
Since the beginning of 2020, we have been attempting to arrange a time when all three of us can get together. Sad to say our schedules have not yet been able to coincide. As twosomes, we all have gotten together on various occasions. We do not live close to each other and we each have family demands. My two younger brothers are still working so they have the added demands of work life. I am confident the three of us will enjoy time together in the future and be part of each other’s lives.

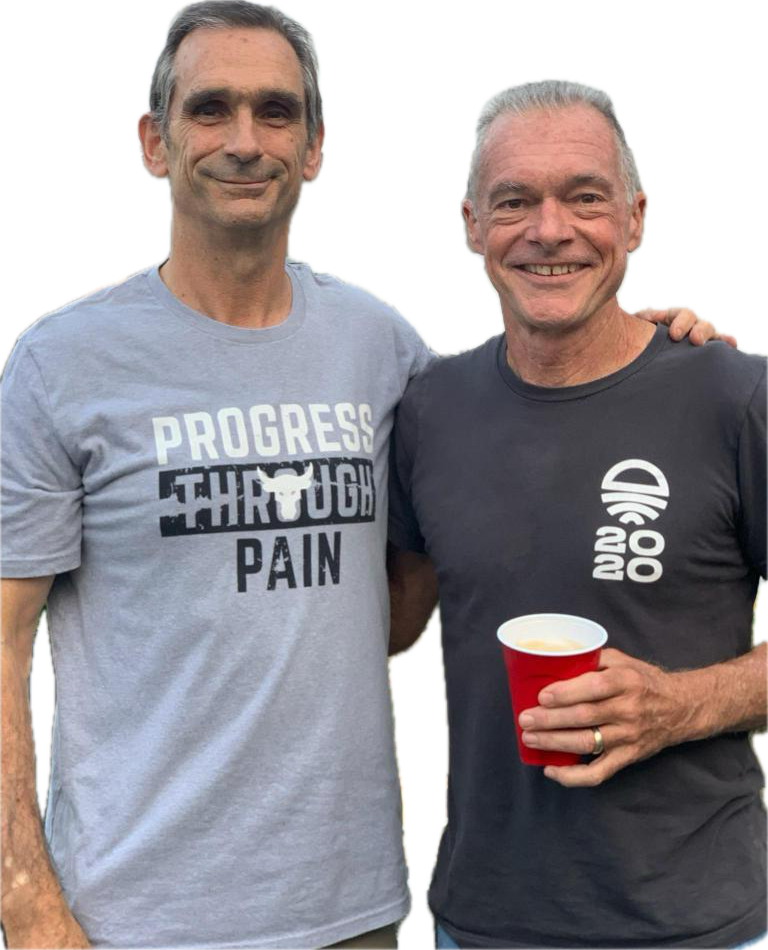
Dave and Jim September 2021
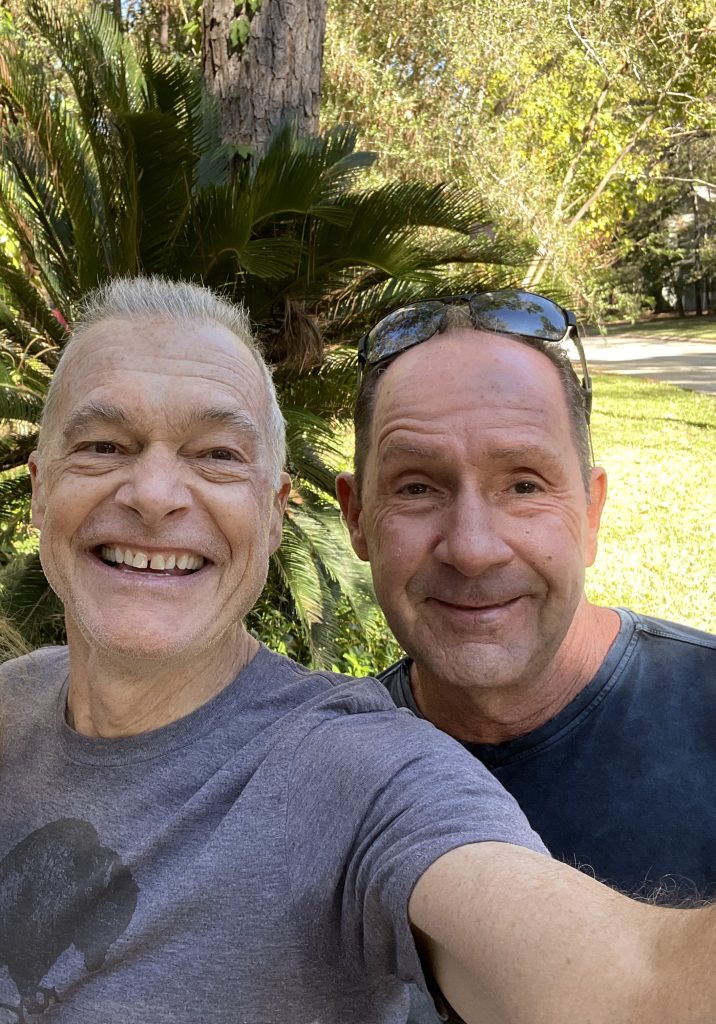
Jim and Greg Thanksgiving Weekend 2024
Echoing a title of a book of an adoptee’s journey through the American adoption experience: ‘You don’t know how lucky you are!“. [26]

I think this statement is true for Dave and Greg … as well as for me.

Sources

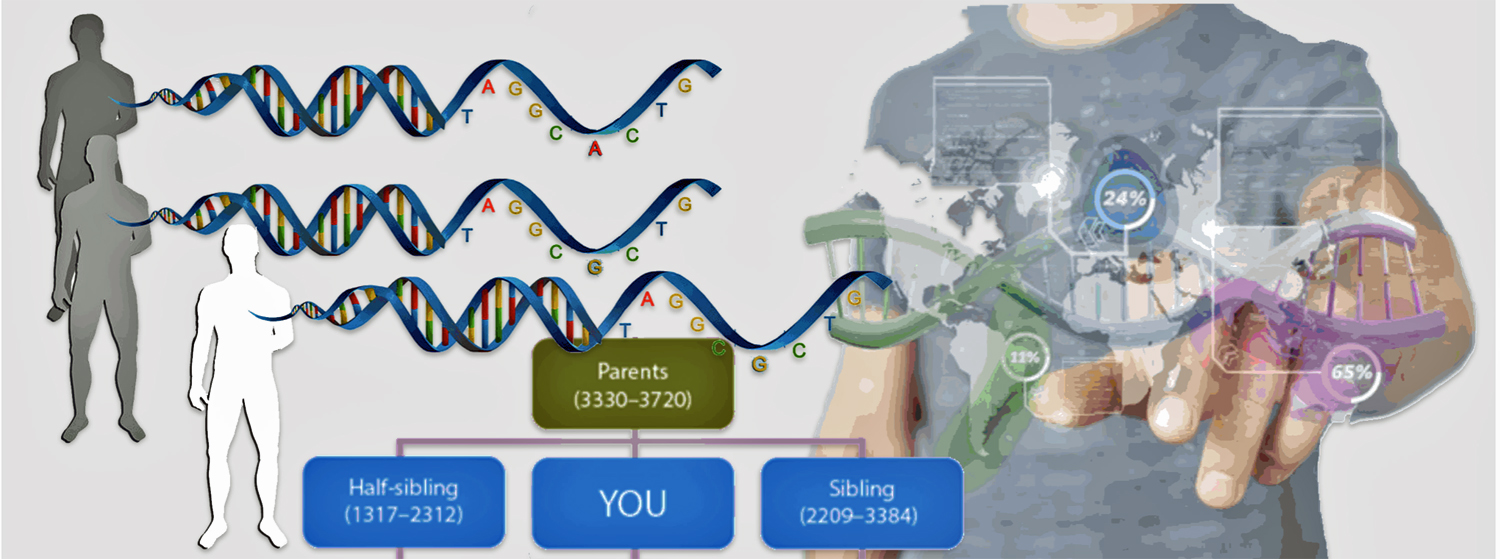
Feature Image: This is a modified version of an illustration from Pereira, Rita, Pietro Biroli, Stephanie Von Hinke, Hans Van Kippersluis, Titus Galama, Niels Rietveld, and Kevin Thom. 2022. “Gene-environment Interplay in the Social Sciences.” OSF Preprints. 4 March 2022 DOI:10.31219/osf.io/d96z3; and a stock photo  https://stock.adobe.com/

[1] Autosomal DNA testing has undergone significant changes and improvements since its introduction in 2009. 23andMe launched the first autosomal DNA test for genealogy in late 2009, marking a revolutionary change in genetic genealogy. This test allowed people to examine DNA inherited from all ancestral lines.

Family Tree DNA launched their Family Finder test in February 2010. AncestryDNA began rolling out their autosomal DNA test in the autumn of 2011, with an official launch in the United States on May 3, 2012. They initially kickstarted their database by offering free tests to over 10,000 selected subscribers. AncestryDNA reached 2 million users by August 2016.

The database showed exponential growth until April 2018. Growth slowed after April 2018, adding 6 million people instead of the projected 12 million in the following year. Database growth declined by 51% from April 2018 to May 2019. By 2021, AncestryDNA led the pack in database size with over 20 million completed test kits.

By 2014, AncestryDNA’s database had grown rapidly, selling 30,000 to 50,000 DNA kits monthly. The test became available internationally when AncestryDNA launched in the UK and Ireland in 2015, followed by expansion to 29 additional countries in February 2016.

Testing accuracy has improved significantly over time. Early ethnicity estimates were often inaccurate. Current continental-level results are now highly reliable.

Genealogical DNA test, Wikipedia, This page was last edited on 18 November 2024, https://en.wikipedia.org/wiki/Genealogical_DNA_test

History of genetic genealogy, International Society of Genetic Genealogy Wiki, This page was last edited on 27 April 2024, https://isogg.org/wiki/Timeline:History_of_genetic_genealogy

Doriottt, Candace,   Genetic Codes Unraveled: New Clues to Human History. Ancestry magazine, January/February 2000, Page 15 – 21

Theunissen, C.A. The Effects of DNA Test Results on Biological and Family Identities. Genealogy 2022, 6, 17. https://doi.org/10.3390/genealogy6010017 

AncestryDNA at Back To Our Past, 12 Nov 2014, Cruwys News, https://cruwys.blogspot.com/2014/11/ancestrydna-at-back-to-our-past.html

Williams, Ed, Analysis of AncestryDNA Tests Processed from June 2016 to August 2019, 12 Dec 2019, Counting Chromosomes, https://countingchromosomes.com/blog/70-analysis-of-ancestrydna-tests-processed-from-june-2016-to-august-2019

Venner, E., Patterson, K., Kalra, D. et al. The frequency of pathogenic variation in the All of Us cohort reveals ancestry-driven disparities. Commun Biol 7, 174 (2024). https://doi.org/10.1038/s42003-023-05708-y 

Genealogical Database Growth Slows, 22 Jun 2019,The DNA Geek, https://thednageek.com/genealogical-database-growth-slows/

AncestryDNA Surpasses 20 Million, 27 May, 2021, The DNA Geek, https://thednageek.com/ancestrydna-surpasses-20-million/

[2] See for example:

Catherine A. Ball, Mathew J Barber, Jake Byrnes, Peter Carbonetto, Kenneth G. Chahine, Ross E. Curtis, Julie M. Granka, Eunjung Han, Eurie L. Hong, Amir R. Kermany, Natalie M. Myres, Keith Noto, Jianlong Qi, Kristin Rand, D. Barry Starr, Yong Wang and Lindsay Willmore, AncestryDNA Matching White Paper, Updated July 15, 2020, AncestryDNA, https://www.ancestrycdn.com/support/us/2020/08/matchingwhitepaper.pdf

Topor, David, Genealogy testing: Prepare for the emotional reaction, Jun 6 2018, Harvard Health Blog, https://www.health.harvard.edu/blog/genealogy-testing-prepare-for-the-emotional-reaction-2018060613990

Guida-Richards, Melissa, My Half Siblings Found Me On 23andMe. I Wasn’t Prepared For What Happened Next, May 28, 2020, HuffPost, https://www.huffpost.com/entry/discovered-siblings-reunited-23andme-dna-test_n_5e690e55c5b60557280f743e

Kaiser, Molly, I’m 22 and I just met my half sister for the very first time. Here’s how it went, Sep 30, 2022, Today, https://www.today.com/health/essay/dna-test-met-half-sister-rcna49840

Williams, Brianne Kirkpatrick, Watershed DNA, https://www.watersheddna.com/blog

Daniella, I Found My Birth Parents and 7 Half-Siblings Thanks to a MyHeritage DNA Test, Apr 6 2023, MyHeritageBlog, https://blog.myheritage.com/2023/04/i-found-my-birth-parents-and-7-half-siblings-thanks-to-a-myheritage-dna-test/

Imbeault, A DNA test revealed a sister I never knew existed. Now what?, Sep 17 2019, The Globe and the Mail, https://www.theglobeandmail.com/life/first-person/article-a-dna-test-revealed-a-sister-i-never-knew-existed-now-what/

Milligan, Kate, An Only Child’s DNA Surprise, 23andMe Blog, https://blog.23andme.com/articles/an-only-childs-dna-surprise

Molina, ‘Kimberly, My stomach dropped’: Half-sisters find each other through ancestry search, Oct 09, 2018, CBC, https://www.cbc.ca/news/canada/ottawa/half-sisters-discovery-ancestry-dna-1.4849559

Ventura, Risell, Man discovers 18 half-siblings after 23andMe DNA test, Jan 6 2022, 2KUTV, https://kutv.com/news/offbeat/man-discovers-18-half-siblings-after-23andme-dna-test

Hauswirth, Heather, How a DNA test led me to the brother I never knew existed,  Nov 14 2018, New York Post, https://nypost.com/2018/11/14/how-a-dna-test-led-me-to-the-brother-i-never-knew-existed/

Segalov, Michael, I took a DNA test and found a new family’: the drama and joy of meeting long-lost relatives, 21 ov 2021, The Guardian, https://www.theguardian.com/global/2021/nov/21/i-took-a-dna-test-and-found-a-whole-new-family

[3] Topor, David, Genealogy testing: Prepare for the emotional reaction, Jun 6 2018, Harvard Health Blog, https://www.health.harvard.edu/blog/genealogy-testing-prepare-for-the-emotional-reaction-2018060613990

[4] Guerrini CJ, Robinson JO, Bloss CC, Bash Brooks W, Fullerton SM, Kirkpatrick B, Lee SS, Majumder M, Pereira S, Schuman O, McGuire AL. Family secrets: Experiences and outcomes of participating in direct-to-consumer genetic relative-finder services. Am J Hum Genet. 2022 Mar 3;109(3):486-497. doi: 10.1016/j.ajhg.2022.01.013. Epub 2022 Feb 24. PMID: 35216680; PMCID: PMC8948156, https://www.ncbi.nlm.nih.gov/pmc/articles/PMC8948156/

Lee H, Vogel RI, LeRoy B, Zierhut HA. Adult adoptees and their use of direct-to-consumer genetic testing: Searching for family, searching for health. J Genet Couns. 2021 Feb;30(1):144-157. doi: 10.1002/jgc4.1304. Epub 2020 Jun 29. PMID: 32602181, https://pubmed.ncbi.nlm.nih.gov/32602181/

Roberts JS, Gornick MC, Carere DA, Uhlmann WR, Ruffin MT, Green RC. Direct-to-Consumer Genetic Testing: User Motivations, Decision Making, and Perceived Utility of Results. Public Health Genomics. 2017;20(1):36-45. doi: 10.1159/000455006. Epub 2017 Jan 10. PMID: 28068660, https://pubmed.ncbi.nlm.nih.gov/28068660/

[5] Guerrini CJ, Robinson JO, Bloss CC, Bash Brooks W, Fullerton SM, Kirkpatrick B, Lee SS, Majumder M, Pereira S, Schuman O, McGuire AL. Family secrets: Experiences and outcomes of participating in direct-to-consumer genetic relative-finder services. Am J Hum Genet. 2022 Mar 3;109(3):486-497. doi: 10.1016/j.ajhg.2022.01.013. Epub 2022 Feb 24. PMID: 35216680; PMCID: PMC8948156, https://www.ncbi.nlm.nih.gov/pmc/articles/PMC8948156/

[6] Casas KA. Adoptees’ Pursuit of Genomic Testing to Fill Gaps in Family Health History and Reduce Healthcare Disparity. Narrat Inq Bioeth. 2018;8(2):131-135. doi: 10.1353/nib.2018.0050. PMID: 30220696, https://pubmed.ncbi.nlm.nih.gov/30220696/

[7] several DNA testing companies offer communication platforms to connect with genetic matches. 

  • 23andMe offers a “DNA Relatives” feature where users can contact matches after they agree to share genome.
  • Family Tree DNA allows direct email communication with matches6.AncestryDNA provides an internal messaging system for contacting matches.
  • MyHeritage uses its own messaging system for match communication.
  • Living DNA includes a messaging system to reach out to genetic matches.

Autosomal DNA testing comparison chart, International Society of Genetic Genealogy Wiki, This page was last edited on 8 October 2024, https://isogg.org/wiki/Autosomal_DNA_testing_comparison_chart

[8] McDermott, Marc, How Do Half-Siblings Show Up on Ancestry DNA?, GenealogyExplained, 23 Dec 2022,  https://www.genealogyexplained.com/how-do-half-siblings-show-up-on-ancestry-dna/

[9] FIRs (Fully Identical Regions) are genetic segments that are shared between individuals. These regions represent areas of DNA where both chromosomal copies are identical between the compared individuals.

[10] Autosomal DNA Statistics, This page was last edited on 17 October 2022, International Society of Genetic Genealogy Wiki, https://isogg.org/wiki/Autosomal_DNA_statistics

[11] The Shared cM Project (ScP) is a collaborative data collection and analysis project that helps genealogists understand DNA relationships by documenting the ranges of shared centimorgans (cM) associated with various known family relationships. The project contains over 60,000 submissions from genealogists and provides probability estimates for different relationship types based on shared DNA amounts.

Bettinger, Blaine, Version 4.0! March 2020 Update to the Shared cM Project!, 27 Mar 2020, The Genetic Genealogist, https://thegeneticgenealogist.com/2020/03/27/version-4-0-march-2020-update-to-the-shared-cm-project/

Bettinger, Blaine & Jonny Perl, The Shared cM Project 4.0 tool v4, 26 Mar 2020, DNA Painter, https://dnapainter.com/tools/sharedcmv4

Perl, Jonny, Shared cM histograms: did you know? #3, 12 Apr 2023, DNA Painter Blog, https://blog.dnapainter.com/blog/shared-cm-histograms-did-you-know-3/

Shared cM | How Am I Related to My DNA Matches?, Your DNA Guide, https://www.yourdnaguide.com/shared-cm-project

[12] The cM test results for matches can differ between DNA companies. For example the table reflects the estimates cM values for matches between me and my half brothers based on AncestryDNA and 23andMe test results.

These cM values are based on converting the percentage of shared cM values obtained in the 23andMe atDNA test results. Since 23andMe only provides percent of shared cMs between me and Dave or greg, you need to use a conversion procedure:

There are two ways to convert 23andMe matches to centimorgans (cM), you can use the Shared cM Project tool at DNA Painter:

  1. Go to the Shared cM Project tool at DNA Painter
  2. Enter the percentage of shared DNA in the percentage box
  3. The tool will show you the cMs

Bettinger, Blaine,, The Shared cM Project 4.0 Tool v4, Mar 2020, DNA Painter, https://dnapainter.com/tools/sharedcmv4

You can also use a ‘quick and dirty’ approach to convert the percentage into centimorgans by just multiplying your percentage by 68.

Cooke, Lisa, What’s a CentiMorgan, Anyway? How DNA Tests for Family History Measure Genetic Relationships, 23 Oct 2017, Genealogy Gems,  https://lisalouisecooke.com/2017/10/23/genetic-relationships-centimorgans/

Fully identical region, This page was last edited on 1 April 2022, International Society of Genetic Genealogy Wiki, https://isogg.org/wiki/Fully_identical_region

Estes, Roberta, Pedigree Collapse and DNA – Plus an Easy-Peasy Shortcut, 31 Jan 2024, DNAeXplained – Genetic Genealogy, https://dna-explained.com/category/fully-identical-regions/

Hill-Burns, Erin, How much DNA in FIRS(Fully Identical Regions) do relatives share?, Genes & History, https://genesandhistory.wordpress.com/2019/12/04/how-much-dna-in-firs-fully-identical-regions-do-relatives-share/

DNA Geek, AncestryDNA Is Using FIRs to Distinguish Full and Half Siblings, 7 Feb 2019, TheDNAGeek, https://thednageek.com/ancestrydna-is-using-firs-to-distinguish-full-and-half-siblings/

SegcM | DNA Science, Relationship predictions that use both the # of segments and total cMs https://dna-sci.com/tools/segcm/ 

DNA-Sci, Segments Matter! , 3 Feb 2023, DNA Science Blog, https://dna-sci.com/2023/02/03/segments-matter/

[13] McDermott, Marc, How Do Half-Siblings Show Up on Ancestry DNA?, GenealogyExplained, 23 Dec 2022,  https://www.genealogyexplained.com/how-do-half-siblings-show-up-on-ancestry-dna/

What is the best test for showing that two people are half siblings? 7 Jan 2016, The Tech Interactive, https://www.thetech.org/ask-a-geneticist/articles/2016/best-half-sibling-dna-test/

Estes, Roberta, Full or Half Siblings?, 3 Apr 2019, DNAeXplained – Genetic Genealogy, https://dna-explained.com/2019/04/03/full-or-half-siblings/

[14] McDermott, Marc, How Do Half-Siblings Show Up on Ancestry DNA?, GenealogyExplained, 23 Dec 2022,  https://www.genealogyexplained.com/how-do-half-siblings-show-up-on-ancestry-dna/

Stocker CM, Gilligan M, Klopack ET, Conger KJ, Lanthier RP, Neppl TK, O’Neal CW, Wickrama KAS. Sibling relationships in older adulthood: Links with loneliness and well-being. J Fam Psychol. 2020 Mar;34(2):175-185. doi: 10.1037/fam0000586. Epub 2019 Aug 15. PMID: 31414866; PMCID: PMC7012710. https://pmc.ncbi.nlm.nih.gov/articles/PMC7012710/

Segments Matter!

[15] Baby Scoop Era, Wikipedia, This page was last edited on 22 October 2024,, https://en.wikipedia.org/wiki/Baby_Scoop_Era

[16] Solinger, Rickie, Wake Up Susie: Single Pregnancy and Race Before Roe v. Wade, New York: Routledge, 2000, Page 102

[17] The Comstock Act of 1873 severely restricted access to birth control in the United States through several key measures. It criminalized mailing or distributing any contraceptive devices or information about contraception. Imposed harsh penalties including fines of $100-$5,000 and imprisonment of 1-10 years for violations. Led to thousands of arrests and the destruction of hundreds of tons of books and educational materials about contraception.

The Comstock Act prevented women from accessing information about their reproductive health and pregnancy prevention options. It banned doctors and social reformers from providing contraceptive information to patients. State-level “Comstock laws” further expanded restrictions on contraception, with some states like Connecticut completely banning birth control use. The Comstock Act’s restrictions on contraception remained technically in effect until 1971, when Congress finally removed the language related to contraceptives from the law.

Wexler, Ellen, The 150-Year-Old Comstock Act Could Transform the Abortion Debate, 15 Jun 2023, Smithsonian Magazine, https://www.smithsonianmag.com/history/comstock-act-transform-abortion-debate-180982363/

Comstock act, Women & the American Story, The New York Historical, https://wams.nyhistory.org/industry-and-empire/fighting-for-equality/comstock-act/

Birth control in the United States, Wikipedia, This page was last edited on 12 November 2024, https://en.wikipedia.org/wiki/Birth_control_in_the_United_States

Comstock Act of 1873 Wikipedia, This page was last edited on 15 November 2024, https://en.wikipedia.org/wiki/Comstock_Act_of_1873

[18] A Timeline of Contraception, American Experience, PBS, https://www.pbs.org/wgbh/americanexperience/features/pill-timeline/

Birth control in the United States, Wikipedia, This page was last edited on 12 November 2024, https://en.wikipedia.org/wiki/Birth_control_in_the_United_States

[19] Gibson, Megan, One Factor That Kept the Women of 1960 Away From Birth Control Pills: Cost, 23 Jun 2015, Time, https://time.com/3929971/enovid-the-pill/

See also:

A Timeline of Contraception, American Experience, PBS, https://www.pbs.org/wgbh/americanexperience/features/pill-timeline/

From Acacia to IUDs: The History of Birth Control in the United States, HealthLine, https://www.healthline.com/health/birth-control/history-of-birth-control

[20] Gold, Rachel Benson, Lessons from Before Roe: Will Past be Prologue?, Volume 6, Issue 1, Guttmacher Policy Review, 1 Mar 2003, https://www.guttmacher.org/gpr/2003/03/lessons-roe-will-past-be-prologue

Paintin, D. (1998). A Medical View of Abortion in the 1960s. In: Lee, E. (eds) Abortion Law and Politics Today. Palgrave Macmillan, London. https://doi.org/10.1007/978-1-349-26876-4_2

[21] Herman, Ellen. “The Paradoxical Rationalization of Modern Adoption.” Journal of Social History, 36, no. 1 (Winter 2002): 339-385. 

Herman, Ellen. Kinship by Design: A History of Adoption in the Modern United States of America. Chicago: University of Chicago Press, 2008. 

[22] Owens, Rudy, Number of Adoptees Relinquished: 1944-1975,  , You Don’t Know How Lucky You are, https://www.howluckyuare.com/numbers-adoptees-relinquished-1944-1975/
[23] National Florence Crittenton Mission, Wikipedia, This page was last edited on 17 February 2024, https://en.wikipedia.org/wiki/National_Florence_Crittenton_Mission

Florence Crittenton Mission, VCU Libraries, Social Welfare History Project, Virginia Commonwealth University, https://socialwelfare.library.vcu.edu/programs/child-welfarechild-labor/florence-crittenton-mission/

[24] Illegitimate Births in Vital Statistics of the United States,1960, Volume I – Natality, Pages l-12 and l-13. https://www.cdc.gov/nchs/data/vsus/nat60_1.pdf

Penelope L. Maza, “Adoption Trends: 1944-1975”, Child Welfare Research Notes No. 9, U.S. Children’s Bureau, August 1984

Franks, Julia, The American History Behind the Novel ‘The Say So’, Illegitimate Pregnancies, http://www.juliafranks.com/the-say-so-the-history

See also:

Bernstein, Rose. “Unmarried Parents,” Encyclopedia of Social Work. Issue 5. New York National Association of Social Workers, 1965, p. 797

Shlakman, Vera. “Unmarried Parenthood: An Approach to Social Policy.” Social Casework, vol. 42, October 1966, p. 494

Solinger, Rickie. Wake Up Little Susie: Single Pregnancy and Race Before Roe V. Wade, 2nd edition, Routledge, 2000

Moriguchi, Chiaki. (2012). The Evolution of Child Adoption in the United States, 1950-2010: An Economic Analysis of Historical Trends, Discussion Paper Series A No.572, June 2012, https://www.researchgate.net/publication/254420379_The_Evolution_of_Child_Adoption_in_the_United_States_1950-2010_An_Economic_Analysis_of_Historical_Trends

[25] Franks, Julia, The American History Behind the Novel ‘The Say So’, Illegitimate Pregnancies, http://www.juliafranks.com/the-say-so-the-history

[26] Owens, Rudy, Number of Adoptees Relinquished: 1944-1975,  , You Don’t Know How Lucky You are, https://www.howluckyuare.com/numbers-adoptees-relinquished-1944-1975/
Autosomal DNA Tests: Estimating Genetic Relationships and Discovering Relatives

In prior posts, I discussed the utility of Y-DNA tests as a possible avenue to gain insights and possible leads on identifying information about tracing the lineage associated with family surnames for the Griffis(ith)(es) family. [1] I have not discussed my experience of using autosomal DNA tests for genealogical and family research.

There are perhaps two unique things that atDNA tests can provide. They can:

  • identify unknown living relatives and their possible relationships; and
  • identify a possible relationship of a common ancestor that you share with a living relative.

My experience with atDNA tests have largely resulted in the initial discovery of many living third to fifth generational cousins. However, all of these distant cousins fail to document their respective lines of descent in various DNA company databases. The lack of this additional genealogical information makes it difficult to document where our common distant family connections are located.

A few of the genetic connections from the atDNA tests have provided documentation on common family connections. Based on their information, I have been able to identify a few distant connections. On two other occasions, I have discovered two half brothers.

This three part story focuses on the merits and limitations as well as my personal experience of using autosomal DNA (atDNA) tests for documenting genetic kinship ties in the Griffis family. This part provides general background to make sense of the DNA results. The second part of the story discusses my ongoing DNA discoveries from these tests. As such, the information can change in the future. The third part is devoted to my profound discovery of having two half siblings David and Greg.

General Comparison of DNA Tests

Depending on the DNA test, they tell you how much of their DNA you have inherited from unspecified ancestors on each side of your family or how far back you can trace genetic lineages through a maternal or paternal line. Genetic genealogy or results from DNA tests do not tell you where each member on your family tree lived or provide information on their specific family relationships.

DNA results can identify matches of living individuals and their possible shared kinship relationships. These estimates are based on the amount of shared DNA segments between the match and you. When it comes to identifying specific individuals and verifying kinship relationships, traditional genealogical research is typically required for interpretation of the results. [2]

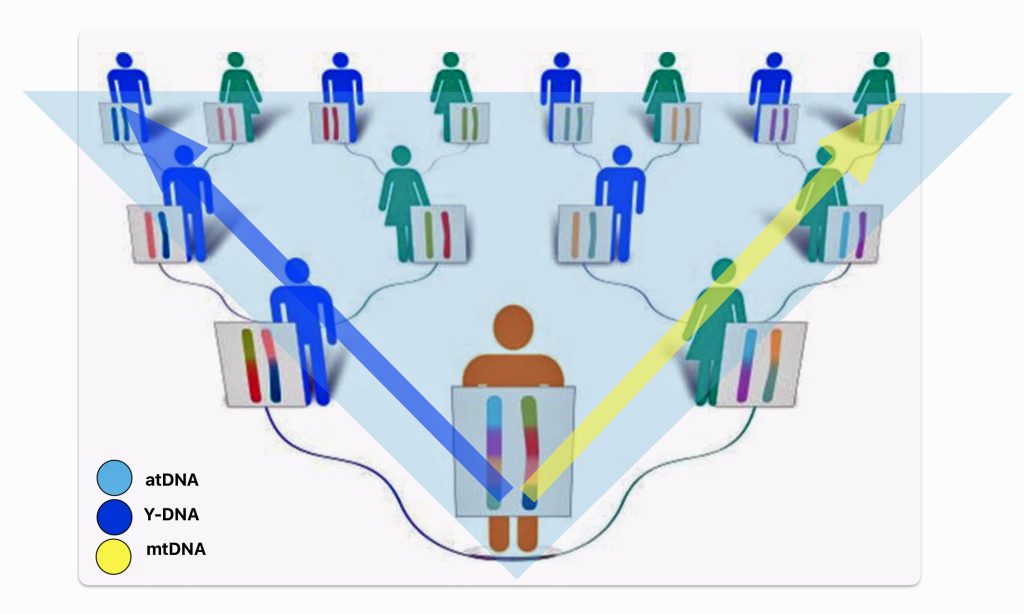
There are basically three types of genetic tests used in genealogical research. Autosomal ancestry (atDNA), Y-DNA, and mitochondrial DNA (mtDNA) tests (see illustration one below). Autosomal tests can analyze a broader range of genetic family network ties than the Y-DNA or mtDNA tests. Y-DNA and mtDNA tests respectively trace the paternal and maternal sides of one’s genetic history. The atDNA tests are broader in their ability to trace genetic relatives on both sides of your family tree. However, their effectiveness of tracing ancestors is limited in terms of how many generations back they can effectively provide results. Another unique characteristic of the atDNA tests is matching living test takers through the amount of shared autosomal DNA.

Illustration One: Three Types of DNA Tests

Click for Larger View | Source: Modified version of an image found at Edward Sweeney, Types of DNA Test, MacDugall DNA Research Project, https://macdougalldna.org/types-of-dna-test-b/

As indicated in table one, while limited to the paternal line of descent, Y-DNA tests can effectively track male genetic descendants back around 300,000 years. Mitochondrial testing of the matrilineal line can also provide results that go back over 140 thousands of years. The popular atDNA ‘ethnicity’ tests can trace back through a limited number of generations. While women have two X chromosomes, DNA testing of the X-DNA is usually tested along with other chromosomes as part of an atDNA test. [3]

Table 1: Type of DNA Testing

CharacteristicAutosomal
DNA (atDNA)
Y – DNA (YDNA)Mitochondrial
DNA (mtDNA)
What does it test?All autosomal chromosomesY chromosomeMitochondria
Available toBoth males and
females
Only males can
take test
Both males and
females
How far back?5 – 9 generations~155,000 Years~200,000+ years
Source of TestingAutosomal
Chromosomes
Y ChromosomeX Chromosom
found in Mitochondria
What genealogical lines tested?All ancestry linesOnly Paternal (father’s
father’s father, etc)
Maternal (mother’s
mother’s mother, etc.)
Benefits – utilityFinding relatives within
a few generations, determining broader
ethnicity estimations,
identifying potential
matches across both sides
Tracing direct
paternal lines, surnames,
identifying specific
paternal lineages and haplogroups,
studying deep paternal ancestry
Tracing a direct
maternal line,
identifying maternal haplogroups,
analyzing ancient
ancestry patterns
Available from
the following
companies:
– ancestry.com
– Family Tree DNA
– 23andMe
– Myheritage
– Living DNA
– Family Tree DNA
– 23andME (high level)
– YSEQ
– Full Genome Corp
– Family Tree DNA
– 23andMe
– YSEQ
– Full Genome Corp

Autosomal DNA tests are useful for finding relatives, such as unknown relatives, clarifying uncertain family relationships and identifying distant relatives. Typically DNA companies identify matches up to six generations. The Y-DNA and mtDNA tests, while limited to only tracing paternal lines or maternal lines respectively, can trace genetic lineage back over 150,000 years.

Popularity of Autosomal DNA Tests

“For about a hundred dollars, it is now possible to spit into a tube, drop it in the mail, and within a couple of months gain access to a list of likely relatives. If you have any colonial American ancestors, the first thing you realize, taking a DNA test for genealogical purposes, is that potential sixth cousins are a whole lot easier to come by than you ever imagined. Even fifth cousins — people with whom you share a fourth great-grandparent — aren’t a particular scarcity.” [4]

These tests provide information about an individual’s ancestral roots, and they can help to connect people with their relatives, sometimes as distantly related as fourth or fifth cousins. Such information can be particularly useful when a person does not know their genealogical ancestry (eg. many adoptees and the descendants of forced migrants). [5]

The direct-to-consumer genetic testing market has shown significant growth in recent years, but there are indications of a recent slowdown in sales in 2023.

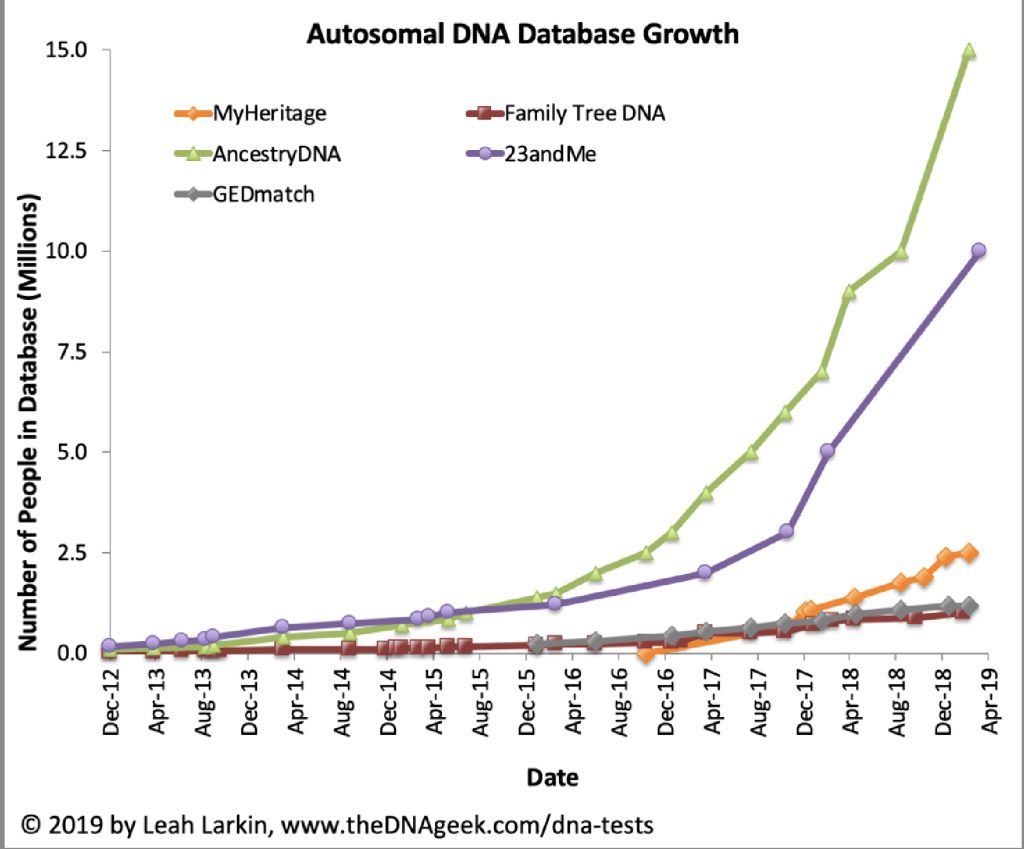
As many people purchased consumer DNA tests in 2018 as in all previous years combined. [6] Combined with prior years of personal consumer testing, more than 26 million consumers had added their DNA to ostensibly four leading commercial ancestry and health databases.

Chart One: atDNA Database Growth

Click for Larger View | Source: 23andMe Has More Than 10 Million Customers, April 8, 2019, The DNA Geek Blog, https://thednageek.com/23andme-has-more-than-10-million-customers/

In late 2019, there were signs of declining sales. Ancestry and 23andMe saw drops in direct website sales of 38% and 54% respectively compared to 2018. [7]

“Less than five years ago, consumer DNA tests were being hailed as the innovative technology of the future—but today, declining sales have forced several companies in the field to scale back their workforces and adjust their business strategies.” [8]

Market data from DNA companies suggest that the market continues to grow, albeit at a slower rate than the initial boom years. Projections include all type of DNA tests (e.g. genetic relatedness, ancestry, lifestyle wellness, reproductive health, personalized medicine, sports nutrition, reproductive health, diagnostics and others). Factors like market saturation among early adopters and privacy concerns may be contributing to the moderation in growth rates.

Despite the decade-long rise in sales, in 2020 there was a sudden decline in interest. Two of the leading companies, 23andMe and AncestryDNA, experienced declines in sales of DNA ancestry kits of 54 and 38 percent, respectively. The decline was attributed to market saturation, economic recession related to the COVID-19 pandemic, and privacy concerns. [9]

Since 2021, 23andMe, a prominent direct-to-consumer genetic testing company, has faced significant financial challenges that have raised concerns about its future and the security of customer data. The company’s financial situation has deteriorated rapidly. Its stock price has plummeted, losing over 97% of its value since going public in 2021. 23andMe is reportedly on the verge of bankruptcy and has never turned a profit.  In 2023, the company suffered a major data breach affecting nearly 7 million users. The company has had turnover of board members and internal dissension between board members and executive management. [10]

This situation surrounding 23andMe serves as a cautionary tale about the risks associated with entrusting sensitive genetic information to private companies and highlights the need for robust data protection measures in the rapidly evolving field of consumer genomics. It also underscores the need to have back up contingencies of one’s DNA data. [10a]

What do atDNA Tests Measure?

Autosomal DNA tests basically measure five things.

  1. Genetic Markers: atDNA tests look at hundreds of thousands of genetic markers in a DNA sample called single nucleotide polymorphisms (SNPs) across the 22 autosomal chromosome pairs. More on SNPs later in this story. These sampled SNPs represent DNA sequences that can be used to efficiently identify genetic differences and similarities between individuals.
  2. Inheritance Patterns: The tests examine the autosomal DNA inherited from both parents, which includes genetic contributions from all recent ancestors. This allows for connections to be made with relatives on all “recent” branches of a family tree, not just direct paternal or maternal lines in the past six or so generations.
  3. Genetic Relatives: The tests identify shared DNA segments between the test taker and other individuals in the DNA test company’s database, allowing for the discovery of genetic relatives that are living and linking each matched DNA tester to past generations.
  4. Ethnicity Estimates: By comparing an individual’s genetic markers to reference populations maintained by a DNA test company, autosomal DNA tests can provide estimates of a person’s ancestral origins and ethnic background.
  5. Health Traits: Many atDNA testing companies also include screening for certain inherited health conditions or physical traits that can play in one’s life to identify certain genetic code that could affect health.

The Genetic Influence of Autosomal DNA

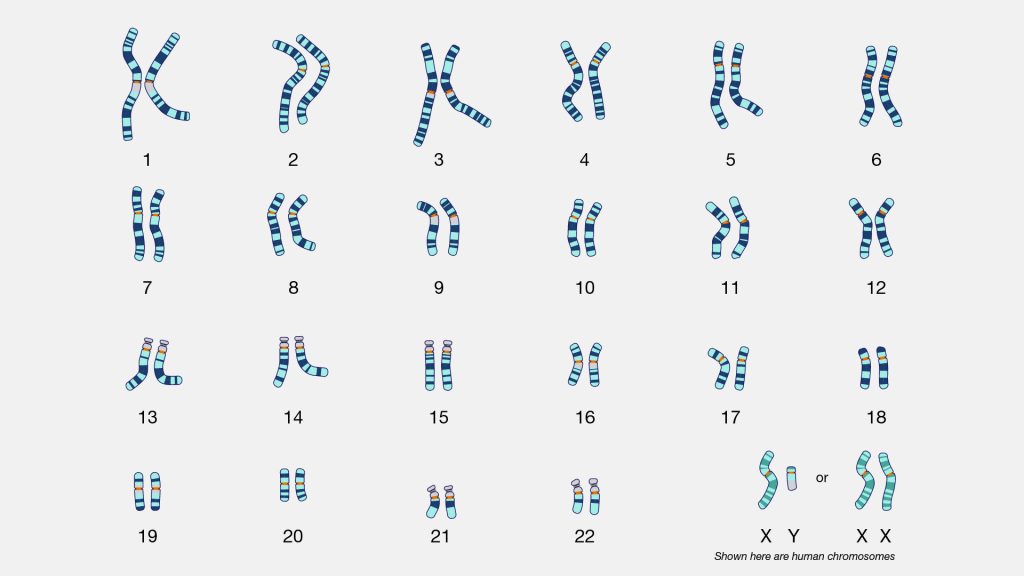
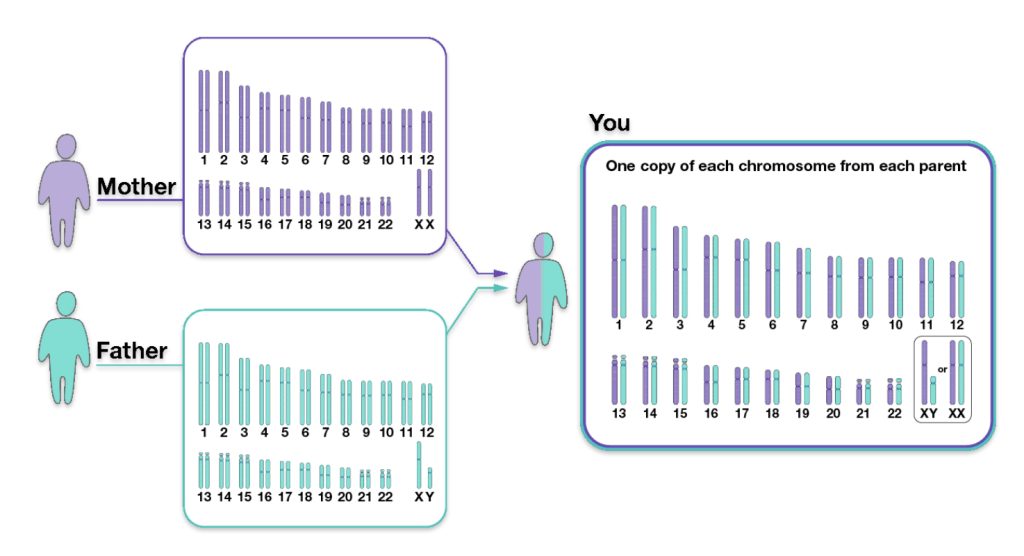
An atDNA test is a measurement of sampled parts of your 22 autosomal chromosomes. Everyone (with rare exceptions) is born with a set of 23 pairs of chromosomes. The twenty-third chromosome is the sex chromosome. In most cases, we inherit an X chromosome from our mother and a Y or X chromossome from our father to determine our sex differentiation. (See illustration two).

Illustration Two: Karyotype of Human Chromosomes [11]

Click for Larger View | Source: Karyotype, National Genome Human Genome Research Institute, https://www.genome.gov/genetics-glossary/Karyotype

We inherit half of our chromosomes from our mother and the other half from our father. Two of those pairs are usually sex chromosomes (for most cases, XX in females and XY in males). The remaining 22 pairs of chromosomes are autosomal chromosomes or autosomes. For example, as illustrated below, chromosomes from the depicted mother are labeled in purple, and chromosomes from the depicted father are labeled in teal. (See illustration three).  [12]

Illustration Three: Inheritance of Parental Chromosomes

Click for Larger View| Source: Human Genomic Variation, Fact Sheet, National Human Genome Research Institute, 1 Feb 2023, https://www.genome.gov/about-genomics/educational-resources/fact-sheets/human-genomic-variation

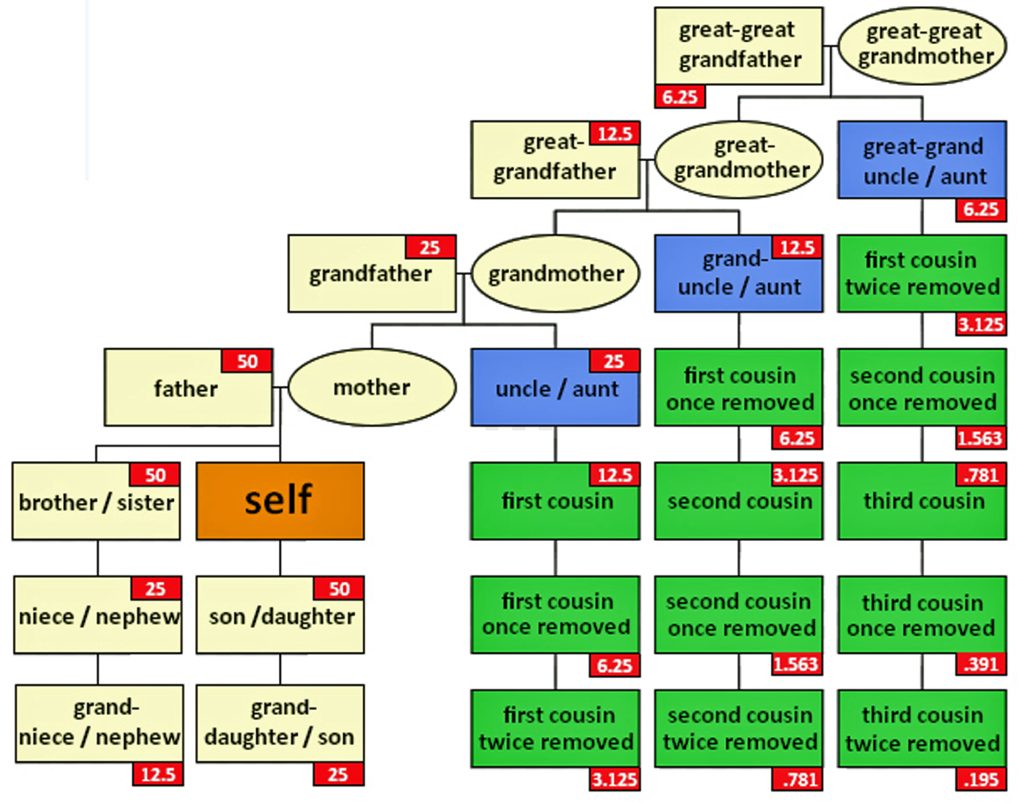
The genetic inheritance patterns associated with autosomal chromosomes become more complex and diluted over generations due to recombination and variable inheritance patterns. [13] Illustration four shows the average amount of atDNA inherited by all close relations up to the third cousin level. The illustration uses the maternal side as a an example. The percentages can be replicated for the paternal side. [14] As reflected in the chart, fifty percent of one’s atDNA is inherited from each parent and roughly equally portions from grandparents to about 3x great-grandparents. 

Illustration Four: Percent of Autosomal Genetic Inheritance from Descendants

Click for Larger View | Source: Dimario, A chart illustrating the different types of cousins, including genetic kinship marked within boxes in red which shows the actual genetic degree of relationship (gene share) with ‘self’ in percentage (%), 27 April 2010, Wikimedia Commons, https://commons.wikimedia.org/wiki/File:Cousin_tree_(with_genetic_kinship).png

During meiosis [15], genetic recombination occurs, shuffling segments of DNA from each of the parents. This means that siblings may inherit different combinations of DNA segments from their parents; and with each generation, the specific segments inherited become more randomized. As a result, the amount of shared DNA between relatives decreases exponentially with each generation, making it more challenging to detect distant relationships through autosomal testing.

The random nature of genetic inheritance leads to variability in how much DNA is shared between relatives, especially for more distant relationships. This is known as variable expressivity. [16] For example, as indicated in table two, full siblings may share anywhere from about 35% to 65% of their DNA; and first cousins typically share around 12.5% of their DNA, but the actual range can vary significantly. This variability increases with more distant relationships, making it harder to precisely determine the degree of relatedness based solely on shared DNA percentages (see table two).  [17]

Table Two: Average Percent of Autosomal DNA Shared Between Selected Relatives

RelationshipAverage Percent
of DNA Shared
Range of DNA
Shared
Identical Twin100%N/A
Parent-Child50% (but 47.5% for father-son relationships)N/A
Full Sibiling50%38% – 61%
Half Sibling
Grandparent / Grandchild
Aunt / Uncle
Niece / Nephew
25%17% – 34%
1st Cousin
Great-grandparent
Great-grandchild
Great-Uncle / Aunt
Great Nephew / Niece
12.5%4% – 23%
1st Cousin once removed
Half first cousin
6.25%2% – 11.5%
2nd Cousin3.13%2% – 6%
2nd Cousin once removed
Half second cousin
1.5%0.6% – 2.5%
3rd Cousin0.78%0% – 2.2%
4th Cousin0.20%0% – 0.8%
5th Cousin
to Distant Cousin
0.05%
Source: Average Percent DNA Shared Between Relatives, 23andMe Customer Care, Tools, 23andMe, https://customercare.23andme.com/hc/en-us/articles/212170668-Average-Percent-DNA-Shared-Between-Relatives

While autosomal DNA testing has become increasingly accurate, there are still limitations in the context of estimating genetic relations and finding relatives. Current testing methods typically analyze only a subset of genetic markers. In addition, the interpretation of results relies on comparison to reference populations, which may not fully represent all ancestral groups. In the end, as previously stated, traditional genealogical research brings atDNA results into focus.

Genetic Variants: The Genetic Basis of atDNA Testing

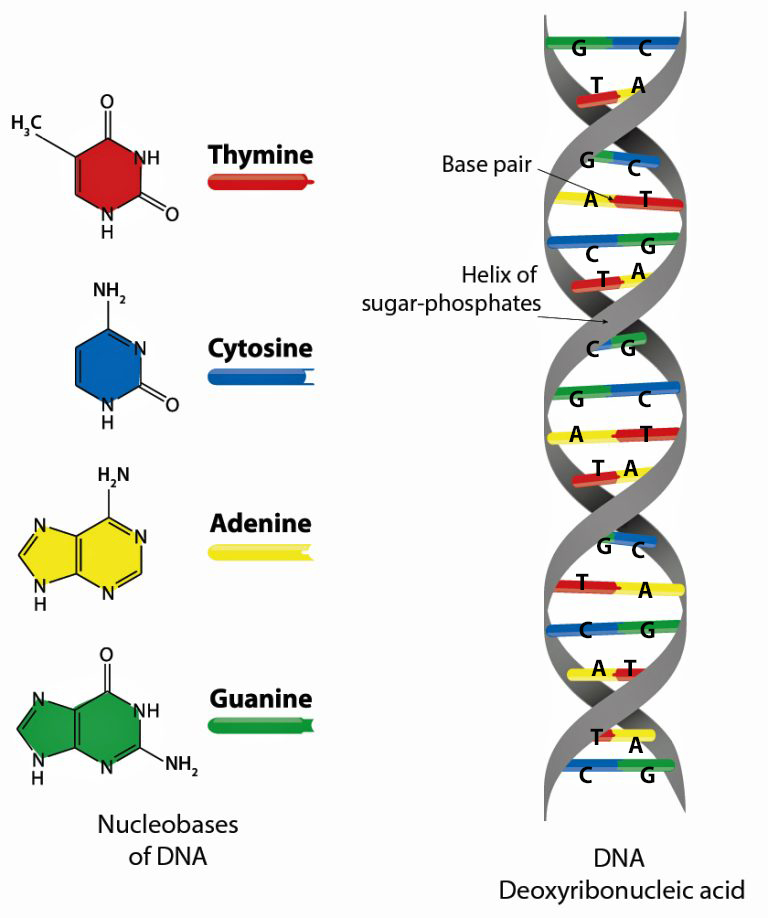
genome is the complete set of DNA instructions found in every cell. [18] As discussed in a prior story, the human cell is a masterpiece of data compression. [19] Its nucleus, just a few microns wide, contains (if you ‘spell’ it out) six feet of genetic code comprised in a double helix called the DNA: deoxyribonucleic acid (see illustration five).

Illustration Five: Structure of Deoxyribonucleaic Acid (DNA)

Source: Modified image of DNA as found in Ruairo J Mackenie, DNA vs. RNA – 5 Key Differences and Comparison, 18 Dec 2020, updated 24 Jan 2024, Technology Networks, Genomics Research, https://www.technologynetworks.com/genomics/lists/what-are-the-key-differences-between-dna-and-rna-296719

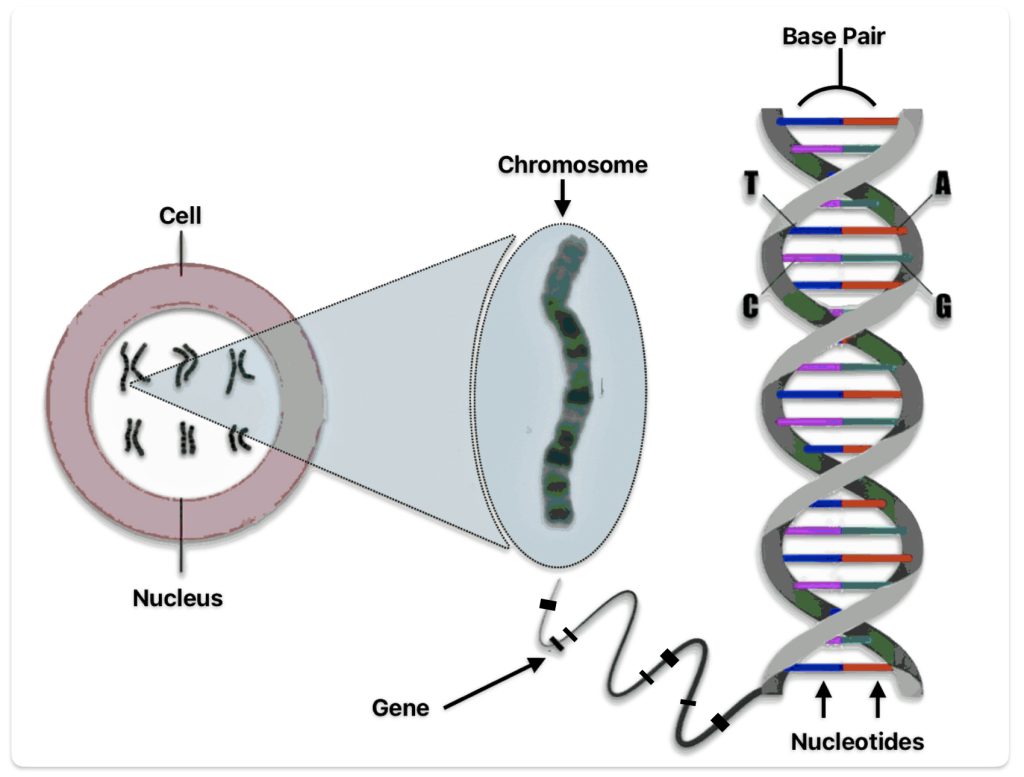
The DNA helical molecules string together some three billion pairs of nucleotides that are comprised of proteins, sugar (deoxyribose), a phosphate and four types of nitrogenous bases which are represented by an initial: A (adenine), C (cytosine), G (guanine), and T (thymine). Nucleotides are the fundamental building blocks that make up the DNA strands. The sequence of nucleotides along the DNA strand encodes genetic information and regulates when codes are activated. [20]

The nucleotides form base pairs and are the cornerstone of genetic testing. (See illustration six.) They are the foundation of the programming language of our genetic code. Whenever a particular base is present on one side of a strand of the DNA, its complementary base is found on the other side. Guanine always pairs with cytosine. Thymine always pairs with adenine. So one can write the DNA sequence by listing the bases along either one of the two sides or strands. When DNA companies perform their tests, they essentially separate the two stands of the helix and use one side of the helix as the template or coding strand when they map out an individual’s DNA results.

Illustration Six: Relationship between Nucleotides, Base Pairs, Chromosomes, Genes, and DNA

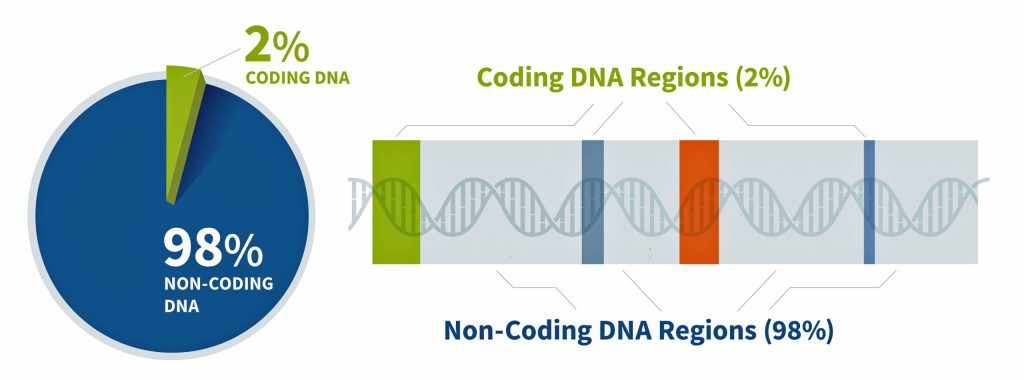
Approximately 2% of our genome encodes proteins – this is where gene strands are located (illustration seven).  Coding “gene” DNA makes up only about one to three percent of the human genome, while noncoding DNA comprises approximately 97-99% of our total genetic material. This distribution shows that the vast majority of our genome consists of noncoding sequences. [21]

Genes are the basic unit of inherited DNA and carry information for making proteins, which perform important functions in your body. The coded regions of the genome produce proteins with structural, functional, and regulatory roles in cells and to a larger extent the human body. The remainder of our genome is made of noncoding DNA, sometimes called “junk DNA”, which is a misnomer. It is estimated that between 25% and 80% of non-coding DNA regulates gene expression (e.g. when, where, and for how long a gene is turned on to make a protein). [22] The non-coding DNA that does not regulate gene activity is composed either of deactivated genes that were once useful for our non-human ancestors (like a tail) or parasitic DNA from virus that have entered our genome and replicated themselves hundreds or thousands of times over the generations, or generally serve no purpose in the host organism.

Illustration Seven: Coding and Non-Coding Regions of the Genome

Clck for Larger View | Source: Modified version of graphic found at – Non-Coding DNA, AncestryDNA Learning Hub, https://www.ancestry.com/c/dna-learning-hub/junk-dna

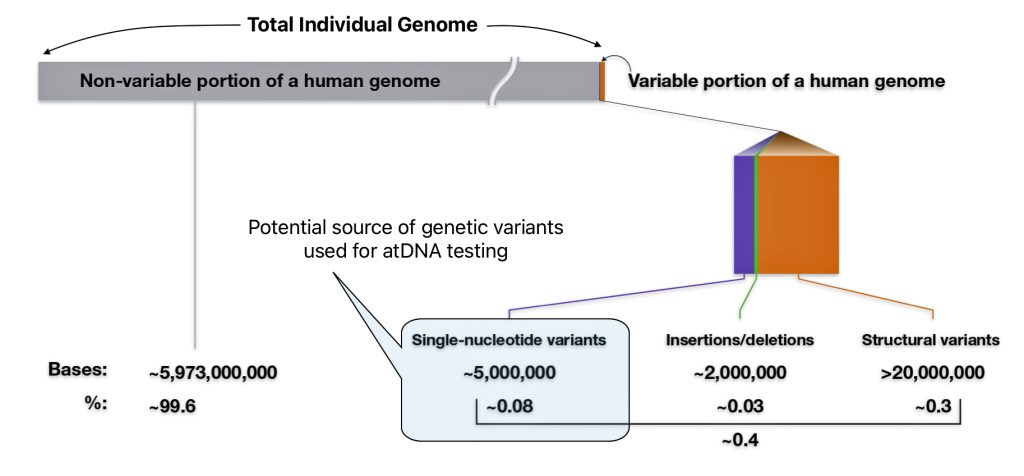
Out of 3.2 billion DNA letters or nucleotides, there are only a ‘handful of places’ on the DNA ribbon that might be different between individuals. Humans share a very high percentage of their DNA. The exact figure is subject to some debate and depends on how it is measured. The commonly cited figure is that humans are 99.9% genetically identical. More recent research suggests a slightly lower, but still very high, level of similarity. Humans share a very high percentage of their DNA – roughly 99.4% to 99.9%. The small differences of 0.1 and 0.6 between individuals are crucial for understanding human diversity and health. [23]

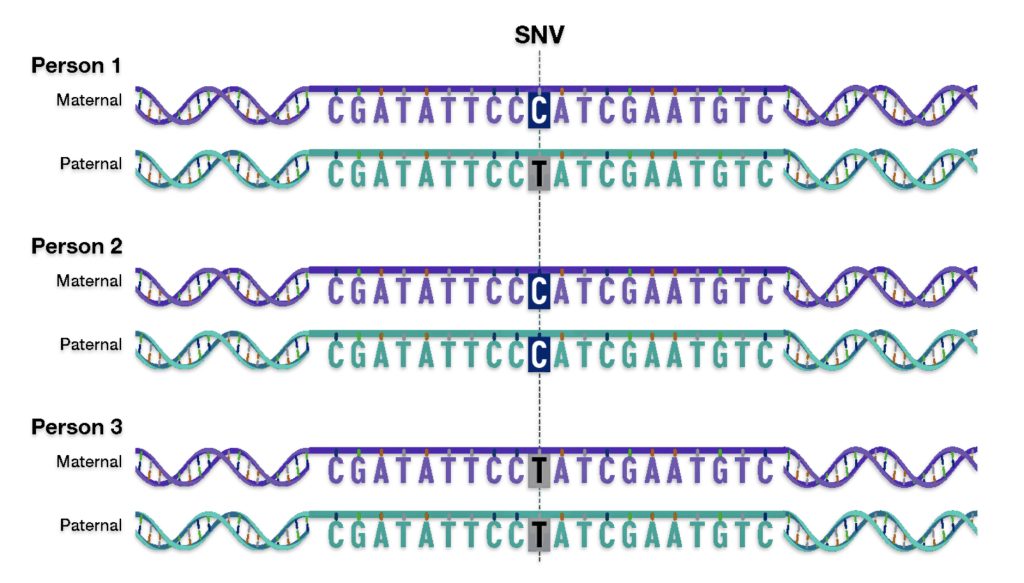
As indicated in illustration eight, there are multiple types of genomic variants that comprise 0.4 percent of the genome.. The smallest genomic variants are known as single-nucleotide variants (SNVs). Each SNV reflects a difference in a single nucleotide (or letter) in the DNA chain. For a given SNV, the DNA letter at that genomic position might be a C in one person but a T in another person as reflected in illustration nine. [24]

Illustration Eight: Potential Sources of Genetic Variants for atDNA Testing

Click for Larger View | Source: Modification of a chart found at – Chart Human Genomic Variation, Fact Sheet, National Human Genome Research Institute, 1 Feb 2023, https://www.genome.gov/about-genomics/educational-resources/fact-sheets/human-genomic-variation

Single-nucleotide variants (SNVs) are differences of one nucleotide at a specific location in the genome. An individual may have different nucleotides at a specific location on each chromosome (getting a different one from each parent), such as with Person 1 in illustration nine. An individual may also have the same nucleotide at such a location on both chromosomes, such as with Person 2 and Person 3 in the illustration.

Illustration Nine: An Example of a single-nucleotide variant (SNV)

Click for Larger View | Source: Human Genomic Variation, Fact Sheet, National Human Genome Research Institute, 1 Feb 2023, https://www.genome.gov/about-genomics/educational-resources/fact-sheets/human-genomic-variation

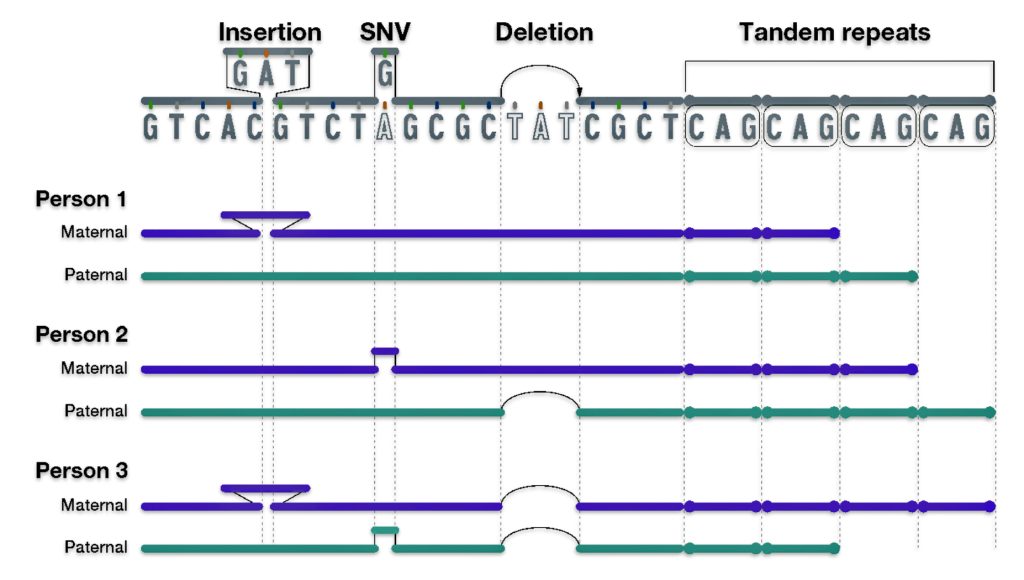
As reflected in illustration ten below, there are also a small group of genetic variants that are called insertions and deletions of nucleotides.

“Insertion/deletion variants reflect extra or missing DNA nucleotides in the genome, respectively, and typically involve fewer than 50 nucleotides. Insertion/deletion variants are less frequent than SNVs but can sometimes have a larger impact on health and disease (e.g., by disrupting the function of a gene that encodes an important protein).” [25]

One of the most common types of insertion/deletion variants are tandem repeats. [26] Tandem Repeats are short stretches of nucleotides that are repeated multiple times and are highly variable among people. Different chromosomes can vary in the number of times such short nucleotide stretches are repeated, ranging from a few times to hundreds of times.

Each person has a collection of different genomic variants. For example, in illustration ten below, Person 1 has an insertion variant; Person 2 has a SNV and deletion variant; and Person 3 has an insertion, SNV, and deletion variant. All three people have different tandem repeats. Different variants can be inherited from different parents as reflected in the illustration.

Illustration Ten: Examples of Other Types of Genetic Variants

Click for Larger View | Source: Human Genomic Variation, Fact Sheet, National Human Genome Research Institute, 1 Feb 2023, https://www.genome.gov/about-genomics/educational-resources/fact-sheets/human-genomic-variation

As indicated in illustration seven above, the third general type of genomic variations are structural variants (SVs). Structural variants extend beyond small stretches of nucleotides to larger chromosomal regions. These large-scale genomic differences involve at least 50 nucleotides and as many as thousands of nucleotides that have been inserted, deleted, inverted or moved from one part of the genome to another. [27]

Tandem repeats that contain more than 50 nucleotides are considered structural variants. In fact, such large tandem repeats account for nearly half of the structural variants present in human genomes. When a structural variant reflects differences in the total number of nucleotides involved, it is called a copy number variant (CNV). CNVs are distinguished from other structural variants, such as inversions and translocations, because the latter types often do not involve a difference in the total number of nucleotides. [28]

Cornerstone of atDNA Testing: Single Nucleotide Polymorphisms (SNPs)

A subtype of SNVs is the single-nucleotide polymorphism (SNP), pronounced as “snip” for short. To be considered a SNP, a SNV must be present in at least 1% of the human population. As such, a SNP is more common than the rare single-nucleotide differences.  [29]

Among the genetic variants, SNPs are relatively common, occurring approximately once every 500-1000 base pairs in the human genome. This translates to about 4 to 5 million SNPs in an individual’s genome. Scientists have found more than 600 million SNPs in populations around the world. The combination of technical feasibility, scientific reliability, and analytical power makes SNPs the optimal choice for autosomal DNA testing in genealogical and ancestry applications. [30]

Ancestry information markers refers to locations in the genome that have varied sequences at that location and the relative abundance of those markers differs based on the continent from which individuals can trace their ancestry. So by using a series of these ancestry information markers, sometimes 20 or 30 more, and genotyping an individual you can determine from the frequency of those markers where their great, great, great, great ancestors may have come from. [31]

SNPs represent natural variations that make individuals unique while being common enough to be reliable DNA test markers. Their high frequency makes them ideal markers for genetic analysis. The vast majority of SNPs have no effect on health or development. SNPs are generally found in the DNA between genes rather than within genes themselves. [32]

While other genetic markers exist, SNPs are preferred ancestry information markers. SNPs are used for genetic testing based on their reliability and accuracy. SNPs are stable genetic markers that are passed down through generations. SNPs offer more detailed information about both recent and ancient ancestry. They also allow for fairly precise ethnic profiling and ancestral location inference.[33]

How atDNA Tests Figure Out Genetic Relationships

In a “Nutshell”: How do DNA companies Figure Out Genetic Relationships

Analyzing SNPs: DNA companies analyze hundreds of thousands of single nucleotide polymorphisms (SNPs) across the 22 autosomal chromosomes. [34]

The results from different atDNA test companies can vary. The variance is based on a number of factors. All major DNA testing companies use equipment that analyze DNA specimens with what are called ‘chips’ that use DNA microarray technology supplied by a company named Illumina. However, different companies use different versions of the Illumina chip and each version tests different sets of SNP (Single Nucleotide Polymorphism) locations.

Illustration Ten: How DNA Microarray Technology Analyzes Autosomal DNA

Source: Bergström, Ann-Louise and Lasse Folkersen , DNA microarray, 15 May 2020, Moving Science, https://movingscience.dk/dna-microarray/

Companies can specify their own “other” locations to be included on their chip. The number of markers tested varies significantly by company. FamilyTreeDNA uses a customized Illumina chip. 23andMe and AncestryDNA use a customized Illumina Global Screening Array (GSA) chip. Living DNA uses an Affymetrix Axiom microarray (Sirius) chip. My Heritage uses an Illumina GSA chip. [35]

Illustration of Illumina Microarray Chips

Source: Web Graphic Array with GE Inserts, Illumina, Powerfully Informative Microarrays, Illumina,https://www.illumina.com/techniques/microarrays.html

“Each DNA testing company purchases DNA processing equipment. Illumina is the big dog in this arena. Illumina defines the capacity and structure of each chip. In part, how the testing companies use that capacity, or space on each chip, is up to each company. This means that the different testing companies test many of the same autosomal DNA SNP locations, but not all of the same locations. … This means that each testing company includes and reports many of the same, but also some different SNP locations when they scan your DNA. …  In addition to dealing with different file formats and contents from multiple DNA vendors, companies change their own chips and file structure from time to time. In some cases, it’s a forced change by the chip manufacturer. Other times, the vendors want to include different locations or make improvements.” [36]

When DNA companies change DNA chips, a different version of the company’s own file may contain different positions. DNA testing companies have to “fill in the blanks” for compatibility, and they do this using a technique called imputation. Illumina forced their customers to adopt imputation in 2017 when they dropped the capacity of their chip. [37]

Identify Matching Segments: The DNA test software for respective DNA companies compare the SNP data between two individuals to identify segments of DNA that appear to be identical or similar. These matching DNA segments indicate the likelihood of DNA inherited from a common ancestor. [38]

The ability to identify DNA matches between individuals is largely influenced by the size of database tests and the SNPs that were sampled to atDNA tests. As indicated, there are main differences between atDNA tests from various companies (e.g. 23andMe, Ancestry.com, FamilyTree DNA, LivingDNA, MyHeritage) regarding SNPs that are tested and the relative size of their respective database results.

Each company maintains its own proprietary reference databases and matching algorithms. As indicated in table three below, AncestryDNA has a larger customer database (over 20 million) compared to 23andMe (about 12 million). This gives AncestryDNA an advantage for finding genetic relatives.

Table Three: Data Base Size and Number of SNPs Tested by DNA Company in 2024

DNA
Company
Data Base Size of
atDNA Test Results
No. of Autosome
SNPs Tested
23andMe14 Million630,`132
FamilyTreeDNA1.7 million612,272
AncestryDNA25 million637,639
My Heritage8.5 million576,157
Living DNA300,000683,503
Source: Autosomal DNA testing comparison chart, International Society of Genetic Genalogy Wiki, This page was last edited on 8 October 2024, https://isogg.org/wiki/Autosomal_DNA_testing_comparison_chart

Measuring Segment Length: The length of matching segments of SNPs is measured in centimorgans (cM). Centimorgans measure the likelihood of genetic recombination between two markers on a chromosome. One centimorgan represents a one percent chance that two genetic markers will be separated by a recombination event in a single generation. This measurement helps geneticists and genealogists estimate how close two individuals are genetically related. [39]

Centimorgans (cM) are a crucial unit of measurement in genetic atDNA testing. It is used to quantify genetic distance and determine relationships between individuals based on shared DNA. The more centimorgans two people share, the more likely they are related. in addition to the number of cMs shared, longer segments generally indicate a closer relationship.

One cM corresponds on the average to about 1 million base pairs in humans. The total human genome is approximately 7400 cM long. A parent-child relationship typically shares about 3400-3700 cM. More distant relatives share fewer cMs. However, there can be overlap in cM ranges for different relationship types, so additional genealogical research is often needed to determine exact relationships.

(A centiMorgan) is less of a physical distance and more of a measurement of probability. It refers to the DNA segments that you have in common with others and the likelihood of sharing genetic traits. The ends of shared segments are defined by points where DNA swapped between two chromosomes, and the centimorgan is a measure of the probability of getting a segment that large when these swaps occur.” [40]

Chart One: Ranges of Shared centiMorgans with Family

Click for Larger View | Source: Bettinger, Blaine, Version 4.0! March 2020 Update to the Shared cM Project!, 27 Mar 2020, The Genetic Genealogist, https://thegeneticgenealogist.com/2020/03/27/version-4-0-march-2020-update-to-the-shared-cm-project/

When you take an atDNA test, the testing company compares your DNA to others in their database. The amount of DNA you share with a match is reported in centimorgans. Generally, the more centimorgans you share with someone, the more closely you are related to this other person. Shared centimorgan ranges can often indicate how many generations separate two people. Certain shared cM values can also suggest possible half-sibling or half-first cousin relationships as opposed to full relatives.

Calculating Total Shared DNA: The total amount of shared DNA is calculated by summing up the lengths of all matching segments, typically expressed in cMs or as a percentage of the total amount of shared SNPs sampled. [41]

Applying Thresholds: Each company sets minimum thresholds for segment length and total shared DNA to be considered a match. For example, FamilyTree DNA requires at least one segment of 9 cM or more.

Table Four: Different cM Thresholds for atDNA Matches Across DNA Companies

DNA CompanyCriteria for matching segments
23andMe9 cMs and at least 700 SNPs for one half-identical region

5 cMs and 700 SNPs with at least two half-identical regions being shared
FamilyTreeDNAAll matching segments must be at least 6 cMs in length. almost all matching segments contain at least 800 SNPs & all matching segments contain at least 600 SNPs.
AncestryDNA6 cMs per segment before the Timber algorithm is applied and a total of at least 8 cMs after Timber is applied.
My Heritage8 cM for the first matching segment and at least 6 cMs for the 2nd matching segment; 12 cM for the first matching segment in people whose ancestry is at least 50% Ashkenazi Jewish
Living DNA9.46 cMs for the first segment
Source: Autosomal DNA testing comparison chart, International Society of Genetic Genalogy Wiki, This page was last edited on 8 October 2024, https://isogg.org/wiki/Autosomal_DNA_testing_comparison_chart

Relationship Prediction: The amount of shared DNA is compared to expected ranges for different relationships to predict how two people may be related. Close relationships like parent/child or full siblings have very distinct amounts of shared DNA, while more distant relationships have overlapping ranges. [42]

Special Considerations: Some of the DNA companies use phasing algorithms to improve accuracy, especially for analyzing smaller shared segments. Some also apply special algorithms for populations with higher rates of endogamy, like Ashkenazi Jews. [43]

Moving Onward

I imagine all of this makes total sense. I, however, believe, all of this is totally confusing. To walk away with some semblance of understanding, I would focus on the following observations:

  • DNA tests can only provide so much information. Traditional genealogical research brings atDNA results into focus. Genetic and traditional research strategies can work hand in hand.
  • atDNA tests have the ability to trace living genetic relatives on both sides of your family tree. However, their effectiveness is limited in terms of how many generations back they can effectively provide results.
  • While autosomal DNA testing has become increasingly accurate, there are still limitations in the context of estimating genetic relations and finding relatives.
  • When looking at atDNA matches, centimorgans (cM) are the key unit of measurement in genetic atDNA testing. It is used to determine relationships between individuals based on shared DNA. The more centimorgans two people share, the more likely they are related. in addition to the number of cMs shared, longer segments generally indicate a closer relationship.

Sources

Feature image: The image depicts a branch from a massive family tree that shows 6,000 relatives spanning seven generations.  It is part of a study that links 13 million people related by genetics or marriage.  Source: Jocelyn Kaiser, Thirteen million degrees of Kevin Bacon: World’s largest family tree shines light on life span, who marries whom, Science, 1 Mar 2018, https://www.science.org/content/article/thirteen-million-degrees-kevin-bacon-world-s-largest-family-tree-shines-light-life-span .

See the original study behind this effort at: Kaplanis J, Gordon A, Shor T, Weissbrod O, Geiger D, Wahl M, Gershovits M, Markus B, Sheikh M, Gymrek M, Bhatia G, MacArthur DG, Price AL, Erlich Y. Quantitative analysis of population-scale family trees with millions of relatives. Science. 2018 Apr 13;360(6385):171-175. doi: 10.1126/science.aam9309. Epub 2018 Mar 1. PMID: 29496957; PMCID: PMC6593158. https://pmc.ncbi.nlm.nih.gov/articles/PMC6593158/

[1] See the following stories:

[2] Bettinger, Blaine, Everyone Has Two Family Trees – A Genealogical Tree and a Genetic Tree, 10 Nov 2009, The Genetic Genealogist, https://thegeneticgenealogist.com/2009/11/10/qa-everyone-has-two-family-trees-a-genealogical-tree-and-a-genetic-tree/

Understanding genetic ancestry testing, International Society of Genetic Genealogy Wiki, This page was last edited on on 25 August 2015, https://isogg.org/wiki/Understanding_genetic_ancestry_testing

[3] Human Y-chromosome DNA haplogroup, Wikipedia, This page was last edited on 5 October 2024,, https://en.wikipedia.org/wiki/Human_Y-chromosome_DNA_haplogroup

Human mitochondrial DNA haplogroup, Wikipedia, This page was last edited on 5 October 2024, https://en.wikipedia.org/wiki/Human_mitochondrial_DNA_haplogroup

Rowe, Katy, Genealogy’s Secret Weapon: How Using mtDNA Can Solve Family Mysteries, 10 May 2023, FamilyTreeDNA Blog, https://blog.familytreedna.com/mtdna/

MtDNA testing comparison chart, International Society of Genetic Genealogy Wiki, This page was last edited on 3 September 2023, https://isogg.org/wiki/MtDNA_testing_comparison_chart

Y chromosome DNA tests, International Society of Genetic Genealogy Wiki, This page was last edited on 6 September 2024, https://isogg.org/wiki/Y_chromosome_DNA_tests

Y-DNA STR testing comparison chart, International Society of Genetic Genealogy Wiki, This page was last edited on 11 July 2022, https://isogg.org/wiki/Y-DNA_STR_testing_comparison_chart

Balding, David, Debbie Kennett and Mark Thomas, Understanding genetic ancestry testing, This page was last edited on 25 August 2015, Iternational Society of Genetic Genealogy Wiki, https://isogg.org/wiki/Understanding_genetic_ancestry_testing

Rowe-Schurwanz, Kathy, Using mtDNA for Genealogical Research, Aug 14, 2024, FamilyTreeDNA Blog, https://blog.familytreedna.com/using-mtdna-genealogical-research/

Rowe-Schurwanz, Kathy, How Autosomal DNA Testing Works, June10, 2024, FamilyTreeDNA Blog, https://blog.familytreedna.com/how-autosomal-dna-testing-works/

Unveiling the Power of Big Y-700: Unraveling the Journey and Advantages, Oct 21, 2022, FamilyTreeDNA Blog, https://blog.familytreedna.com/big-y-700/

Mitochondrial Eve, Wikipedia, This page was last edited on 18 September 2024, https://en.wikipedia.org/wiki/Mitochondrial_Eve

Y-chromosomal Adam, Wikipedia, This page was last edited on 19 September 2024, https://en.wikipedia.org/wiki/Y-chromosomal_Adam

[4] Newton, Maud, America’s Ancestry Craze: Making sense of our family-tree obsession, June 2014, Harper’s Magazine, https://harpers.org/archive/2014/06/americas-ancestry-craze/

[5] Jorde LB, Bamshad MJ. Genetic Ancestry Testing: What Is It and Why Is It Important? JAMA. 2020 Mar 17;323(11):1089-1090. doi:10.1001/jama.2020.0517 PMID: 32058561; PMCID: PMC8202415 https://www.ncbi.nlm.nih.gov/pmc/articles/PMC8202415/

[6] Antonio Regalodo, More than 26 million people have taken an at-home ancestry test, MIT Technology Review, 11 Feb 2019, https://www.technologyreview.com/2019/02/11/103446/more-than-26-million-people-have-taken-an-at-home-ancestry-test/

Covering Your Bases: Introduction to Autosomal DNA Coverage, Legacy Tree Genealogists, https://www.legacytree.com/blog/introduction-autosomal-dna-coverage

DNA Geek, Family DNA Tests for Ancestry & Genealogy, Navigating the World of DNA,

[7] Has the consumer DNA test boom gone bust?, Feb 20, 2020, updated Jul 28, 2024, Advisory Board, https://www.advisory.com/daily-briefing/2020/02/20/dna-tests 

[8] Ibid

[9] Krimsky Sheldon, The Business of DNA Ancestry, in: Understanding DNA Ancestry. Understanding Life. Cambridge University Press; 2021, Pages 8-16.

Molla, Rami, Why DNA tests are suddenly unpopular, 13 Feb 2020, Vox, https://www.vox.com/recode/2020/2/13/21129177/consumer-dna-tests-23andme-ancestry-sales-decline#

Spiers, Caroline, Keeping It in the Family: Direct-to-Consumer Genetic Testing and the Fourth Amendment, Houston Law Review, Vol 59, Issue 5, May 23 2020, https://houstonlawreview.org/article/36547-keeping-it-in-the-family-direct-to-consumer-genetic-testing-and-the-fourth-amendment

Has the consumer DNA test boom gone bust?, Updated 28 Jul 2023, Advisory Board, https://www.advisory.com/daily-briefing/2020/02/20/dna-tests

Linder, Emmett, As 23andMe Struggles, Concerns Surface About Its Genetic Data, 5 Oct 2024, New York Times, https://www.nytimes.com/2024/10/05/business/23andme-dna-bankrupt.html

Estes, Roberta, DNA Testing Sales Decline: Reason and Reasons, 11 Feb 2020, DNAeXplained – Genetic Genealogy Blog, https://dna-explained.com/2020/02/11/dna-testing-sales-decline-reason-and-reasons/

[10] Fish, Eric, The Sordid Saga of 23andMe, 21 Oct 2024, All Science Great & Small, https://allscience.substack.com/p/the-sordid-saga-of-23andme

Prictor, Megan, Millions of People’s DNA in Doubt as 23andMe Faces Bankruptcy, 21 Oct 2024, Science Alert, https://www.sciencealert.com/millions-of-peoples-dna-in-doubt-as-23andme-faces-bankruptcy

Linder, Emmett, As 23andMe Struggles, Concerns Surface About Its Genetic Data, 5 Oct 2024, New York Times, https://www.nytimes.com/2024/10/05/business/23andme-dna-bankrupt.html

Allyn, Bobby, 23andMe is on the brink. What happens to all its DNA data?, NPR, https://www.npr.org/2024/10/03/g-s1-25795/23andme-data-genetic-dna-privacy

23andMe Facing Bankruptcy, FoxLocal 26, , https://youtu.be/ZfBOCxbWAeY

[10a] Estes, Roberta, 23andMe Trouble – Step-by-Step Instructions to Preserve Your Data and Matches, 19 Sep 2024, DNAeXplained – Genetic Genealogy, https://dna-explained.com/2024/09/19/23andme-trouble-step-by-step-instructions-to-preserve-your-data-and-matches/

[11] A karyotype is a visual representation of an individual’s complete set of chromosomes, displaying their number, size, and structure, typically arranged in pairs and ordered by size.

“A karyotype is the general appearance of the complete set of chromosomes in the cells of a species or in an individual organism, mainly including their sizes, numbers, and shapes. … A karyogram or idiogram is a graphical depiction of a karyotype, wherein chromosomes are generally organized in pairs, ordered by size and position of centromere for chromosomes of the same size.”

Karotype, Wikipedia, This page was last edited on 12 September 2024, https://en.wikipedia.org/wiki/Karyotype

Karyotype, Wikipedia, This page was last edited on 17 October 2024,, https://en.wikipedia.org/wiki/Karyotype

Dutra, Ameria, Karyotype, National Genome Human Genome Research Institute, https://www.genome.gov/genetics-glossary/Karyotype

Karyotype, ScienceDirect, definition and discussion is from from Antonie D. Kline and Ethylin Wang Jabs, eds., Genomics in the Clinic,  2024, Shen Gu, Bo Yuan, Ethylin Wang Jabs, Christine M. Eng , Chapter 2 – Basic Principles of Genetics and Genomics,  Pages 5-28 ,  https://www.sciencedirect.com/topics/biochemistry-genetics-and-molecular-biology/karyotype 

Shen Gu, Bo Yuan, Ethylin Wang Jabs, Christine M. Eng, Chapter 2 – Basic Principles of Genetics and Genomics, Editor(s): Antonie D. Kline, Ethylin Wang Jabs, Genomics in the Clinic, Academic Press, 2024, Pages 5-28

[12] Autosomes are the non-sex chromosomes found in the cells of organisms. Autosomes are any chromosomes that are not sex chromosomes (allosomes). In humans, there are 22 pairs of autosomes, numbered from 1 to 22. They come in identical pairs in both males and females. They are numbered based on size, shape, and other properties. They contain genes that control the inheritance of all traits except sex-linked ones.

[13] Recombination is a process by which pieces of DNA are broken and recombined to produce new combinations of nucleotides or alleles. Recombination primarily happens between homologous chromosomes, which are paired chromosomes with similar genetic information, allowing for the exchange of corresponding DNA segments.

During meiosis, when homologous chromosomes pair up, a process called “crossing over” occurs where DNA strands break and rejoin, swapping genetic material between the chromosomes. This recombination process creates genetic diversity at the level of genes that reflects differences in the DNA sequences of different organisms. 

Recombination, Scitable by nature Education, Nature, 2014, https://www.nature.com/scitable/definition/recombination-226/

Genetic recombination, Wikipedia, This page was last edited on 5 October 2024, https://en.wikipedia.org/wiki/Genetic_recombination

Alberts B, Johnson A, Lewis J, et al., General Recombination, in The cell, New York: Garland Science; 2002. https://www.ncbi.nlm.nih.gov/books/NBK26898/

[14] Autosomal DNA Statistics, International Society of Genetic Genealogy Wiki, Page was last edited 4 August 2022, Page accessed 14 Aug 2022, https://isogg.org/wiki/Autosomal_DNA_statistics

Nicole Dyer, Charts for Understanding DNA Inheritance, 14 Aug 2019, Family Locket, Page accessed 10 Oct 2021, https://familylocket.com/charts-for-understanding-dna-inheritance/

[15] Meiosis is a type of cell division that reduces the number of chromosomes in the parent cell by half and produces four gamete cells. This process is required to produce egg and sperm cells for sexual reproduction.

Meiosis, 2014, Scitable by Nature Education, Nature, https://www.nature.com/scitable/definition/meiosis-88/

Gilchrist, Daniel, Meiosis, National Human Genome Research Institute, https://www.genome.gov/genetics-glossary/Meiosis

Meiosis, Wikipedia, This page was last edited on 22 August 2024, https://en.wikipedia.org/wiki/Meiosis

[16] What are reduced penetrance and variable expressivity?, MedlinePlus, https://medlineplus.gov/genetics/understanding/inheritance/penetranceexpressivity/

Miko, Iiona,  Phenotype variability: penetrance and expressivity. Nature Education 1(1):137 , 2008, https://www.nature.com/scitable/topicpage/phenotype-variability-penetrance-and-expressivity-573/

Expressivity (genetics), Wikipedia, This page was last edited on 9 October 2024, https://en.wikipedia.org/wiki/Expressivity_(genetics)

[17] Average Percent DNA Shared Between Relatives, 23andMe Customer Care, Tools, 23andMe, https://customercare.23andme.com/hc/en-us/articles/212170668-Average-Percent-DNA-Shared-Between-Relatives

Autosomal Statistics, International Society of Genetic Genealogy Wiki, This page was last edited on 17 October 2022, https://isogg.org/wiki/Autosomal_DNA_statistics

[18] The genome is the entire set of DNA instructions found in a cell. In humans, the genome consists of 23 pairs of chromosomes located in the cell’s nucleus, as well as a small chromosome in the cell’s mitochondria. A genome contains all the information needed for an individual to develop and function.

Human Genomic Variation, Fact Sheet, National Human Genome Research Institute, 1 Feb 2023, https://www.genome.gov/about-genomics/educational-resources/fact-sheets/human-genomic-variation

[19] Fundamental Concepts of Genetics and about the Human Genome, Eupedia, page accessed 3 Feb 2021, https://www.eupedia.com/genetics/human_genome_and_genetics.shtml

Sheldon Krimsky, Understanding DNA Ancestry, Cambridge: Cambridge University , 2022, Page 18

Human Genomic Variation, Fact Sheet, National Human Genome Research Institute, 1 Feb 2023, https://www.genome.gov/about-genomics/educational-resources/fact-sheets/human-genomic-variation

[20] Nucleotide, National Cancer Institute, https://www.cancer.gov/publications/dictionaries/genetics-dictionary/def/nucleotide

Nucleotide, Wikipedia, This page was last edited on 3 September 2024, https://en.wikipedia.org/wiki/Nucleotide

Brody, Lawrence, Nucleotide, National Human Genome Research Institute, 1 Nov 2024, https://www.genome.gov/genetics-glossary/Nucleotide 

[21] Non-Coding DNA, AncestryDNA Learning Hub, 16 Aug 2016, https://www.ancestry.com/c/dna-learning-hub/non-coding-dna

What is Noncoding DNA?, MedlinePlus, https://medlineplus.gov/genetics/understanding/basics/noncodingdna/

[22] Non-Coding DNA, AncestryDNA Learning Hub, https://www.ancestry.com/c/dna-learning-hub/junk-dna

Ohno, Susumu. “So Much ‘Junk’ DNA in Our Genome.” Brookhaven Symposium on Biology, Volume 23, 1972: 366-370.

Zhang F, Lupski JR. Non-coding genetic variants in human disease. Hum Mol Genet. 2015 Oct 15;24(R1):R102-10. doi: 10.1093/hmg/ddv259. Epub 2015 Jul 7. PMID: 26152199; PMCID: PMC4572001 https://pmc.ncbi.nlm.nih.gov/articles/PMC4572001/

Peña-Martínez EG, Rodríguez-Martínez JA. Decoding Non-coding Variants: Recent Approaches to Studying Their Role in Gene Regulation and Human Diseases. Front Biosci (Schol Ed). 2024 Mar 1;16(1):4. doi: 10.31083/j.fbs1601004. PMID: 38538340; PMCID: PMC11044903 https://pmc.ncbi.nlm.nih.gov/articles/PMC11044903/

Malte Spielmann, Stefan Mundlos, Looking beyond the genes: the role of non-coding variants in human disease, Human Molecular Genetics, Volume 25, Issue R2, 1 October 2016, Pages R157–R165, https://doi.org/10.1093/hmg/ddw205

Vitsios, D., Dhindsa, R.S., Middleton, L. et al. Prioritizing non-coding regions based on human genomic constraint and sequence context with deep learning. Nat Commun 12, 1504 (2021). https://doi.org/10.1038/s41467-021-21790-4

Ellingford, J.M., Ahn, J.W., Bagnall, R.D. et al. Recommendations for clinical interpretation of variants found in non-coding regions of the genome. Genome Med 14, 73 (2022). https://doi.org/10.1186/s13073-022-01073-3

[23]  The 1000 Genomes Project Consortium. A global reference for human genetic variation. Nature 526, 68–74 (2015). https://doi.org/10.1038/nature15393https://www.nature.com/articles/nature15393#citeas

Human Genomic Variation, National Human Genome Research Institute, https://www.genome.gov/about-genomics/educational-resources/fact-sheets/human-genomic-variation

For the 99.9 percent figure, see for example: Krimsky, Sheldon, Understanding DNA Ancestry, Cambridge, Cambridge University Press, 2022, Page 18

[22] Zou H, Wu LX, Tan L, Shang FF, Zhou HH. Significance of Single-Nucleotide Variants in Long Intergenic Non-protein Coding RNAs. Front Cell Dev Biol. 2020 May 25;8:347. doi: 10.3389/fcell.2020.00347. PMID: 32523949; PMCID: PMC7261909

The Order of Nucleotides in a Gene Is Revealed by DNA Sequencing, Scitable, Nature Education, https://www.nature.com/scitable/topicpage/the-order-of-nucleotides-in-a-gene-6525806/

single nucleotide variant, National Cancer Institute, https://www.cancer.gov/publications/dictionaries/genetics-dictionary/def/single-nucleotide-variant

Wright, A.F. (2005). Genetic Variation: Polymorphisms and Mutations. In eLS, (Ed.). https://doi.org/10.1038/npg.els.0005005

Single-nucleotide polymorphism, Wikipedia, This page was last edited on 29 September 2024, https://en.wikipedia.org/wiki/Single-nucleotide_polymorphism

SNVs vs. SNPs, CD Genomics, https://www.cd-genomics.com/resource-snvs-vs-snps.html

[23] Human Genomic Variation, Fact Sheet, National Human Genome Research Institute, 1 Feb 2023, https://www.genome.gov/about-genomics/educational-resources/fact-sheets/human-genomic-variation

[24] Ichikawa, K., Kawahara, R., Asano, T. et al. A landscape of complex tandem repeats within individual human genomes. Nat Commun 14, 5530 (2023). https://doi.org/10.1038/s41467-023-41262-1 

Tandem Repeat, Wikipedia, This page was last edited on 12 July 2024, https://en.wikipedia.org/wiki/Tandem_repeat

Myers, P., Tandem repeats and morphological variation. Nature Education 1(1):1, 2007,  http://scienceblogs.com/pharyngula/2007/10/tandem_repeats_and_morphologic.php

Usdin K. The biological effects of simple tandem repeats: lessons from the repeat expansion diseases. Genome Res. 2008 Jul;18(7):1011-9. doi: 10.1101/gr.070409.107. PMID: 18593815; PMCID: PMC3960014. https://pmc.ncbi.nlm.nih.gov/articles/PMC3960014/

Ichikawa, K., Kawahara, R., Asano, T. et al. A landscape of complex tandem repeats within individual human genomes. Nat Commun 14, 5530 (2023). https://doi.org/10.1038/s41467-023-41262-1 

Mitsuhashi, S., Frith, M.C., Mizuguchi, T. et al. Tandem-genotypes: robust detection of tandem repeat expansions from long DNA reads. Genome Biol 20, 58 (2019). https://doi.org/10.1186/s13059-019-1667-6 

Sequencing 101: Tandem repeats, 22 Nov 2023, PacBio, https://www.pacb.com/blog/sequencing-101-tandem-repeats/

Kai Zhou, Abram Aertsen, Chris W. Michiels, The role of variable DNA tandem repeats in bacterial adaptation, FEMS Microbiology Reviews, Volume 38, Issue 1, January 2014, Pages 119–141, https://doi.org/10.1111/1574-6976.12036

Fan H, Chu JY. A brief review of short tandem repeat mutation. Genomics Proteomics Bioinformatics. 2007 Feb;5(1):7-14. doi: 10.1016/S1672-0229(07)60009-6. PMID: 17572359; PMCID: PMC5054066. https://pmc.ncbi.nlm.nih.gov/articles/PMC5054066/

[25] Structural variation, Wikipedia, This page was last edited on 30 August 2024, https://en.wikipedia.org/wiki/Structural_variation

Scott AJ, Chiang C, Hall IM. Structural variants are a major source of gene expression differences in humans and often affect multiple nearby genes. Genome Res. 2021 Dec;31(12):2249-2257. doi: 10.1101/gr.275488.121. Epub 2021 Sep 20. PMID: 34544830; PMCID: PMC8647827 https://pmc.ncbi.nlm.nih.gov/articles/PMC8647827/

Feuk, L., Carson, A. & Scherer, S. Structural variation in the human genome. Nat Rev Genet 7, 85–97 (2006). https://doi.org/10.1038/nrg1767 

[26] CNVs are typically defined as DNA segments that are: larger than 1,000 base pairs (1 kilobase); usually less than 5 megabases in length; and  can include both duplications (additional copies) and deletions (losses) of genetic material. 

CNVs are remarkably common in human genomes. They account for approximately 5 to 9.5% of the human genome. They affect more base pairs than other forms of mutation when comparing two human genomes. They play crucial roles in evolution, population diversity, and disease development. 

Copy number variation, Wikipedia, This page was last edited on 24 September 2024, https://en.wikipedia.org/wiki/Copy_number_variation

Pös O, Radvanszky J, Buglyó G, Pös Z, Rusnakova D, Nagy B, Szemes T. DNA copy number variation: Main characteristics, evolutionary significance, and pathological aspects. Biomed J. 2021 Oct;44(5):548-559. doi: 10.1016/j.bj.2021.02.003. Epub 2021 Feb 13. PMID: 34649833; PMCID: PMC8640565 https://pmc.ncbi.nlm.nih.gov/articles/PMC8640565/

Eichler, E. E. Copy Number Variation and Human Disease. Nature Education 1(3):1, 2008,  https://www.nature.com/scitable/topicpage/copy-number-variation-and-human-disease-741737/

What are copy number variants?, 12 Aug 2020, Genomics Education Programme, https://www.genomicseducation.hee.nhs.uk/blog/what-are-copy-number-variants/

Clancy, S. Copy number variation. Nature Education 1(1):95, 2008, https://www.nature.com/scitable/topicpage/copy-number-variation-445/

Copy number variant, National Cancer Institute, https://www.cancer.gov/publications/dictionaries/genetics-dictionary/def/copy-number-variant

Copy Number Variation (CNV), 3 Nov 2024, National Human Genome Research Institute, https://www.genome.gov/genetics-glossary/Copy-Number-Variation

[29] Several approaches are used to determine if an SNV meets the one percent population frequency threshold:

  • Large-Scale Population Studies: Projects like the 1000 Genomes Project have sequenced thousands of individuals across multiple populations to identify and validate SNPs
  • A number of detection technologies are used such as real-time PCR, the use of microarrays, and Next-generation sequencing (NGS).

See for example:

The 1000 Genomes Project Consortium. A global reference for human genetic variation. Nature 526, 68–74 (2015). https://doi.org/10.1038/nature15393 

Patricia M Schnepp, Mengjie Chen, Evan T Keller, Xiang Zhou, SNV identification from single-cell RNA sequencing data, Human Molecular Genetics, Volume 28, Issue 21, 1 November 2019, Pages 3569–3583, https://doi.org/10.1093/hmg/ddz207

Telenti A, Pierce LC, Biggs WH, di Iulio J, Wong EH, Fabani MM, Kirkness EF, Moustafa A, Shah N, Xie C, Brewerton SC, Bulsara N, Garner C, Metzker G, Sandoval E, Perkins BA, Och FJ, Turpaz Y, Venter JC. Deep sequencing of 10,000 human genomes. Proc Natl Acad Sci U S A. 2016 Oct 18;113(42):11901-11906. doi: 10.1073/pnas.1613365113. Epub 2016 Oct 4. PMID: 27702888; PMCID: PMC5081584. https://pmc.ncbi.nlm.nih.gov/articles/PMC5081584/

SNVs vs. SNPs, CD Genomics, https://www.cd-genomics.com/resource-snvs-vs-snps.html

Efficiently detect single nucleotide polymorphisms and variants, Illumina, https://www.illumina.com/techniques/popular-applications/genotyping/snp-snv-genotyping.html

[30] What are single nucleotide polymorphisms (SNPs)?, MedlinePlus, https://medlineplus.gov/genetics/understanding/genomicresearch/snp/

SNP, IMS Riken Center for Integrative Medical Sciences, https://www.ims.riken.jp/english/glossary/genome.php

The 1000 Genomes Project Consortium. A global reference for human genetic variation.Nature 526, 68–74 (2015). https://doi.org/10.1038/nature15393

[31] Ancestry Information Markers, National Human Genome Research Institute, https://www.genome.gov/genetics-glossary/Ancestry-informative-Markers

Joon-Ho You, Janelle S. Taylor, Karen L. Edwards, Stephanie M. Fullerton, What are our AIMs? Interdisciplinary Perspectives on the Use of Ancestry Estimation in Disease Research, National Library of Medicine, 2012 Nov 5. doi: 10.1080/21507716.2012.717339

Huckins, L., Boraska, V., Franklin, C. et al. Using ancestry-informative markers to identify fine structure across 15 populations of European origin. Eur J Hum Genet 22, 1190–1200 (2014). https://doi.org/10.1038/ejhg.2014.1

[32] What are single nucleotide polymorphisms (SNPs)?, MedlinePlus, https://medlineplus.gov/genetics/understanding/genomicresearch/snp/

[33] AIMs are single-nucleotide polymorphisms (SNPs) that show substantially different frequencies between populations from different geographical regions15. These genetic variations can be used to estimate the geographical origins of a person’s ancestors, typically by continent of origin.

AIMs are found within the approximately 15 million SNP sites in human DNA (about 0.4% of total base pairs). They are often traced to the Y chromosome, Mitochondrial DNA, and Autosomal regions.

AIMs can distinguish between major continental populations (Africa, Asia, Europe). They require multiple markers working together (typically 20-30 or more) for accurate ancestry determination. They can identify fine population structure within continents using larger marker sets. 

The effectiveness of AIMs depends on the number of markers used:

  • 40-80 markers can identify five broad continental clusters;
  • 128 markers can characterize samples into 8 broad continental groups; and
  • Larger sets (>46,000 markers) can identify detailed subpopulation structure

Hinkley, Ellen, DNA Testing Choice, 16 Dec 2016, https://dnatestingchoice.com/en-us/news/what-is-an-autosomal-dna-test

Lamiaa Mekhfi, Bouchra El Khalfi, Rachid Saile, Hakima Yahia, and Abdelaziz Soukri, The interest of informative ancestry markers (AIM) and their fields of application, , BIO Web of Conferences 115, 07003 (2024),https://doi.org/10.1051/bioconf/202411507003 

Huckins, L., Boraska, V., Franklin, C. et al. Using ancestry-informative markers to identify fine structure across 15 populations of European origin. Eur J Hum Genet 22, 1190–1200 (2014). https://doi.org/10.1038/ejhg.2014.1 

Ancestry Information Markers, National Human Genome Research Institute, https://www.genome.gov/genetics-glossary/Ancestry-informative-Markers

Ancestry-informative marker, Wikipedia, This page was last edited on 14 August 2024, https://en.wikipedia.org/wiki/Ancestry-informative_marker

[34] Autosomal DNA Statistics, International Society of Genetic Genealogy Wiki, This page was last edited on 17 October 2022, https://isogg.org/wiki/Autosomal_DNA_statistics

Autosomal SNP comparison chart, International Society of Genetic Genealogy Wiki, This page was last edited on 29 January 2024, https://isogg.org/wiki/Autosomal_SNP_comparison_chart

DNA Structure and the Testing Process, FamilyTreeDNA Help Center, https://help.familytreedna.com/hc/en-us/articles/6189190247311-DNA-Structure-and-the-Testing-Process

Catherine A. Ball, Mathew J Barber, Jake Byrnes, Peter Carbonetto, Kenneth G. Chahine, Ross E. Curtis, Julie M. Granka, Eunjung Han, Eurie L. Hong, Amir R. Kermany, Natalie M. Myres, Keith Noto, Jianlong Qi, Kristin Rand, Yong Wang and Lindsay Willmore, AncestryDNA Matching White Paper, 31 Mar 2016, AncestryDNA, https://www.ancestry.com/cs/dna-help/matches/whitepaper; PDF: https://www.ancestry.com/dna/resource/whitePaper/AncestryDNA-Matching-White-Paper.pdf

Autosomal DNA match thresholds, International Society of Genetic Genealogy Wiki, This page was last edited on 31 August 2024, https://isogg.org/wiki/Autosomal_DNA_match_thresholds

Daniel Kling, Christopher Phillips, Debbie Kennett, Andreas Tillmar,

Investigative genetic genealogy: Current methods, knowledge and practice, Forensic Science International: Genetics, Volume 52, 2021, https://doi.org/10.1016/j.fsigen.2021.102474

Davis DJ, Challis JH. Automatic segment filtering procedure for processing non-stationary signals. J Biomech. 2020 Mar 5;101:109619. doi: 10.1016/j.jbiomech.2020.109619. Epub 2020 Jan 9. PMID: 31952818.

The Order of Nucleotides in a Gene Is Revealed by DNA Sequencing, Scitable, Nature Education, https://www.nature.com/scitable/topicpage/the-order-of-nucleotides-in-a-gene-6525806/

[35] The Illumina Global Screening Array (GSA) is a customizable genotyping microarray platform.  Its base configuration

  • Contains approximately 654,000 fixed markers spanning the human genome;
  • Supports 24 samples per array in standard format;
  • Requires 200 ng DNA input;
  • Achieves call rates greater than 99% and reproducibility greater than 99.9%; and
  • Allows addition of up to 100,000 custom markers

Illumina microarray solutions, Illumina, https://www.illumina.com/techniques/microarrays.html

Efficiently detect single nucleotide polymorphisms and variants, Illumina, https://www.illumina.com/techniques/popular-applications/genotyping/snp-snv-genotyping.html

Custom design tools for genotyping any variant, in any species, Illumina, https://www.illumina.com/techniques/popular-applications/genotyping/custom-genotyping.html

Infinium™ Global Screening Array-24 v3.0 BeadChip, Illumina , https://www.illumina.com/content/dam/illumina-marketing/documents/products/datasheets/infinium-global-screening-array-data-sheet-370-2016-016.pdf

Infinium Global Screening Array-24 Kit, Illumina, https://www.illumina.com/products/by-type/microarray-kits/infinium-global-screening.html

Efficiently detect single nucleotide polymorphisms and variants, Illumina, https://www.illumina.com/techniques/popular-applications/genotyping/snp-snv-genotyping.html

Custom design tools for genotyping any variant, in any species, Illumina, https://www.illumina.com/techniques/popular-applications/genotyping/custom-genotyping.html

[36] Estes, Roberta, Comparing DNA Results – Different Tests at the Same Testing Company, 5 Sep 2017, DNAeXplained – Genetic Genealogy, https://dna-explained.com/2023/05/18/comparing-dna-results-different-tests-at-the-same-testing-company/

[37]  Estes, Roberta, Concepts -Imputation, 5 Sep 2017, DNAeXplained – Genetic Genealogy, https://dna-explained.com/2017/09/05/concepts-imputation/

Illumina microarray solutions, Illumina, https://www.illumina.com/techniques/microarrays.html

Efficiently detect single nucleotide polymorphisms and variants, Illumina, https://www.illumina.com/techniques/popular-applications/genotyping/snp-snv-genotyping.html

[38] See for example: Our Autosomal DNA Test (Family Finder™), FamilyTreeDNA HelpCenter, https://help.familytreedna.com/hc/en-us/articles/4411203169679-Our-Autosomal-DNA-Test-Family-Finder

[39] Different DNA testing companies use centimorgans (cM) in slightly different ways when reporting matches and relationships:

  1. Matching thresholds: Companies set different minimum thresholds for reporting matches. For example: AncestryDNA currently uses a threshold of 8 cM; 23andMe uses 7 cM and at least 700 SNPs for the first matching segment; and MyHeritage uses 8 cM.
  2. Algorithms and filtering: Companies use proprietary algorithms to filter and process the raw DNA data. AncestryDNA uses algorithms called Timber and Underdog to phase data and filter out high-frequency segments. Other companies may use different methods, leading to variations in reported shared cM.
  3. Total cM calculations: The total amount of cM a person has can vary between companies. 23andMe reports about 7,440 cM total and AncestryDNA seems to use around 6,800-7,000 cM total.
  4. Reporting of segments: Some companies like 23andMe and FamilyTreeDNA provide detailed segment data. AncestryDNA does not show specific segment information.
  5. Confidence levels: Companies may assign different confidence levels or relationship probabilities based on shared cM. For example, AncestryDNA previously used confidence scores like “Extremely High” for cMs greater than 60.
  6. Handling of small segments: Companies differ in how they handle very small matching segments, with some including segments as small as one cM and others excluding anything below their threshold.

These differences in methodologies can result in variations in reported shared cM and relationship estimates between companies for the same pair of individuals. This is why matches and relationship predictions may not be identical across different testing companies.

Centimorgan, Wikipedia, This page was last edited on 1 May 2024, https://en.wikipedia.org/wiki/Centimorgan

What’s the difference between shared centimorgans and shared segments?, 11 Nov 2019, The Tech Initiative, https://www.thetech.org/ask-a-geneticist/articles/2019/centimorgans-vs-shared-segments/

centiMorgan, Internatioal Society of Genetic Genealogy, This page was last edited on 15 August 2024, https://isogg.org/wiki/CentiMorgan

[40] Hansen, Annelie, Untangling the Centimorgans on Your DNA Test, FamilySearch Blog, https://www.familysearch.org/en/blog/centimorgan-chart-understanding-dna

Green Dragon Genealogy, Yes, but what EXACTLY is a centiMorgan?, 19 Sep 2021, Green Dragon Genealogy,https://greendragongenealogy.co.uk/dna/yes-but-what-exactly-is-a-centimorgan/

[41] Autosomal DNA match thresholds, International Society of Genetic Genealogy Wiki, This page was last edited on 31 August 2024, https://isogg.org/wiki/Autosomal_DNA_match_thresholds

[42] Autosomal DNA Statistics, International Society of Genetic Genealogy Wiki, This page was last edited on 17 October 2022, https://isogg.org/wiki/Autosomal_DNA_statistics

Autosomal DNA match thresholds, International Society of Genetic Genealogy Wiki, This page was last edited on 31 August 2024, https://isogg.org/wiki/Autosomal_DNA_match_thresholds

Estes, Roberta , Comparing DNA Results – Different Tests at the Same Testing Company, DNAeXplained – Genetic Genealogy Blog, 18 May 2023, https://dna-explained.com/2023/05/18/comparing-dna-results-different-tests-at-the-same-testing-company/

Autosomal DNA testing comparison chart, International Society of Genetic Genealogy Wiki, This page was last edited on 8 October 2024, https://isogg.org/wiki/Autosomal_DNA_testing_comparison_chart

[43] Phasing, International Society of Genetic Genealogy Wiki, This page was last edited on 24 May 2024, https://isogg.org/wiki/Phasing

A Guide to Phasing from Illumina: https://youtu.be/15NPZCGP_e4

Autosomal DNA match thresholds, International Society of Genetic Genealogy Wiki, This page was last edited on 31 August 2024, https://isogg.org/wiki/Autosomal_DNA_match_thresholds

Davis DJ, Challis JH. Automatic segment filtering procedure for processing non-stationary signals. J Biomech. 2020 Mar 5;101:109619. doi: 10.1016/j.jbiomech.2020.109619. Epub 2020 Jan 9. PMID: 31952818.