
The analysis of Y-DNA or mtDNA data provides the foundation for mapping out one’s haplogroup or ‘family’ lineage in the long term and mid range time layers. Genetic genealogy is the thread of continuity in all three periods of genealogical time. However, each time layer has its unique properties and rely on predominant forms of contextual evidence to fill in a family narrative.
In order to add historical information to the analysis of Y-DNA or mtDNA evidence, the long term and mid range ancestry genealogical time layers rely on paleo-genomic and anthropological macro level sources of evidence. These two general sources of research can provide an historical background or context for interpreting DNA test results. Their respective advantages in adding meaning to a story, however, have notable limitations as well.
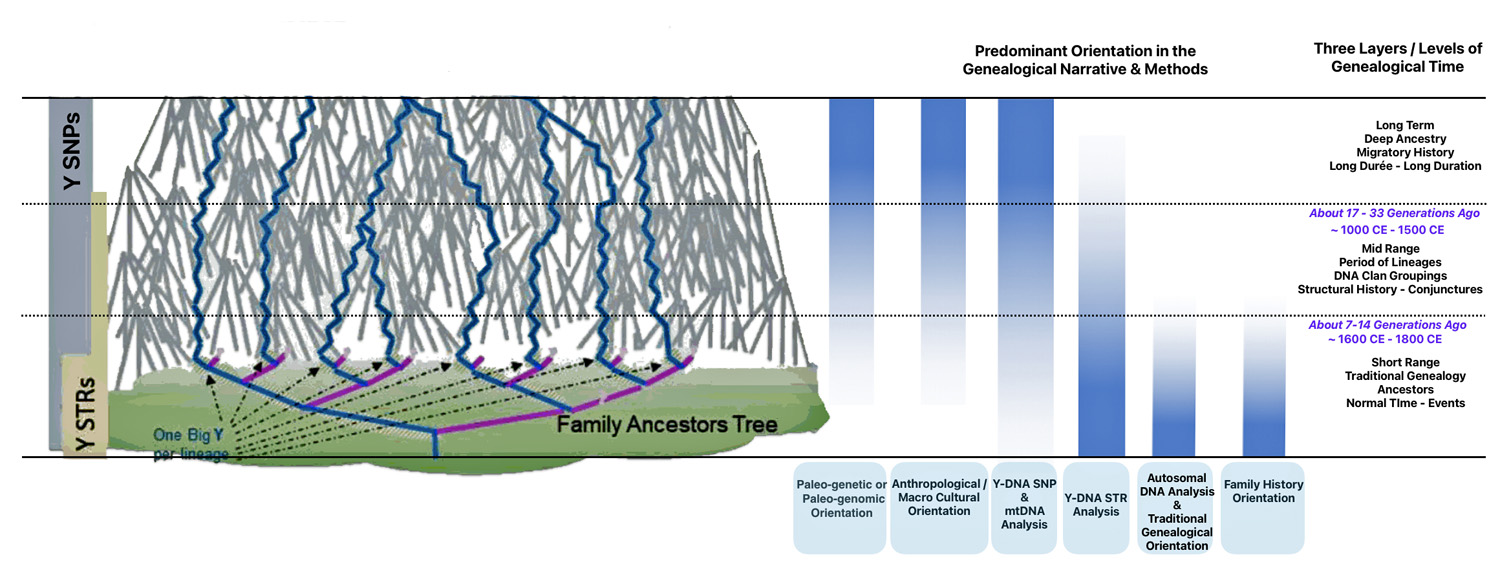
Each of the three layers of genealogical time rely upon different methods of gathering evidence and interpreting evidence in context of social and cultural factors. Illustration one depicts the predominant orientation in narrating family stories in each of the specific layers of genealogical time.
Illustration One: Orientation of Family Stories Based on Genealogical Time Period
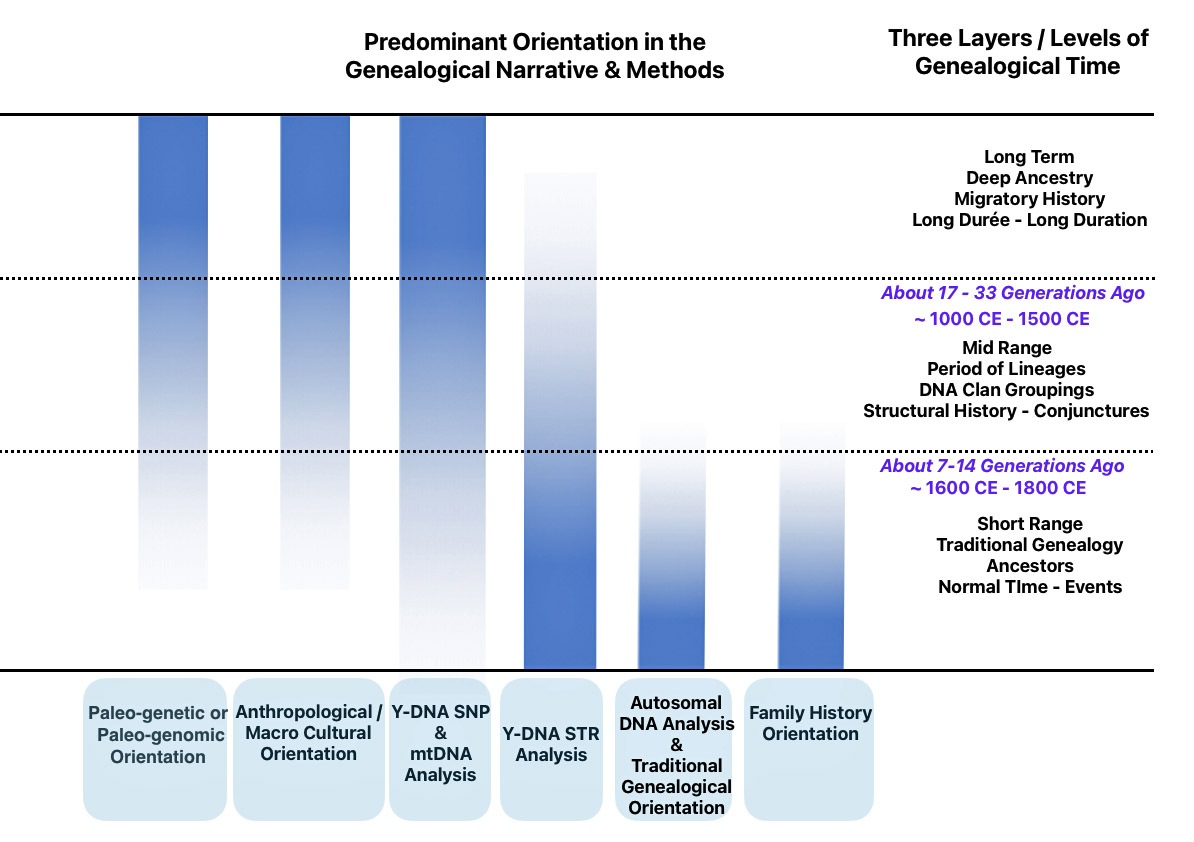
The short range genealogical time period predominately relies on traditional research methods and historical sources associated with social history. Autosomal DNA tests might also be used to verify or discover family relationships within the past seven or so generations. mtDNA (mitochondrial DNA) [1] and Y-DNA tests [2] may also play a supplementary role in fleshing out evidence in the short range time layer.
The mid range genealogical time layer utilizes mtDNA and both SNP and STR Y-DNA data to discover ‘family’ haplogroups. The use of Y-STR data can provide novel discoveries of haplogroup formation when surnames emerged in Europe. As previously stated, the analysis and comparison of individual Y-STR results with other Y-STR test kit results can help delineate lineages and tease out branches within the haplotree family, fine-tuning relationships between ‘mutations’ or people within the tree. [3] The results from genetic DNA tests can be placed into an historical context in the mid range time palyer through anthropoligical and macor cultural research and paleo genetic studies.
The long term time layer relies primarily on SNP and haplogroup data. Genetic data can be interpreted through the lens of long-term, slow-moving macro level social structures, genetic demographic changes and patterns, geographical and climatic influences, and macro level cultural and anthropological history.
I have discussed the creation of family stories in the short range or traditional genealogical time layer in a prior story. This story focuses on the use of the paleo-genetic and anthropological / macro cultural orientations for providing background information when developing family stories within the mid range and long range time layers.
As discussed in prior stories, the Griff(is)(es)(ith) family surname can be traced to William Griffis who was born in Huntington, Long Island New York in 1736. He is the ‘brick wall’ in our traditional family research. Through the use of Y-DNA testing, I have been able to link the Griff(is)(es)(ith) family patrilineal genetic line through a migratory path of the G-haplogroup. I also have evidence that the patrilineal line probably came from the southern area of Wales before immigrating to the American colonies.
The Paleo-Genomic or Paleo-Genetic Orientation
In conjunction with test results from Y-DNA and mtDNA, the discoveries and accumulated research from paleogenomics provide a complimentary base of evidence to document the historical context of migratory patterns of family lineages in the earlier time periods.
Paleogenomics provides powerful insights into human migration patterns through several key analytical approaches. Ancient DNA sequencing allows researchers to directly examine genetic material from historical remains, revealing detailed information about population movements and interactions. This technique can track genetic changes across thousands of years, providing a timeline of human migrations. The ability to analyze both modern and ancient genomes helps reconstruct migration routes, genetic diversification events, and genetic admixture among various groups.
The key applications of paleogenomics for genealogy are, among others, the detection of genetic drift [4] and ancient population migrations and on the analysis of haplogroup features across geographic regions. Modern paleo-genomic techniques have allowed research scientists to reconstruct ancient ecological communities and study adaptive evolution across deep time. [5]
Paleogenomics is the science of reconstructing and analyzing genomic information from extinct species and ancient organisms. This field involves extracting and studying ancient DNA (aDNA) from various sources including museum artifacts, ice cores, archaeological sites, bones, teeth, mummified tissues, and hair. [6]
During the past decade technological advances have made it cost effective and efficiently possible to sequence the entire genome of humans who lived tens of millions of years ago. The result has been an explosion of new information that has fueled an emerging academic field of paleo-genetics or paleo-genomics that is transforming archaeology and the mapping of deep ancestry at a macroscopic level.
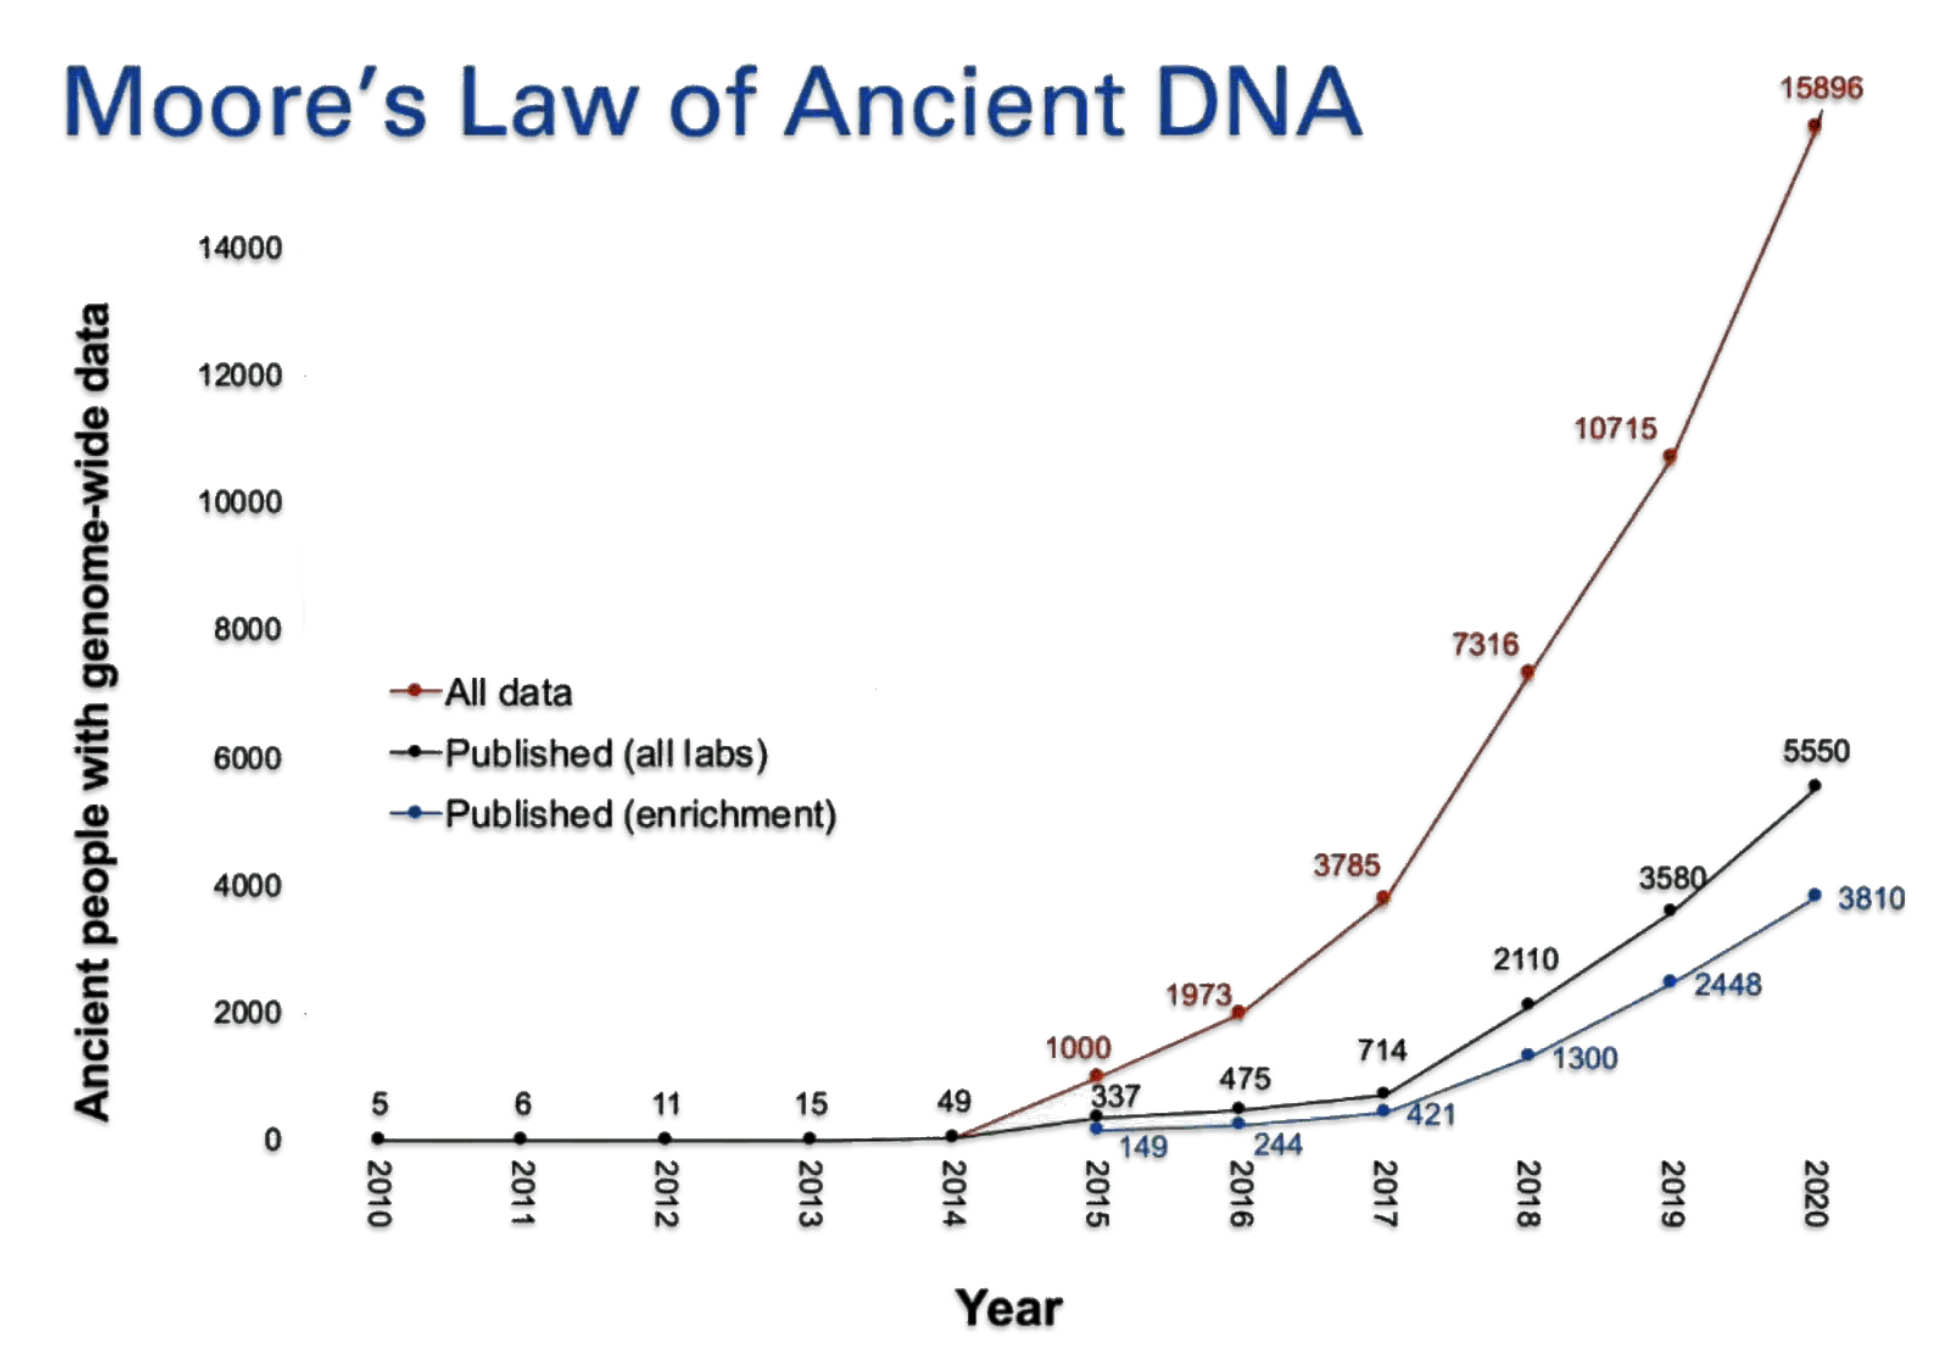
Illustration Two: Samples of Whole Genome Data Generated since 2010

This technology has revolutionized the ability to decode complex biological systems. High-throughput sequencing has revolutionized the study of Y chromosome variation in ancient human DNA (aDNA). High-throughput sequencing (HTS), also known as next-generation sequencing (NGS), represents a paradigm shift in genomic research by enabling rapid, cost-effective, and large-scale analysis of DNA and RNA. [7]
The research using this technology has provided insights into male-specific genetic variation throughout history. The study of aDNA allows scientists to directly examine which SNPs and haplotypes were present at different time periods, rather than relying solely on inferences from modern populations. This provides concrete evidence of population movements and genetic changes over time. [8]
In 2018 alone, the genomes of more than a thousand prehistoric humans were determined, mostly from bones dug up years ago and preserved in museums and archaeological labs. [9]
As illustration three indicates, ancient DNA labs are now producing data on ancient human artifacts so quickly that the time lag between data production and publication of the results is longer than the time it takes to double the data production in the field. David Reich published the chart in illustration two in 2018.
In the matter of two years, Reich updated the chart (illustration three) [10] to reflect the dramatic increase in the number of completed whole genome sequencing of ancient remains. He referred to the dramatic increase in sampling of ancient genome data as “Moore’s Law of Ancient DNA”. [11]
Illustration Three: Growth of Genome Sequencing of Ancient Remains
Paleogenomic studies have revealed that non-African populations resulted from the diversification of an ancestral metapopulation that left Africa around 45,000-55,000 years ago. This migration carried a subset of African genetic diversity to other continents, with subsequent population movements creating the genetic diversity we see today. [12]
“Now scientists are delivering new answers to the question of who Europeans really are and where they came from. Their findings suggest that the continent has been a melting pot since the Ice Age. Europeans living today, in whatever country, are a varying mix of ancient bloodlines hailing from Africa, the Middle East, and the Russian steppe.
“The evidence comes from archaeological artifacts, from the analysis of ancient teeth and bones, and from linguistics. But above all it comes from the new field of paleogenetics. ” [13]
The M168 YDNA genomic mutation represents a crucial milestone in human genetic history, marking one of the most significant events in human male lineage (see illustration four). This Y-chromosome marker originated approximately 50,000-60,000 years ago in northeastern Africa. The M168 mutation appeared in a man who geneticists sometimes refer to as “Out of Africa Adam.” His descendants were among the first humans to migrate out of Africa, carrying this genetic marker with them. This mutation is present in all modern non-African Y-chromosome haplogroups (C through R) and separates these lineages from the earlier African haplogroups A and B. [14]
Illustration Four: Simplified Phylogenetic Tree of Major Y Haplogroups and their Respecrtive Ancestry-Informative Markers (AIMs) in Europe
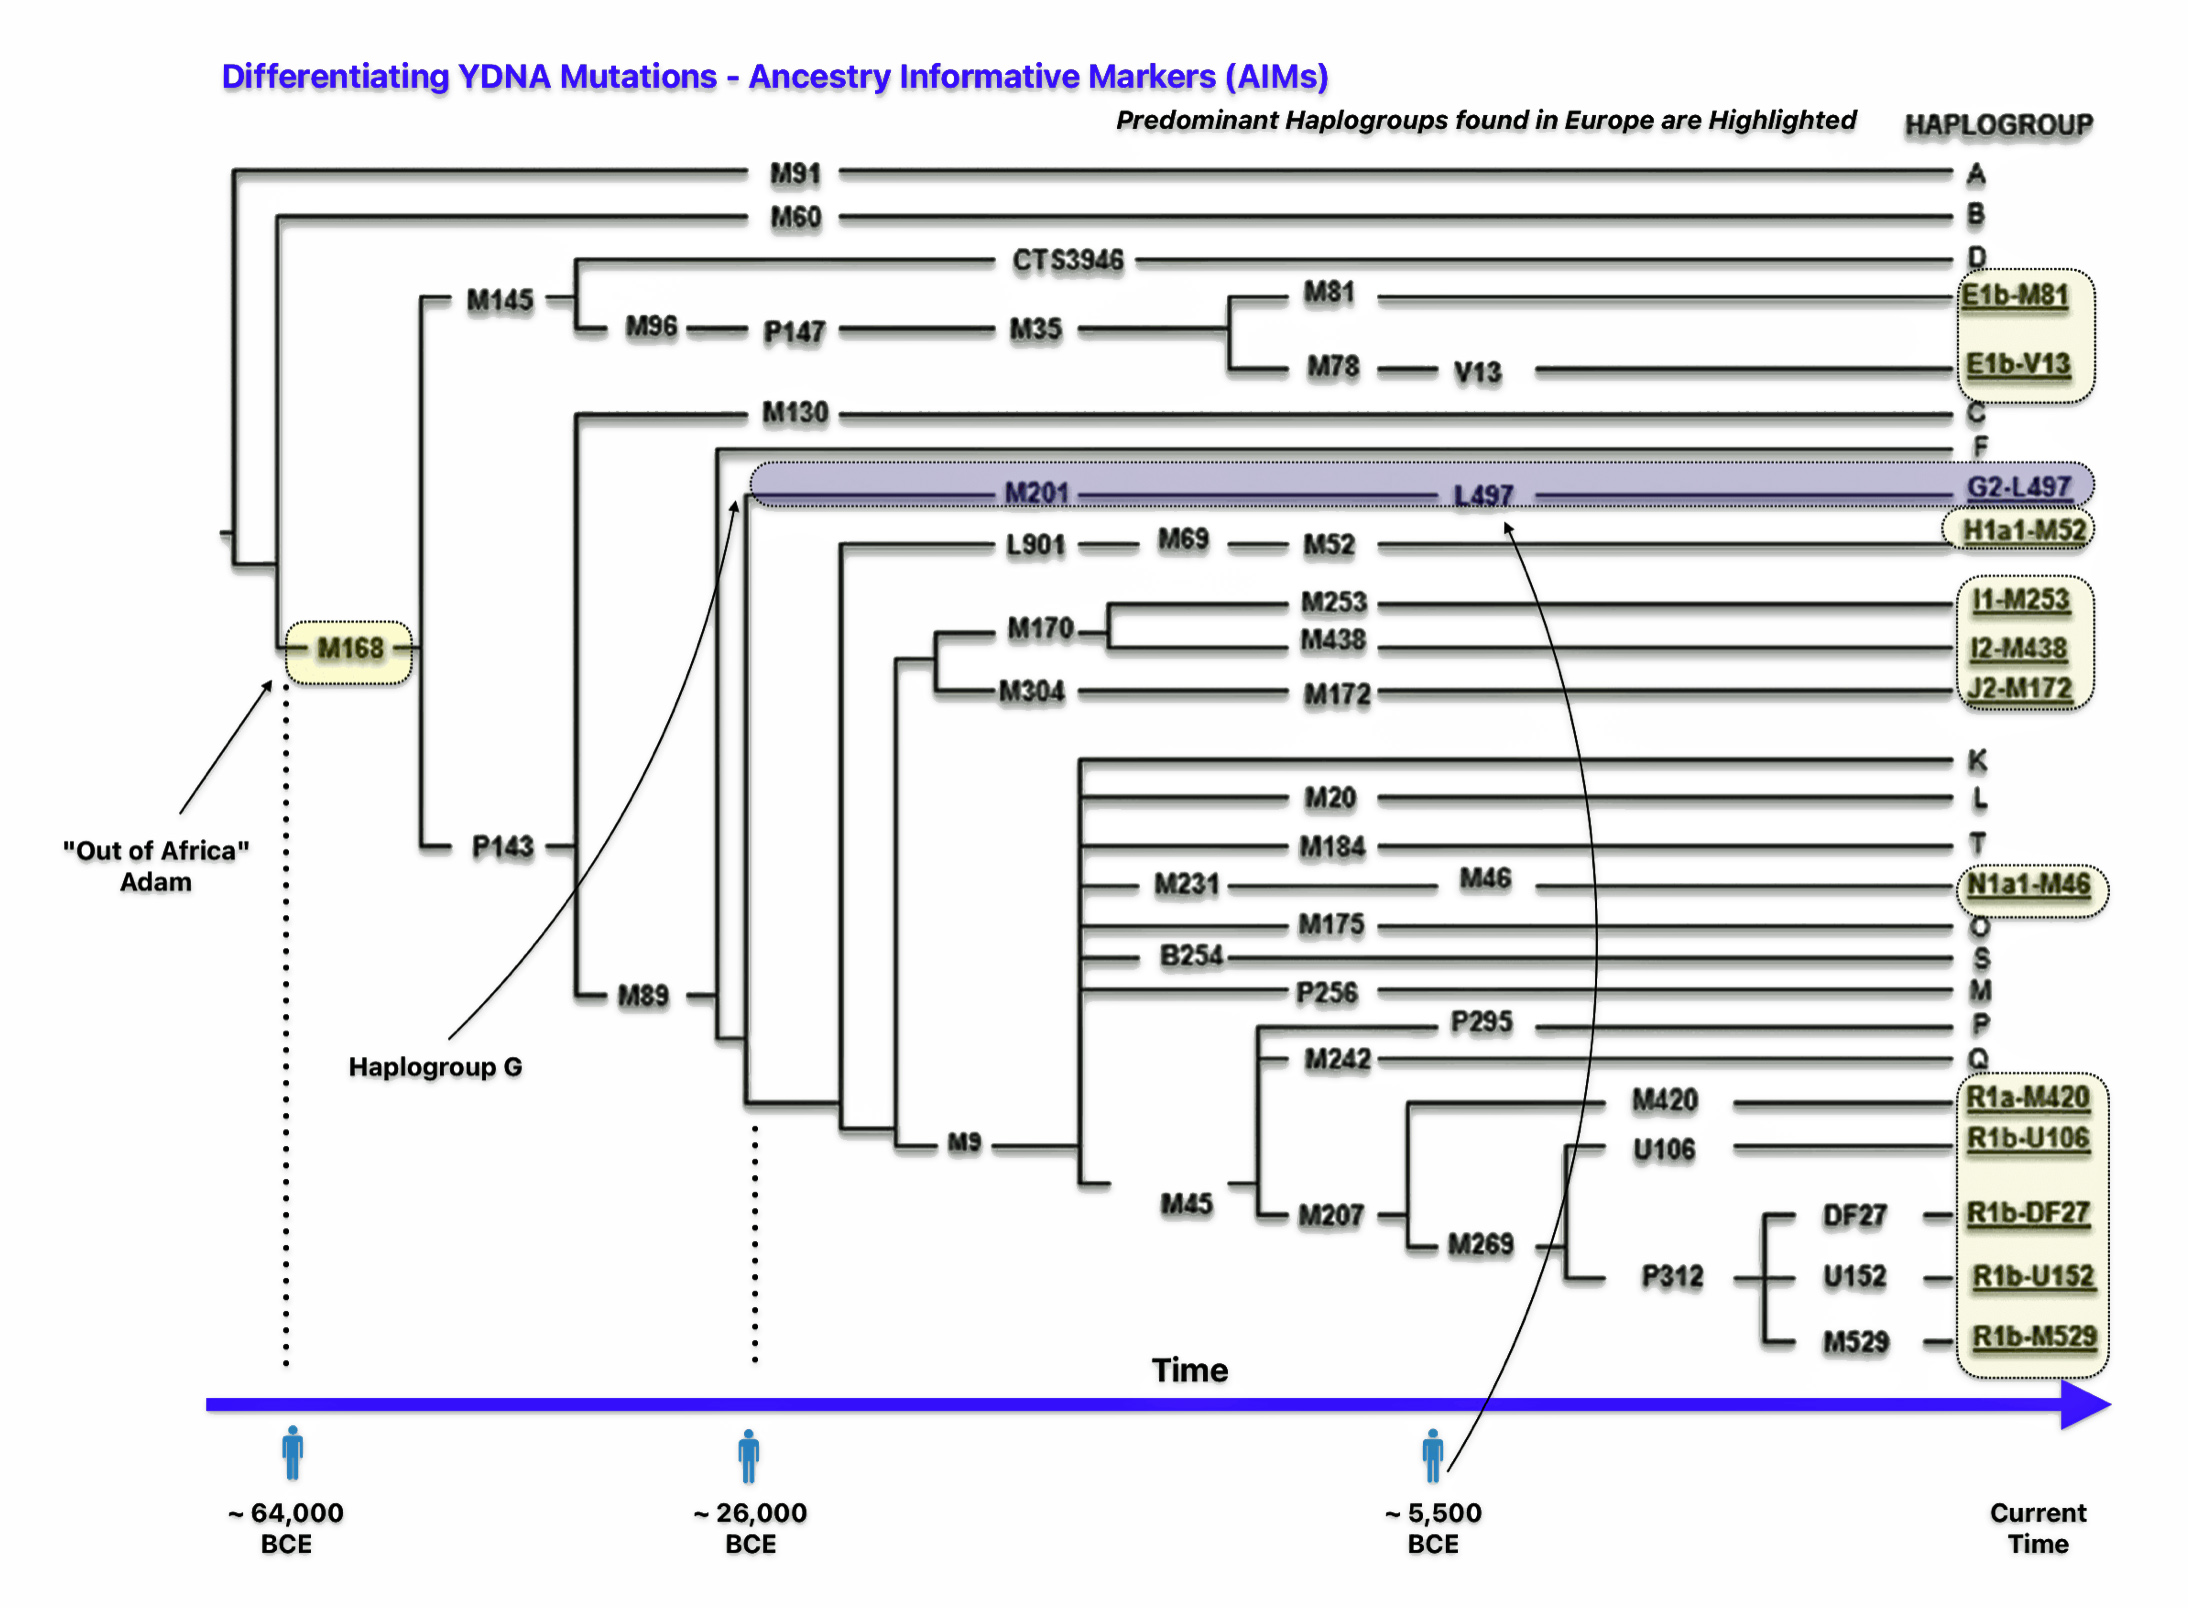
The ancestry-informative marker (AIM) “M168” defines the macro-haplogroup CT and represents the ancestral lineage of all non-African Y-chromosome haplogroups, as well as some African lineages. [15] Every male living today, except those belonging to haplogroups A and B (found exclusively in Africa), carries this genetic marker.
Haplogroup G, which represents the Griff(is)(es)(ith) patenal line, originated in southwestern Asia or the Caucasus region. The estimated date of the G-M201 mutation has been debated, with several different timeframes proposed.
Recent research suggests that the first man to carry haplogroup G-M201 lived between 46,000 and 54,000 years ago in southwestern Asia or the Caucasus region. The National Geographic Society previously estimated its origins in the Middle East 30,000 years ago. Two other studues have suggested 17,000 years ago and a much more recent date of 9,500 years ago. The 9,500-year-old origin date for G-M201 was proposed by Cinnioglu et al. in their 2004 study. However, this estimate appears to be an outlier compared to other research findings and is not well-supported by current evidence. [16]
FamilyTreeDNA estimates the most recent common ancestor associated with the G-M201 haplgroup was born 25,735 BCE rounded to 26,000 BCE. With a 95 percent probability, the most recent common ancestor of all members of this haplogroup was born between the years 29,661 BCE and 22,295 BCE. [17]
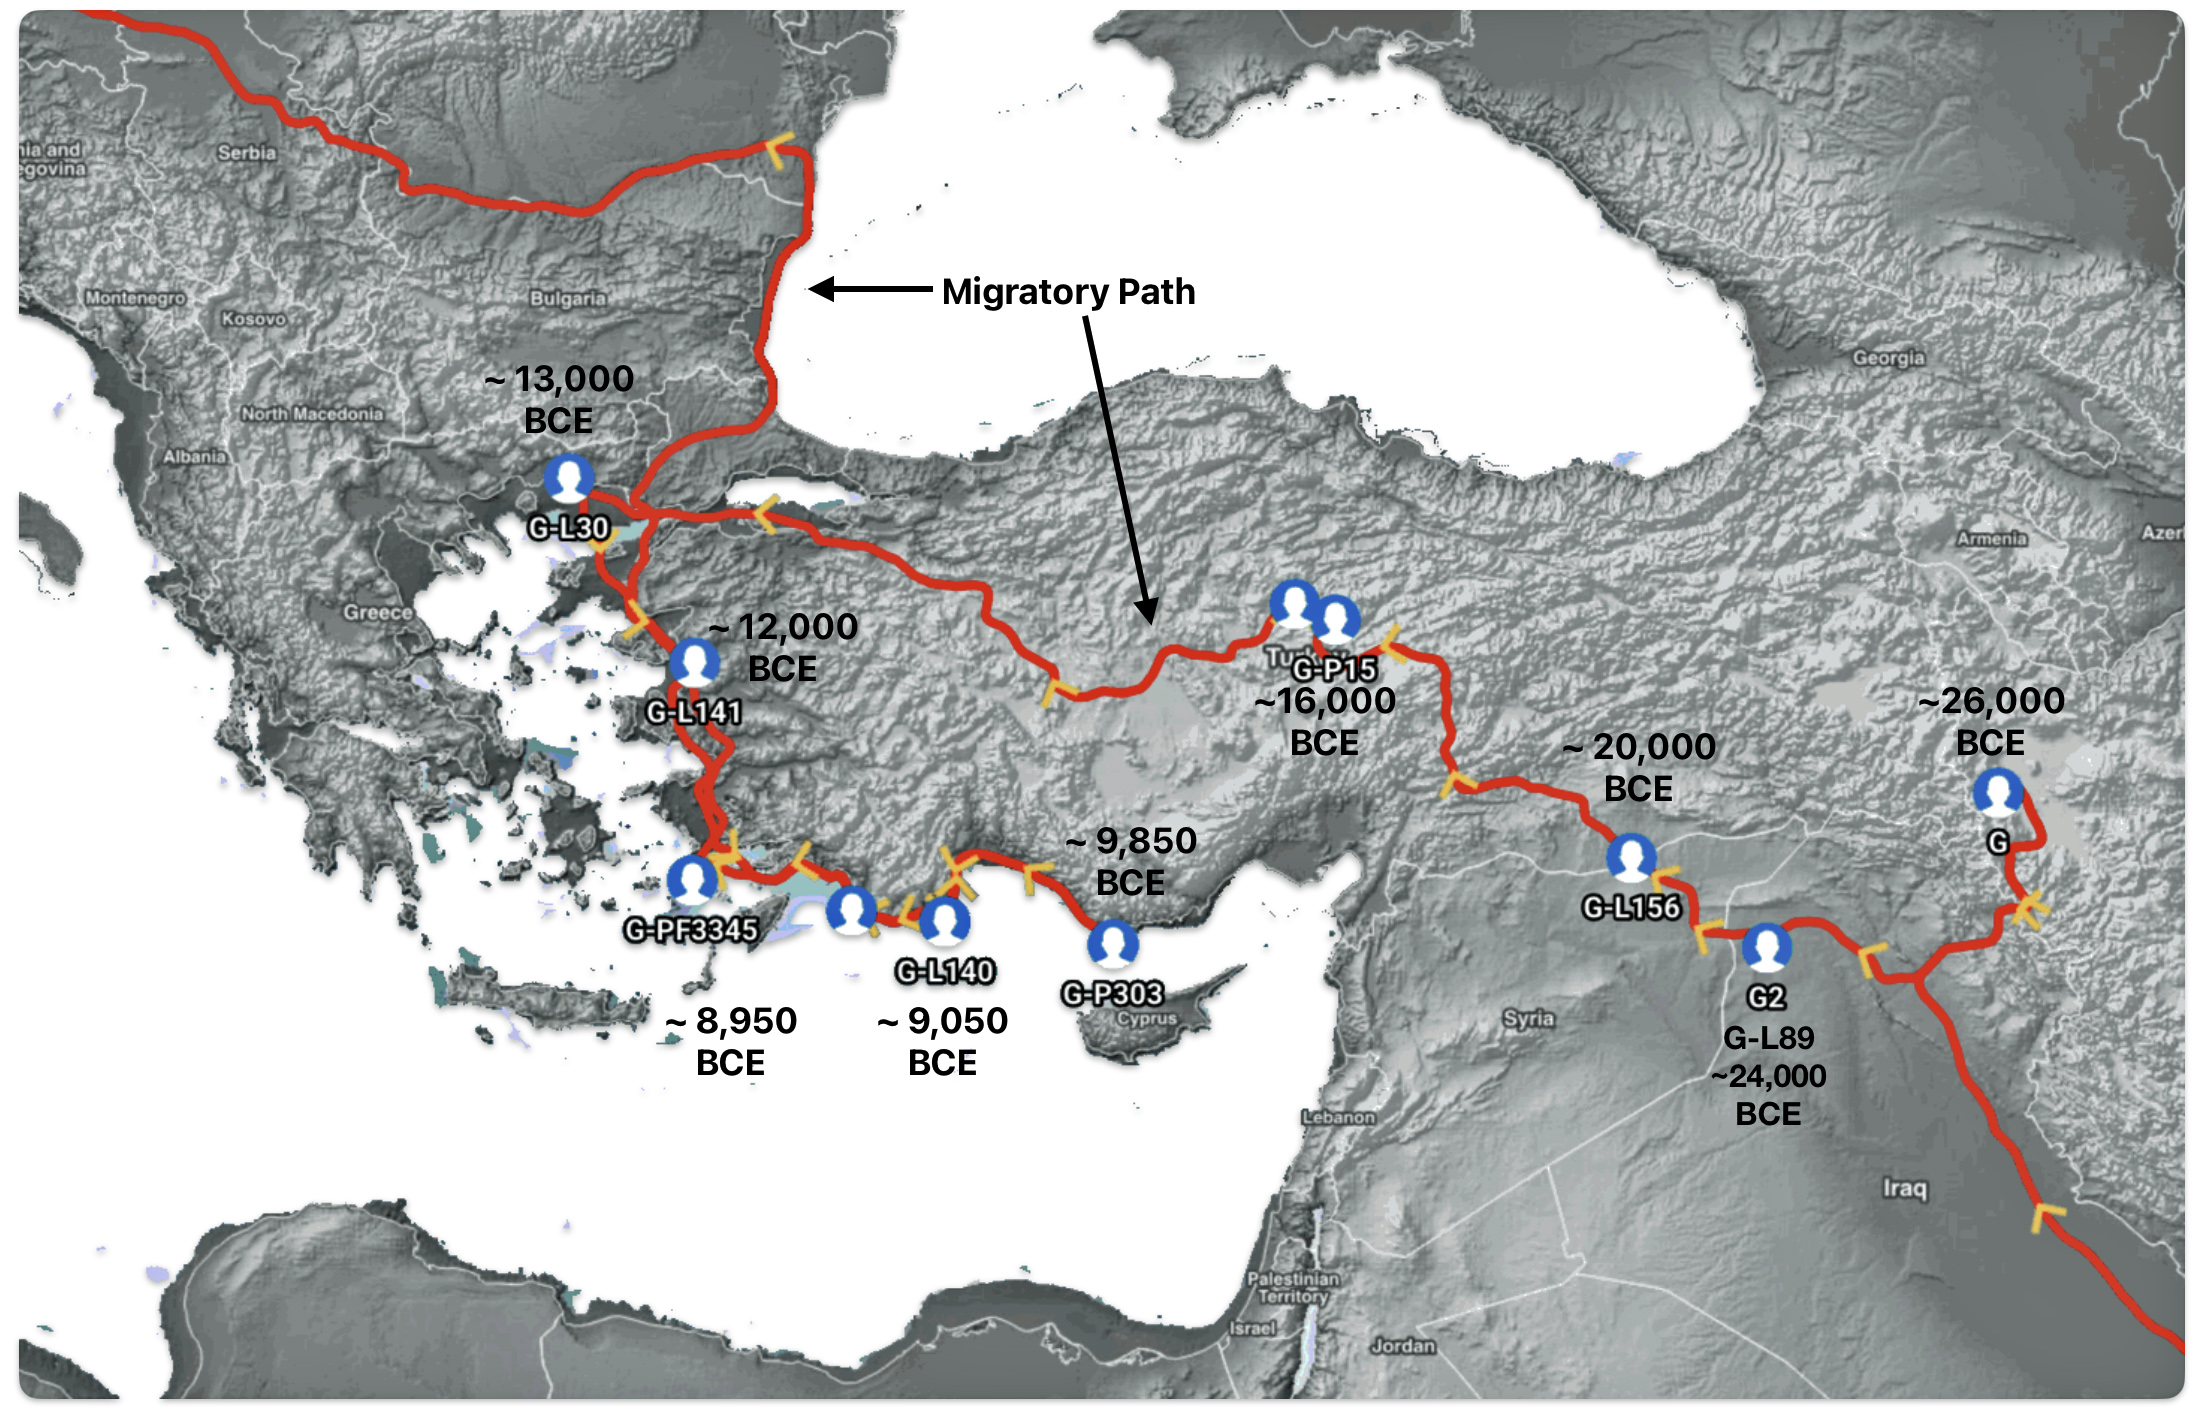
The geographic origin of haplogroup G-M201 is most likely located somewhere near eastern Anatolia, Armenia, or western Iran. (See illustration five.) After remaining relatively isolated during the Ice Age, the haplogroup began expanding significantly around 11,500 years ago with the advent of farming and warmer climate conditions.
Illustration Five: Early Migratory Path of Most Recent Common Ancestors of the G Haplogroup in Anatolia Area
“The Y chromosome has been widely explored for the study of human migrations. Due to its paternal inheritance, the Y chromosome polymorphisms are helpful tools for understanding the geographical distribution of populations all over the world and for inferring their origin, which is really useful in forensics. The remarkable historical context of Europe, with numerous migrations and invasions, has turned this continent into a melting pot. For this reason, it is interesting to study the Y chromosome variability and how it has contributed to improving our knowledge of the distribution and development of European male genetic pool as it is today.” [18]
Anthropological – Macro Cultural Orientation
The anthropological – macro cultural approaches can add historical context to the genealogical discoveries associated with mid range and long term time layers. This macro approach helps bridge genetic data with an anthropological and sociological understanding, as genetic identities are often juxtaposed with socio-political contexts and dynamics. This creates a more complete picture of human population history while acknowledging both biological and cultural factors in human variation. [19]
“Understanding how social and cultural processes affect the genetic patterns of human populations over time has brought together anthropologists, geneticists and evolutionary biologists, and the availability of genomic data and powerful statistical methods widens the scope of questions that analyses of genetic information can answer.” [20]
The anthropological – macro cultural orientation in genetic genealogy represents a comprehensive approach that combines traditional anthropological and demographic methods with modern genetic analysis to understand human populations and their histories at a broader scale. Genetic anthropology examines DNA sequences across diverse populations to determine shared geographical origins and migration patterns. This macro-level analysis helps reconstruct human population histories and relationships between different groups, moving beyond individual genetic ancestry to understand larger historical demographic patterns. [21]
The approach examines and documents broad cultural, political, and economic forces that shape communities and individuals in different time periods. It emphasizes studying the larger structural forces and systems that influence human behavior, moving beyond individual-level analysis to understand societal level patterns, institutions and customs.
The field employs both traditional macromorphoscopic trait analysis and modern genetic testing to create a robust scientific framework. [22] This includes examining population-wide genetic markers (Ancestry Informative Markers – AIMs) , demographic history patterns, DNA derived from ancient populations (aDNA), and social adaptation patterns across groups. [23]
Through their research, genetic anthropologists can determine population relationships, historical fluctuations in size, and admixture patterns between different groups. This helps reconstruct complex migration histories and evolutionary adaptations of human populations. [24]
Several key discoveries have emerged from studying genetic genealogy haplogroups through sociocultural and anthropological approaches. These findings demonstrate how social and cultural practices have been crucial factors in shaping human genetic diversity through their effects on genetic drift and population structure.
For example, the practice of patrilocality [25] has created distinct patterns in genetic diversity between male and female lineages. [26] Cultural organization has significantly impacted genetic patterns, particularly in nomadic populations where tribal-clan structures regulate social order and maintain bloodlines and agricultural communities where different patterns of inheritance and succession emerge. [27]
Historical cultural expansions have had varying genetic impacts. For example, one study found that the Arab Islamic expansion introduced cultural changes but left minimal genetic impact. Conversely, the Mongol expansion achieved significant genetic success while having limited cultural influence. [28]
Different social structures have created distinct genetic patterns in kinship systems. Patrilineal kin groups show accelerated genetic drift and loss of Y-chromosome diversity. Corporate kin groups demonstrate clustering of genetic lineages due to intergroup competition. [29]
Two studies, for example, have found that the mode of subsistence has been more influential than geography in shaping genetic landscapes. Settled agricultural communities show different genetic patterns compared to nomadic populations. Population size in villages affects genetic heterogeneity, with smaller communities showing greater between-village variation. [30]
A 2015 study utilizing an anthropological – macro cultural orientation by Monika Karmin and colleagues presents several significant findings. The researchers analyzed 456 geographically diverse high-coverage Y chromosome sequences, including 299 newly reported samples. Using ancient DNA calibration, they dated the Y-chromosomal most recent common ancestor (MRCA) in Africa at approximately 254,000 years ago. [31]
The study detected a cluster of major non-African founder haplogroups within a narrow time interval of 47-52 thousand years ago (kya), which supports a model of rapid initial colonization of Eurasia and Oceania following the out-of-Africa bottleneck.
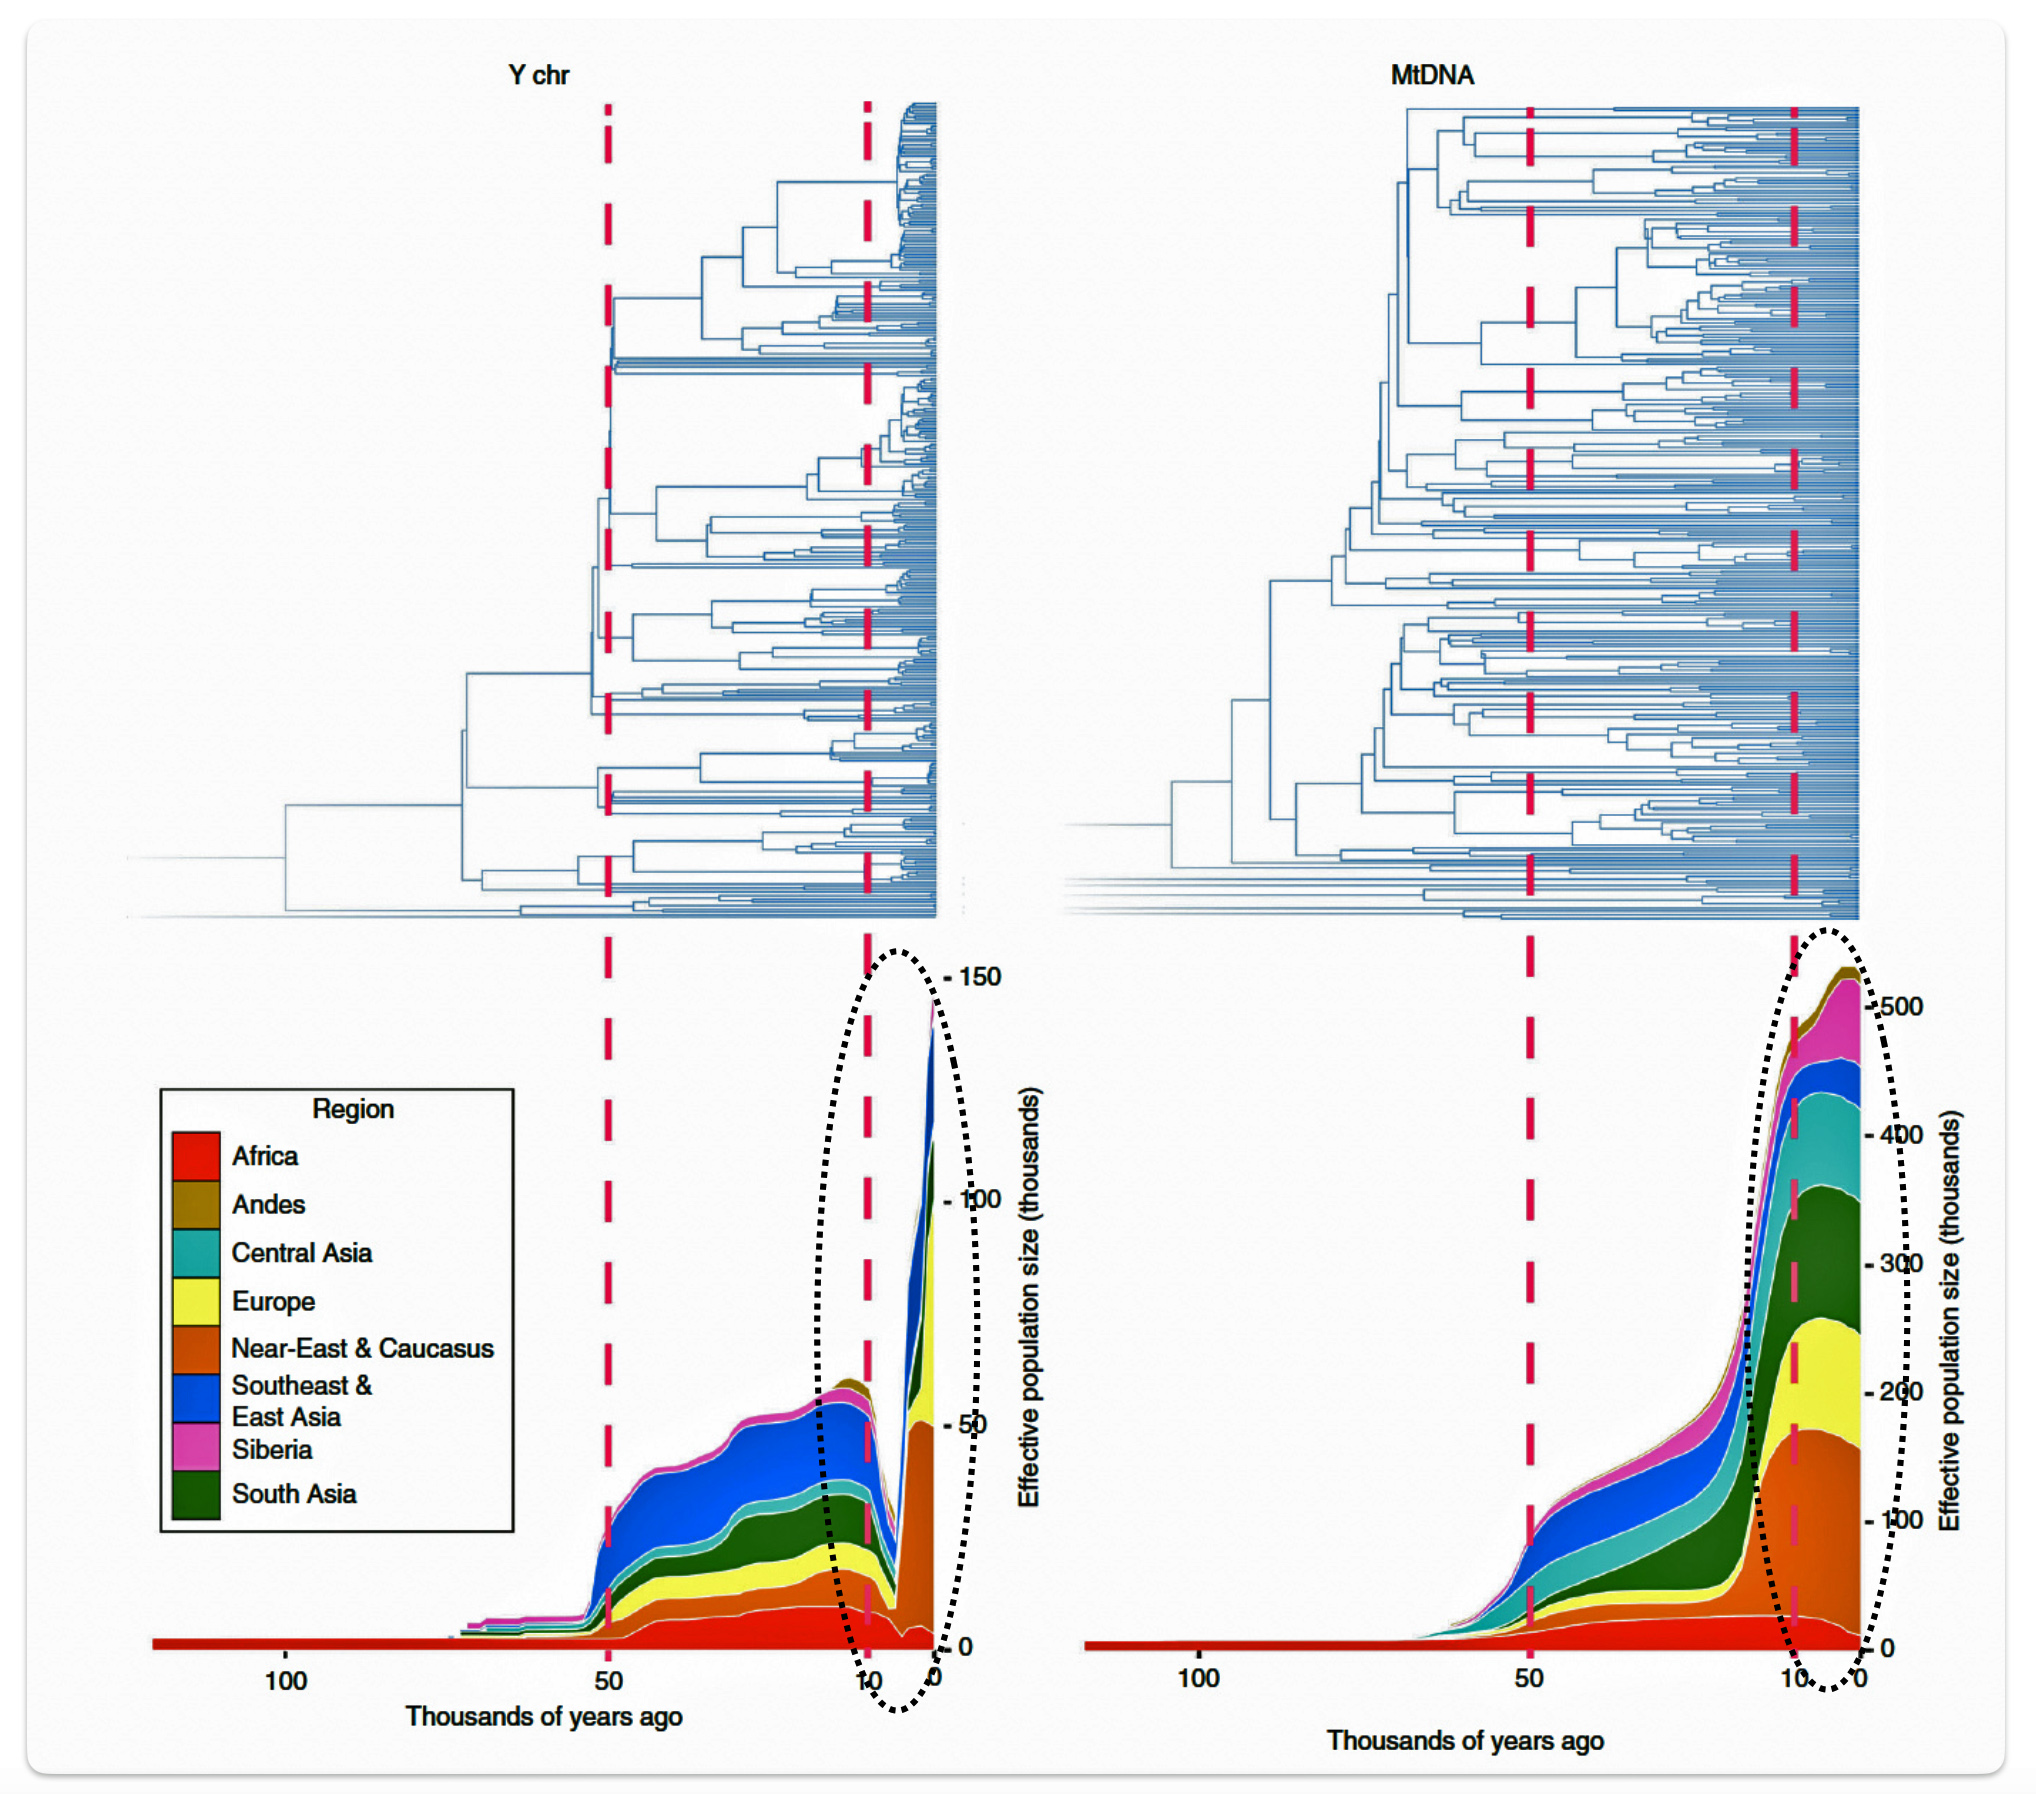
Another key discovery from the Karmin et al study was the detection of a second strong bottleneck in Y-chromosome lineages dating to the last 10,000 years, which contrasts with demographic reconstructions based on mitochondrial DNA (mtDNA). The researchers hypothesize that this recent bottleneck was caused by cultural changes that affected the variance of reproductive success among males. The G haplogroup was impacted by his bottleneck.
The decline in the male effective population size during the Neolithic period was approximately one-twentieth of its original level in various regions of the world. In the same study, mitochondrial sequences indicated a continual increase in population size from the Neolithic to the present, suggesting extreme divergences between the demographic size of male and female populations in the bottleneck period. See illustration six below. Two encircled areas in the illustration graphically identify the growth differences in each of the YDNA and mtDNA graphs.
Illustration Six: Bottleneck of Y Chromosome Diversity Coincides with a Global Change in Culture
Zeng et al.’s 2018 article in Nature Communications presents an intriguing sociocultural hypothesis to explain this post-Neolithic Y-chromosome bottleneck. The authors propose that the formation of patrilineal kin groups and competition between these groups led to a significant reduction in Y-chromosomal diversity through a process called ‘cultural hitchhiking’.
“The outlines of that idea came to Tian Chen Zeng, a Stanford undergraduate in sociology, after spending hours reading blog posts that speculated – unconvincingly, Zeng thought – on the origins of the “Neolithic Y-chromosome bottleneck,” as the event is known. He soon shared his ideas with his high school classmate Alan Aw, also a Stanford undergraduate in mathematical and computational science.” [32]
The pair of students took their idea to Marcus Feldman, a professor of biology in Stanford’s School of Humanities and Sciences and the rest is history. The authors contend that two cultural mechanisms of Y diversity reduction came into play. Patrilineal kin groups naturally produce high levels of Y-chromosomal homogeneity within each group (due to common descent) and high levels of between-group variation. Violent intergroup competition between patrilineal groups resulted in casualties clustering among related males, sometimes leading to the extinction of entire lineages and their unique Y-chromosomes. [33]
“After the onset of farming and herding around 12,000 years ago, societies grew increasingly organized around extended kinship groups, many of them patrilineal clans – a cultural fact with potentially significant biological consequences. The key is how clan members are related to each other. While women may have married into a clan, men in such clans are all related through male ancestors and therefore tend to have the same Y chromosomes.“
“To explain why even between-clan variation might have declined during the bottleneck, the researchers hypothesized that wars, if they repeatedly wiped out entire clans over time, would also wipe out a good many male lineages and their unique Y chromosomes in the process.” [34]
The bottleneck coincides with the post-Neolithic period when societies were at an “intermediate social scale”, after the adoption of agriculture but before the emergence of hierarchical institutions. The authors argue that patrilineal descent groups were most politically salient in these post-Neolithic societies where the social structures were characteristzed as being without a formal leader or governing body. [35]
The bottleneck ended in each region of the Old World during periods that coincided with the rise of regional polities, chiefdoms, and states, which reduced the prominence of corporate kin groups as units of mobilization in intergroup competition.
Genetic and Cultural Hitchhiking
The interplay between genetic and cultural evolution has shaped human diversity in profound ways. Two critical mechanisms—genetic hitchhiking and cultural hitchhiking—explain how neutral or non-adaptive traits can propagate through populations due to their association with advantageous traits – hitchhiking traits. While both processes reduce genetic diversity and leave distinct signatures in the genome, their mechanisms, transmission pathways, and evolutionary implications differ significantly. Hitchhiking models in socially structured populations describe processes where selection on one trait affects the frequency of other traits or genetic elements.
Genetic hitchhiking represents a powerful evolutionary force that can significantly shape haplogroup diversity patterns, sometimes creating genetic signatures that persist long after the original selective events occurred. Genetic hitchhiking, also called genetic drift or the hitchhiking effect, occurs when an allele changes frequency not because it is under natural selection itself, but because it is physically linked to another gene undergoing a selective sweep. [36]
Illustration Seven: Genetic Hitchhiking
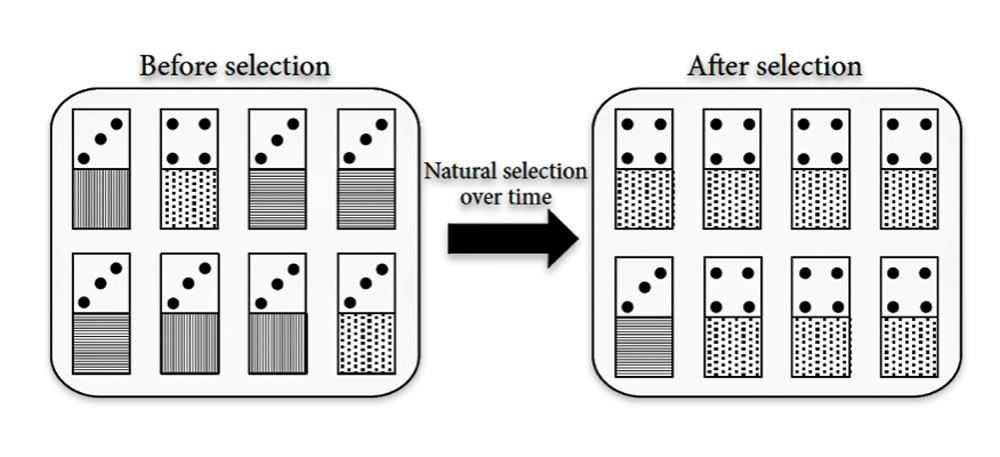
“Genetic hitchhiking: the frequency of a gene could increase in the population due to lying at the same chromosome of another advantageous gene. In these “domino organisms,” the top gene, the number of dots, represents a trait that is advantageous to its carrier, such as resistance to toxins or diseases. Hence, as the domino organisms with the highest dot number get positively selected, their bottom genes, which have no influence on their fitness, also spread in the population.” [37]
Nearby neutral or even slightly deleterious alleles that are in linkage with the selected gene “hitchhike” along with it. The closer a polymorphism is to the gene under selection, the stronger the hitchhiking effect due to less opportunity for recombination. Examples of selective sweeps in humans are in variants affecting lactase persistence, [38] and adaptation to high altitude. [39].
Cultural hitchhiking, originally proposed by Hal Whitehead in 1998 [40], describes how neutral genetic diversity is shaped by cultural selection. Unlike genetic hitchhiking, this process involves the transmission of culturally advantageous traits (e.g., agricultural practices or social norms) that indirectly influence the frequency of genetically neutral alleles through mate choice, social learning, or demographic shifts. Examples of mechanisms and cultural drivers are provided in table one. Examples of the cultural drivers and the resultant genomic and cultural signatures of cultural hitchhiking are provided signatures are provided in table one.
Table One: Examples of Cultural Drivers, Cultural Signatures and Genomic Patterns
| Mechanisms and Cultural Drivers | Description |
|---|---|
| Postmarital Residence Rules | Patrilocal or matrilocal societies influence genetic admixture. For example, patrilocal postmarital residence in farming communities may reduce Y-chromosome diversity due to male-biased migration and cultural resocialization [41] |
| Cultural Selection | Adaptive cultural traits (e.g., slash-and-burn horticulture) alter selection pressures on genes. The spread of farming practices in Neolithic societies increased malaria incidence, favoring the S allele for sickle cell anemia. [42] |
| Genomic and Cultural Signatures: Cultural hitchhiking leaves distinct genomic patterns | Description |
|---|---|
| Mitochondrial and Y-Chromosome Bottlenecks | Reduced diversity in uniparentally inherited loci due to sex-biased cultural practices (e.g., patrilocality) [43] |
| Association with Cultural Artifacts | Neutral traits (e.g., pottery styles) spread alongside adaptive technologies (e.g., agriculture) due to social learning. [44] |
Cultural hitchhiking occurs when neutral genes ‘hitchhike’ to higher frequencies alongside adaptive cultural traits. This process requires specific conditions. Genetic and cultural variants must be transmitted symmetrically (typically vertically from parent to offspring) . Cultural traits must create heritable variation in reproductive success or survival between different groups . Cultures must be stable and not frequently transfer between population segments. [45]
A related process called culturally mediated migration occurs when culture creates barriers within a population that inhibit dispersal and mating. This process reduces diversity of both neutral and functional genes through bottlenecks and selection ; can interact with competitive social dynamics, as seen in patrilineal kin groups ; and requires cultures that affect dispersal patterns and remain relatively stable. [46]
These models are significant because they help explain how social structure and cultural transmission can shape genetic diversity in both human and non-human populations.
Beware of Imputing Cause and Correlation between Genetic and Cultural Genealogical Orientations
The relationship between genetic and cultural inheritance is complex and bidirectional. Genetic propensities influence what cultural elements individuals learn, while culturally transmitted information affects selection pressures, such as marriage traditions, on populations.
“Genes and culture represent two streams of inheritance that for millions of years have flowed down the generations and interacted. Genetic propensities, expressed throughout development, influence what cultural organisms learn. Culturally transmitted information, expressed in behaviour and artefacts, spreads through populations, modifying selection acting back on populations.” [47]
Cultural and genetic genealogy are two distinct but related aspects of genealogy. Various migratory patterns associated with Y-DNA haplogroups do not necessarily imply that they coincide with macro-level, cultural geographical patterns or movements of people. Migratory patterns of Y-DNA Haplogroups undoubtably contained a mix of haplogroups. The migratory groups undoubtably were characterized by various cultural patterns, ptrsctices and behaviors. But Y-DNA haplogroups also were represented in various historical cultures. Many cultures invariably contained genetic mixtures of haplogroups at various periods of time.
Various theories have been formed that describe large cultural groups and major population movements where most of the members of a genetic haplogroup may have lived and traveled. Common genetic ancestors with matches from these time periods can be mapped and described but any information about where these ancestors lived and migrated is gained from these studies doe not necessaily mean that they are connected to our family history.
There is no direct evidence that our individual ancestors were part of the same culture or migration patterns that are documented in paleogenomics and gnetic anthropological studies. We can not definitively associate deep ancestry haplogroups with historical cultures. However, the results of these multidisciplinary studies can provide a backdrop for interpreting or providing meaning and context to our haplogroup tree.
Ecological Fallacies Can Emerge When Analyzing Y-DNA Migration Patterns
An ecological fallacy is a logical error that occurs when conclusions about individuals are incorrectly drawn from group-level or aggregate data. This fallacy arises when characteristics of a population as a whole are mistakenly attributed to individuals within that population without demonstrating any real connection. [48]
The ecological fallacy can significantly impact the interpretation of Y-DNA migration patterns and haplotree analyses in several key ways. The primary ecological fallacy occurs when making inferences about individual migrations based on population-level Y-DNA patterns. Just because a haplogroup shows a particular geographic distribution pattern at the population level does not necessarily mean that our individual ancestors followed those exact migration routes. [49]
Two major temporal fallacies can emerge when comparing DNA composition with present day patterns and historic patterns. . The presence of a haplogroup in a modern population does not necessarily indicate when that lineage first arrived in a region. High frequencies of particular SNPs in current populations may not reflect historical frequencies, as ancient populations could have had different distributions. [50]
The assumption that current geographic distributions of Y-DNA haplogroups directly map to ancient migration routes can be fallacious. Population bottlenecks, founder effects, and later migrations can dramatically reshape haplogroup distributions. [51]
A reliable way to overcome ecological fallacies is to supplement population-level data with individual-level evidence. This requires integrating archaeological, historical, and genetic data at multiple scales of analysis. [52]
As genetic processes are inherently stochastic, patterns of genetic variation only indirectly reflect demographic histories, requiring careful inferential approaches. Lisa Loog’s 2020 article underscors this point by reviewing fundamental models and assumptions that underlie common approaches for inferring past demographic events from genetic data. All inferential approaches require assumptions about the data and underlying demographic processes, which significantly affect the interpretation of results. [53]
Loog discusses several important methodological issues:
- Phylogenetic Analysis Limitations: Events in phylogenetic trees based on single loci do not directly correspond to population-level events due to their stochastic nature. Different demographic scenarios can produce similar gene trees (equifinality).
- Principal Component Analysis (PCA) Issues: PCA, an approach used in many paleogenomic studies lacks an underlying population genetic model, making it problematic for demographic inference. Similar distributions of samples on PCs can result from entirely different demographic histories.
- Clustering Method Problems: Statistical clusters are often mistakenly interpreted as evidence of “ancestral” or “source” populations when multiple distinct demographic histories could explain such clusters.
Loog’s article highlights how non-random sampling can significantly affect demographic inference. Archaeological specimens and museum collections are particularly susceptible to sampling bias due to preservation issues and non-random excavation patterns.
Loog’s analysis emphasizes that robust demographic inference requires formal comparison of alternative hypotheses formulated as different demographic scenarios. This allows assessment of the importance of different processes in population history.
Dangers of Attributing Cultural Factors with Haplogroups
Attributing ancient cultural traits to haplogroup migratory paths involves several potential fallacies and misconceptions. While genetic data provides valuable insights into human history, attributing cultural traits solely to haplogroup migrations oversimplifies complex historical processes. Cultural transmission, sociocultural practices, selection, drift, and non-random mating patterns all contribute to the complex relationship between genes and culture. A more nuanced approach recognizes that genetic and cultural histories, while sometimes parallel, often follow independent paths.
Genes and culture are not necessarily aligned. They follow different evolutionary trajectories. Languages and cultural practices evolve differently than genes, and while they may sometimes indicate common ancestry, they often develop independently6. Cultural innovations can significantly influence genetic diversity patterns without requiring population replacement. [54]
The relationship between genetic markers and cultural traits is rarely straightforward. Archaeological evidence often shows that contact between culturally distinct groups (like farmers and hunter-gatherers) led to substantial cultural changes without corresponding genetic shifts. Cultural diffusion can occur without significant genetic admixture, and vice versa. [55]
The presence of a haplogroup in multiple regions doesn’t necessarily indicate a single migration event or cultural connection. Haplogroups can arise before migration events and spread through multiple independent pathways . For example, if a haplogroup originated 20,000 years ago but a migration occurred 10,000 years ago, the haplogroup could potentially be found on both sides of the migration route. [56]
Sociocultural practices like postmarital residence patterns, linguistic exogamy, and gender-specific roles can dramatically shape genetic diversity independent of large-scale migrations. Studies of Native American populations show that sociocultural factors have played a more important role than language or geography in determining genetic structure. [57]
The coincidence of genetic and cultural changes doesn’t necessarily imply a causal relationship. For instance, the Avar migration into East Central Europe demonstrates how perceptions of people as “Avars” in historical texts, cultural unification, and genetic admixture did not follow analogous rhythms, leading to diverse genetic ancestry in different local communities despite shared cultural identity [58]
Many historical migrations show sex-biased patterns, with different male and female genetic histories. For example, in Native American populations, European admixture occurred primarily between European men and indigenous women4, creating discrepancies between mitochondrial DNA and Y-chromosome patterns. [59]
Genetic markers can be affected by natural selection and genetic drift, which can create patterns that mimic migration effects. These processes can lead to complicated cline shapes in marker frequencies that are unrelated to cultural diffusion. [60]
Human reproduction is not a uniform random process but is channeled through kinship systems, marriage rules, and social meanings of birth8. Even when different groups share cultural practices, their reproductive choices may maintain genetic differences rather than lead to homogenization. [61]
Admixture Events Complicate Attribution of Cultural Traits to Specific Haplogroups
Admixture events create complex genetic landscapes that make simple haplogroup-culture associations problematic. When populations merge, the resulting genetic profile becomes a mosaic of different ancestral contributions, with some individuals carrying haplogroups from one ancestral population while adopting cultural practices from another. For example, the genetic composition of present-day Europeans reflects multiple prehistoric migrations and admixture events, making it impossible to attribute specific cultural developments solely to particular haplogroups.
Admixture events typically involve cultural exchange that operates independently from genetic exchange. When populations meet and mix, cultural traits can be selectively adopted, modified, or rejected regardless of genetic inheritance patterns. The spread of farming across Europe illustrates this complexity – while there was some genetic contribution from Near Eastern farmers, the cultural practice of agriculture spread more widely than the genetic signature, as local hunter-gatherers adopted farming without complete genetic replacement.
The timing of genetic admixture and cultural change often does not align. Cultural traits may be adopted long before or after genetic admixture occurs, creating a ‘temporal disconnect’ that makes attributing cultural traits to specific haplogroups problematic. For instance, the adoption of Indo-European languages in Europe did not always coincide with significant genetic changes, as evidenced by regions where language shifted while genetic composition remained relatively stable. [62]
Genetic material and cultural traits follow different inheritance patterns. While haplogroups are inherited strictly through biological lines (Y-chromosome haplogroups paternally and mtDNA haplogroups maternally), cultural traits can be transmitted horizontally across populations and vertically between generations through non-genetic means. This fundamental difference means that cultural traits can spread widely without corresponding genetic changes.
Many historical admixture events show strong sex biases, with genetic contributions predominantly from males or females of one population. These sex-biased patterns create discrepancies between different genetic markers (autosomal DNA, Y-chromosome, mtDNA) and further complicate cultural attributions.
Source:
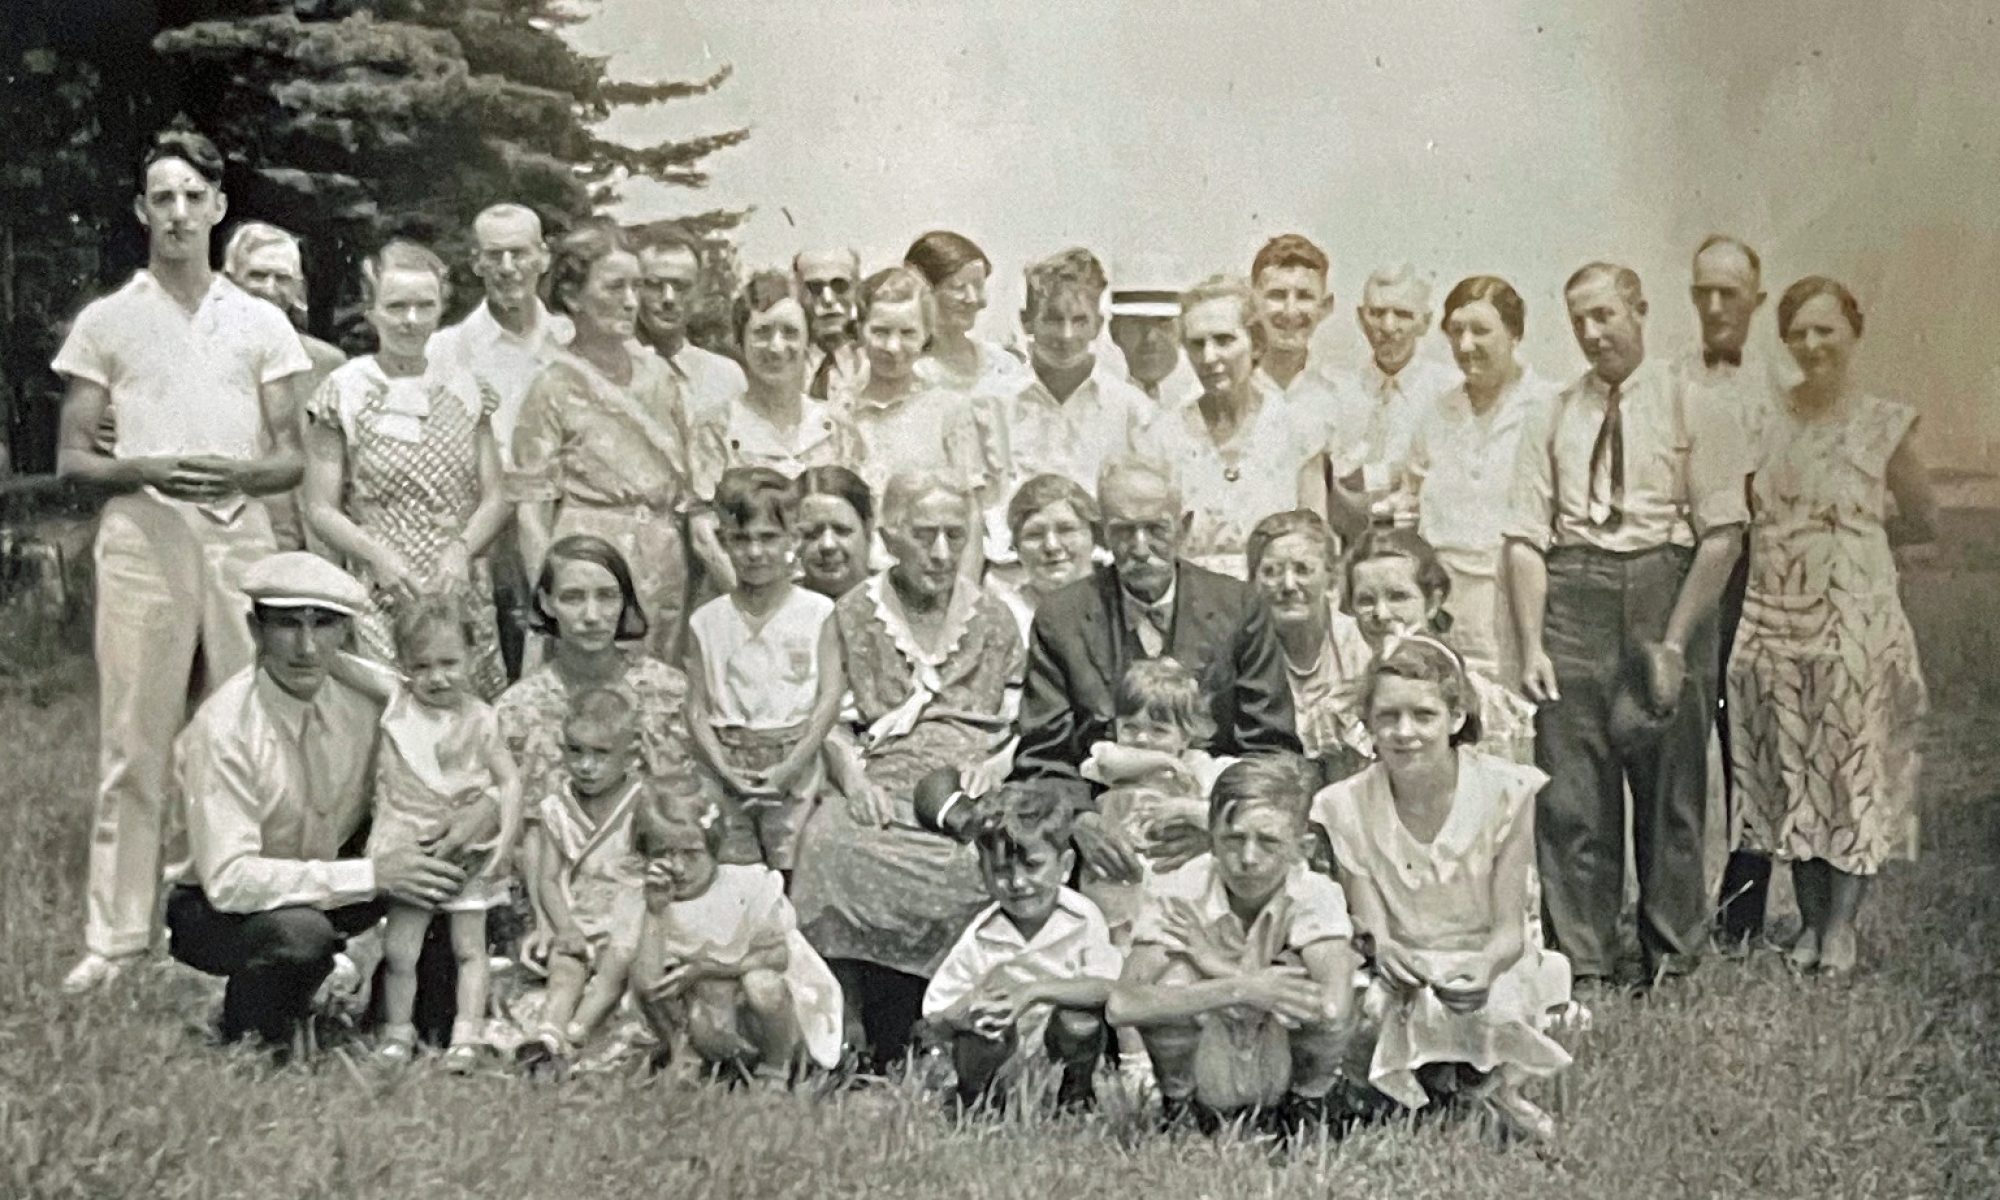
Feature Banner: The banner at the top of the story is an amalgam of two illustrations.
The illustration on the left is part of a chart that represents an haplotree of paternal descent. The blue lines represent the path or lineage of Y-SNP mutations of Y-DNA tests. The other lines represent lineages that have been undiscovered. On the left hand side of the haplotree are two bar graphs that illustrate how far back Y-STR and Y-SNP test results can be utilized to analyze lineages. The bottom of the illustration reflect the extent to which traditional family trees reach in the past. This illustration was created by Mike Walsh, project administrator of the FamilyTreeDNA R1b-L513 working group. It is presented in Vance’s introductory YourTube discussion of Y-DNA. J. David Vance, Transcript of DNA Concepts for Genealogy Y-DNA, 2019, Page 11, https://drive.google.com/file/d/1CdUB4AmB1UYff5fmKtoKiqp6nG_gom37/view
The right hand portion of the banner is a chart that depicts the predominant orientation of a genealogical narrative in each layer of time.
[1] Mitochondrial DNA (mtDNA) testing analyzes DNA found in the mitochondria of cells, which is passed down exclusively from mothers to their children. This type of DNA testing provides specific information about a person’s maternal ancestry and has several distinctive characteristics. mtDNA exists separately from nuclear DNA, representing one of two genomes in mammalian cells. Both males and females inherit mtDNA, but only females can pass it to their children. Maternal relatives across multiple generations share identical mtDNA sequences, barring mutation.
Amorim A, Fernandes T, Taveira N. Mitochondrial DNA in human identification: a review. PeerJ. 2019 Aug 13;7:e7314. doi: 10.7717/peerj.7314. PMID: 31428537; PMCID: PMC6697116, https://pmc.ncbi.nlm.nih.gov/articles/PMC6697116/
Mitochondrial DNA tests, This page was last edited on 13 February 2021, International Society of Genetic Gnealogists Wiki, https://isogg.org/wiki/Mitochondrial_DNA_tests
[2] Y-DNA testing analyzes genetic information on the Y chromosome, which passes exclusively from fathers to sons. Y chromosome passes unchanged from father to son through generations. Only males possess and can pass on Y-DNA, making it useful for tracing paternal lineages. Unlike other chromosomes, Y-DNA undergoes minimal genetic recombination during reproduction.
[3] See my story: Y-DNA and the Griffis Paternal Line Part Three: The One-Two Punch of Using SNPs and STRs February 23, 2023
[4] Genetic drift is a fundamental evolutionary mechanism where random chance causes changes in the frequency of gene variants (alleles) within a population over time. This process occurs through random sampling of genes passed from one generation to the next, rather than through natural selection. This randomness can lead to some genetic variants becoming more common while others disappear entirely from the population.
Genetic drift has a stronger impact on smaller populations. In small groups, the loss or increase of particular genetic variants happens more quickly and dramatically than in larger populations.
Population bottlenecks are a type of geneetic drift. They occur when a population’s size is suddenly and dramatically reduced, such as through a natural disaster or overhunting. The surviving individuals may carry only a fraction of the original population’s genetic diversity.
Another example of genetic drift is a founder effect. Founder effects occur when a small group separates from a larger population to establish a new colony, they carry only a subset of the original population’s genetic diversity. This limited genetic pool becomes the foundation for the new population.
Rotimi, Charles, Genetic Drift, National Human Genome Research Institute, https://www.genome.gov/genetics-glossary/Genetic-Drift
Andrews, Christine A. (2010) Natural Selection, Genetic Drift, and Gene Flow Do Not Act in Isolation in Natural Populations. Nature Education Knowledge 3(10):5, https://www.nature.com/scitable/knowledge/library/natural-selection-genetic-drift-and-gene-flow-15186648/
Genetic Drift, Wikipedia, This page was last edited on 29 January 2025, https://en.wikipedia.org/wiki/Genetic_drift
Bohonak, Andrew J., Genetic Drift in Human Populations, Genetic Drift in Human Populations. In: Encyclopedia of Life Sciences (ELS), John Wiley & Sons, Ltd: Chichester. April 2018, DOI: 10.1002/9780470015902.a0005440.pub2, https://biology.sdsu.edu/pub/andy/Bohonak2008.pdf
[5] David Reich, Who We are and How We got Here, Ancient DNA and the New Science of the Human Past, New York: Vintage Books, 2018
Kivisild T. The study of human Y chromosome variation through ancient DNA. Hum Genet. 2017 May;136(5):529-546. doi: 10.1007/s00439-017-1773-z. Epub 2017 Mar 4. Erratum in: Hum Genet. 2018 Oct;137(10):863. doi: 10.1007/s00439-018-1937-5. PMID: 28260210; PMCID: PMC5418327, https://pmc.ncbi.nlm.nih.gov/articles/PMC5418327/
[6] Paleogenomics, Wikipedia, This page was last edited on 16 December 2023, https://en.wikipedia.org/wiki/Paleogenomics
High-throughput sequencing (HTS) is a revolutionary technology that enables rapid, parallel sequencing of millions of DNA and RNA molecules simultaneously13. This massively parallel approach represents a significant advancement over traditional Sanger sequencing methods, offering unprecedented speed, scale, and cost-effectiveness
[7] High-throughput sequencing (HTS) is a technology that enables rapid, parallel sequencing of millions of DNA and RNA molecules simultaneously. This massively parallel approach represents a significant advancement over traditional Sanger sequencing methods, offering unprecedented speed, scale, and cost-effectiveness in analying human genomes.
High-Throughput Sequencing: Definition, Technology, Advantages, Application and Workflow, CD Genomics, https://www.cd-genomics.com/resource-comprehensive-overview-high-throughput-sequencing.html
Churko JM, Mantalas GL, Snyder MP, Wu JC. Overview of high throughput sequencing technologies to elucidate molecular pathways in cardiovascular diseases. Circ Res. 2013 Jun 7;112(12):1613-23. doi: 10.1161/CIRCRESAHA.113.300939. PMID: 23743227; PMCID: PMC3831009, https://pmc.ncbi.nlm.nih.gov/articles/PMC3831009/
Tamang, Sanju, ed., Aryal, Sager, High Throughput Sequencing (HTS): Principle, Steps, Uses, Diagram, 9 Sep 2024, Microbe Notes, https://microbenotes.com/high-throughput-sequencing-hts/
What is next-generation sequencing?, Illumina, https://www.illumina.com/science/technology/next-generation-sequencing.html
Imanian, B., Donaghy, J., Jackson, T. et al. The power, potential, benefits, and challenges of implementing high-throughput sequencing in food safety systems. npj Sci Food 6, 35 (2022). https://doi.org/10.1038/s41538-022-00150-6
Lee JY. The Principles and Applications of High-Throughput Sequencing Technologies. Dev Reprod. 2023 Apr;27(1):9-24. doi: 10.12717/DR.2023.27.1.9. Epub 2023 Mar 31. PMID: 38075439; PMCID: PMC10703097, https://pmc.ncbi.nlm.nih.gov/articles/PMC10703097/
[8] Kivisild, Toomas, The study of human Y chromosome variation through ancient DNA. Hum Genet. 2017 May;136(5):529-546. doi: 10.1007/s00439-017-1773-z. Epub 2017 Mar 4. Erratum in: Hum Genet. 2018 Oct;137(10):863. doi: 10.1007/s00439-018-1937-5. PMID: 28260210; PMCID: PMC5418327, https://pubmed.ncbi.nlm.nih.gov/28260210/
[9] David Reich, Who We are and How We got Here, Ancient DNA and the New Science of the Human Past, New York: Vintage Books, 2018
Michael Hofreiter, Johanna L. A. Paijmans, Helen Goodchild, Camilla F. Speller, Axel Barlow, Gloria G. Fortes, Jessica A. Thomas, Arne Ludwig and Matthew J. Collins, The future of ancient DNA: Technical advances and conceptual shifts, Bio Essays 37 (3) Nov 2015. original publication Nov 21 2014, https://www.researchgate.net/publication/268579140_The_future_of_ancient_DNA_Technical_advances_and_conceptual_shifts
Chinese Academy of Sciences, Researchers chart advances in ancient DNA technology July 21 2022, Phys.org, https://phys.org/news/2022-07-advances-ancient-dna-technology.html
Lorelei Verlhac, DNA and New Technologies: Is Paleogenomics the Future of Archiealology?, Byacardia,https://www.byarcadia.org/post/dna-and-new-technologies-is-paleogenomics-the-future-of-archaeology
Tsosie KS, Begay RL, Fox K, Garrison NA. Generations of genomes: advances in paleogenomics technology and engagement for Indigenous people of the Americas. Curr Opin Genet Dev. 2020 Jun;62:91-96 https://www.ncbi.nlm.nih.gov/pmc/articles/PMC7484015/
Evan K Irving-Pease, Rasa Muktupavela, Michael Dannermann, Fernando Racimo, Quantitative Human Paleogenetics: What can Ancient DNA Tell Us About Complex Trait Evolution?, Frontiers in Genetics, Aug 2021, Volume 12 Article 703541, https://www.frontiersin.org/articles/10.3389/fgene.2021.703541/full
Hodan, George, Most European men descend from a handful of Bronze Age forefathers, 19 May 2015, Phys.org, https://phys.org/news/2015-05-european-men-descend-bronze-age.html
Forbes. Peter, What Ancient DNA says about us, 2 Jul 2018, New Humanist, https://newhumanist.org.uk/articles/5335/what-ancient-dna-says-about-us
[10] Reich, David, Ancient DNA and the New Science of the Human Past, 3 Mar 2021, Simon’s Foundation Presidential Lectures, https://www.simonsfoundation.org/event/ancient-dna-and-the-new-science-of-the-human-past/
[11] Moore’s Law refers to Gordon Moore’s perception that the number of transistors on a microchip doubles every two years, though the cost of computers is halved. Moore’s Law states that we can expect the speed and capability of our computers to increase every couple of years, and we will pay less for them. Another tenet of Moore’s Law asserts that this growth is exponential.
Moore’s Law, Wikipedia, page last updated 23 Sep 2022, https://en.wikipedia.org/wiki/Moore%27s_law
For a related discussion on the improvements in DNA sequencing technologies and data-production pipelines in recent years, see:
Kris A. Wetterstrand, DNA Sequencing Costs: Data, 2022, National Humane Genome Research Institute, https://www.genome.gov/about-genomics/fact-sheets/DNA-Sequencing-Costs-Data
[12] Paleogenomics, Wikipedia, This page was last edited on 16 December 2023, https://en.wikipedia.org/wiki/Paleogenomics
[13] Curry, Andrew, The First Europeans Weren’t Who Your Might Think, National Geographic Magazine, August 2019, online: first-europeans-immigrants-genetic-testing-feature
[14] Karafet, T., Mendez, F., Sudoyo, H. et al. Improved phylogenetic resolution and rapid diversification of Y-chromosome haplogroup K-M526 in Southeast Asia. Eur J Hum Genet23, 369–373 (2015). https://doi.org/10.1038/ejhg.2014.106
Haplogroup CT, Wikipedia, This page was last edited on 5 July 2024, https://en.wikipedia.org/wiki/Haplogroup_CT
[15] Scozzari R, Massaia A, D’Atanasio E, Myres NM, Perego UA, Trombetta B, et al. (2012) Molecular Dissection of the Basal Clades in the Human Y Chromosome Phylogenetic Tree. PLoS ONE 7(11): e49170. https://doi.org/10.1371/journal.pone.0049170
[16] Haplogroup G-M201, Wikipedia, This page was last edited on 24 January 2025, https://en.wikipedia.org/wiki/Haplogroup_G-M201
“Atlas of the Human Journey: Haplogroup G (M201)”, National Geographic. Archived from the original on 5 February 2011. Retrieved 25 March 2023
Ancestral Path Chart for Haplogroup BY211678, G-M201 Haplogroup, FamilyTreeDNA, 22 Feb 2025, https://discover.familytreedna.com/y-dna/G-BY211678/path
Cinnioğlu C, King R, Kivisild T, Kalfoğlu E, Atasoy S, Cavalleri GL, Lillie AS, Roseman CC, Lin AA, Prince K, Oefner PJ, Shen P, Semino O, Cavalli-Sforza LL, Underhill PA. Excavating Y-chromosome haplotype strata in Anatolia. Hum Genet. 2004 Jan;114(2):127-48. doi: 10.1007/s00439-003-1031-4. Epub 2003 Oct 29. PMID: 14586639, https://pubmed.ncbi.nlm.nih.gov/14586639/
Semino O, Passarino G, Oefner PJ, Lin AA, Arbuzova S, Beckman LE, De Benedictis G, Francalacci P, Kouvatsi A, Limborska S, Marcikiae M, Mika A, Mika B, Primorac D, Santachiara-Benerecetti AS, Cavalli-Sforza LL, Underhill PA (November 2000). “The genetic legacy of Paleolithic Homo sapiens sapiens in extant Europeans: a Y chromosome perspective”. Science. 290 (5494): 1155–9. Bibcode:2000Sci…290.1155S. doi:10.1126/science.290.5494.1155. PMID 11073453
[17] Haplogroup G-M201, Wikipedia, This page was last edited on 24 January 2025, https://en.wikipedia.org/wiki/Haplogroup_G-M201
Ancestral Path Chart for Haplogroup BY211678, G-M201 Haplogroup, FamilyTreeDNA, 22 Feb 2025, https://discover.familytreedna.com/y-dna/G-BY211678/path
[18] B. Navarro‑L.pez, E. Granizo‑Rodr.guez, L. Palencia‑Madrid, C. Raffone . M. Baeta, M. M. de Pancorbo, Phylogeographic review of Y chromosome haplogroups in Europe, International Journal of Legal Medicine (2021) 135:1675–1684, https://doi.org/10.1007/s00414-021-02644-6
[19] Moreira, Ricardo Gomes, Human population genetics and the idea of ancestry: an anthropological perspective (part 2), 12, Jun 2023, Ancestry Traveler, https://ancestrytraveller.i3s.up.pt/human-population-genetics-and-the-idea-of-ancestry-an-anthropological-perspective-part-2/
Elia T. Ben-Ari, Molecular biographies: Anthropological geneticists are using the genome to decode human history, BioScience, Volume 49, Issue 2, February 1999, Pages 98–103, https://doi.org/10.2307/1313533
Kass, Mikala, 23 Apr 2019, Anthropology meets genetics to tell our collective story, ASU News, Arizona State University, https://news.asu.edu/20190423-discoveries-dna-anthropology-genetics
Crawford, Michael, Anthropological Genetics, Cambridge: Camridge University Press, 2007, http://ndl.ethernet.edu.et/bitstream/123456789/52369/1/104.pdf
Benn Torres J. Anthropological perspectives on genomic data, genetic ancestry, and race. Am J Phys Anthropol. 2020 May;171 Suppl 70:74-86. doi: 10.1002/ajpa.23979. Epub 2019 Dec 14. PMID: 31837009, https://pubmed.ncbi.nlm.nih.gov/31837009/
[20] Zeng, T.C., Aw, A.J. & Feldman, M.W. Cultural hitchhiking and competition between patrilineal kin groups explain the post-Neolithic Y-chromosome bottleneck. Nat Commun 9, 2077 (2018), page1, https://doi.org/10.1038/s41467-018-04375-6
[21] Deng, Nancy, Unearthing our past: The crucial role of genetic anthropology in rewriting history’s narrative, 2 Oct 2024, Vanderbilt Vanguard, https://vanderbiltvanguard.com/unearthing-our-past-the-crucial-role-of-genetic-anthropology-in-rewriting-historys-narrative/
“Genetic anthropology.” International Society of Genetic Genealogy Wiki. https://isogg.org/wiki/Genetic_anthropology#:~:text=Genetic%20anthropology%20is%20an%20emerging,how%20did%20we%20get%20here%3F%22.
Kass, Mikala. “Anthropology meets genetics to tell our collective story.” ASU News, 23 April 2019, https://news.asu.edu/20190423-discoveries-dna-anthropology-genetics.
[22] While genetic markers provide direct DNA-based evidence, macromorphoscopic traits serve as proxies for genetic data to measure relatedness and locality. The Macromorphoscopic Databank (MaMD) contains data from over 2,400 individuals worldwide to support these assessments.
Macromorphoscopic traits are morphological features of the human cranium that are assessed by their presence, development, or absence, rather than through measurements. These traits reflect soft-tissue differences in living individuals and are used primarily in forensic anthropology for ancestry estimation.
Researchers are now working to combine macromorphoscopic trait data with genetic markers (including mitochondrial DNA, Y-chromosomes, and single nucleotide polymorphisms) to create more comprehensive ancestry estimations. This integration aims to provide multiple lines of evidence for more accurate classifications.
Some researchers question whether macromorphoscopic traits truly reflect microevolutionary processes or serve as suitable genetic proxies for population structure. This has led to ongoing discussions about the most appropriate methods for ancestry estimation in forensic anthropology.
Miller, Mackenzie, “Accuracy of Ancestry Estimation in Forensic Anthropology: An Examination of Select Nonmetric Methods” (2023). All ETDs from UAB. 79.
https://digitalcommons.library.uab.edu/etd-collection/79,
Plemons A, Hefner JT. Ancestry Estimation Using Macromorphoscopic Traits. Acad Forensic Pathol. 2016 Sep;6(3):400-412. doi: 10.23907/2016.041. Epub 2016 Sep 1. PMID: 31239915; PMCID: PMC6474543, https://pmc.ncbi.nlm.nih.gov/articles/PMC6474543/
DiGangi, EA, Bethard JD. Uncloaking a Lost Cause: Decolonizing ancestry estimation in the United States. Am J Phys Anthropol. 2021 Jun;175(2):422-436. doi: 10.1002/ajpa.24212. Epub 2021 Jan 18. PMID: 33460459; PMCID: PMC8248240, https://pmc.ncbi.nlm.nih.gov/articles/PMC8248240/
Hinkes M. Book Review: Atlas of Human Cranial Macromorphoscopic Traits. Acad Forensic Pathol. 2018 Dec;8(4):xii–xiii. doi: 10.1177/1925362118821514. Epub 2018 Dec 19. PMCID: PMC6491539, https://pmc.ncbi.nlm.nih.gov/articles/PMC6491539/
[23] Bernardi, Laura, An Introduction to Anthropological Demography, MPIDR Working Paper WP 2007-031, Max Planck Institute for Demographic Research, https://www.demogr.mpg.de/papers/working/wp-2007-031.pdf
Sample records for anthropology human genetics, Topics by Sience.gov, Science.gov, https://www.science.gov/topicpages/a/anthropology+human+genetics.html
Sommer M. Human evolution across the disciplines: spotlights on American anthropology and genetics. Hist Philos Life Sci. 2012;34(1-2):211-36. PMID: 23272600, https://pubmed.ncbi.nlm.nih.gov/23272600/
Elhaik, Eran; Greenspan, Elliott; Staats, Sean; Krahn, Thomas; Tyler-Smith, Chris; Xue, Yali; Tofanelli, Sergio; Francalacci, Paolo; Cucca, Francesco; Pagani, Luca; Jin, Li; Li, Hui; Schurr, Theodore G.; Greenspan, Bennett; Spencer Wells, R, The GenoChip: A New Tool for Genetic Anthropology, the Genographic Consortium, Genome Biol Evol. 2013; 5(5): 1021–1031. Published online 2013 May 9. doi: 10.1093/gbe/evt066 https://pmc.ncbi.nlm.nih.gov/articles/PMC3673633/
Huckins, L., Boraska, V., Franklin, C. et al. Using ancestry-informative markers to identify fine structure across 15 populations of European origin. Eur J Hum Genet 22, 1190–1200 (2014). https://doi.org/10.1038/ejhg.2014.1
Yu JH, Taylor JS, Edwards KL, Fullerton SM. What are our AIMs? Interdisciplinary Perspectives on the Use of Ancestry Estimation in Disease Research. AJOB Prim Res. 2012;3(4):87-97. doi: 10.1080/21507716.2012.717339. PMID: 25419472; PMCID: PMC4238888, https://pmc.ncbi.nlm.nih.gov/articles/PMC4238888/
[24] Elia T. Ben-Ari, Molecular biographies: Anthropological geneticists are using the genome to decode human history, BioScience, Volume 49, Issue 2, February 1999, Pages 98–103, https://doi.org/10.2307/1313533
Shyamalika Gopalan , Samuel Pattillo Smith , Katharine Korunes , Iman Hamid , Sohini Ramachandran and Amy Goldberg, Human genetic admixture through the lens of population genomics, Philosphical Transactions of the Royal Society Biological Sciences, 18 April 2022, https://doi.org/10.1098/rstb.2020.0410
Manjusha Chintalapati Nick Patterson Priya Moorjani (2022) The spatiotemporal patterns of major human admixture events during the European Holocene, eLife 11:e77625, https://doi.org/10.7554/eLife.77625
Korunes KL, Goldberg A. Human genetic admixture. PLoS Genet. 2021 Mar 11;17(3):e1009374. doi: 10.1371/journal.pgen.1009374. PMID: 33705374; PMCID: PMC7951803, https://pmc.ncbi.nlm.nih.gov/articles/PMC7951803/
Shriner D. Overview of admixture mapping. Curr Protoc Hum Genet. 2013;Chapter 1:Unit 1.23. doi: 10.1002/0471142905.hg0123s76. PMID: 23315925; PMCID: PMC3556814, https://pmc.ncbi.nlm.nih.gov/articles/PMC3556814/
Daniel Wegmann, Raphael Eckel, Human evolution: When admixture met selection, Current Biology, Volume 33, Issue 7, 2023, Pages R259-R261, ISSN 0960-9822,
https://doi.org/10.1016/j.cub.2023.02.077 .
(https://www.sciencedirect.com/science/article/pii/S0960982223002671 )
[25] Patrilocality is the practice where a newly married couple resides with or near the husband’s family, meaning the wife moves to live close to her husband’s parents after marriage, typically found in societies that emphasize strong male lineage and family ties; it is the opposite of matrilocality where the couple lives near the wife’s family.
[26] Deborah A. Bolnick, Daniel I. Bolnick, David Glenn Smith, Asymmetric Male and Female Genetic Histories among Native Americans from Eastern North America, Molecular Biology and Evolution, Volume 23, Issue 11, November 2006, Pages 2161–2174, https://doi.org/10.1093/molbev/msl088
Giovanni Destro-Bisol, Francesco Donati, Valentina Coia, Ilaria Boschi, Fabio Verginelli, Alessandra Caglià, Sergio Tofanelli, Gabriella Spedini, Cristian Capelli, Variation of Female and Male Lineages in Sub-Saharan Populations: the Importance of Sociocultural Factors, Molecular Biology and Evolution, Volume 21, Issue 9, September 2004, Pages 1673–1682, https://doi.org/10.1093/molbev/msh186
[27] Zhabagin, M., Balanovska, E., Sabitov, Z. et al. The Connection of the Genetic, Cultural and Geographic Landscapes of Transoxiana. Sci Rep 7, 3085 (2017). https://doi.org/10.1038/s41598-017-03176-z
[28] Ibid
[29] Zeng, T.C., Aw, A.J. & Feldman, M.W. Cultural hitchhiking and competition between patrilineal kin groups explain the post-Neolithic Y-chromosome bottleneck. Nat Commun 9, 2077 (2018). https://doi.org/10.1038/s41467-018-04375-6
[30] Zhabagin, M., Balanovska, E., Sabitov, Z. et al. The Connection of the Genetic, Cultural and Geographic Landscapes of Transoxiana. Sci Rep 7, 3085 (2017). https://doi.org/10.1038/s41598-017-03176-z
Chiaroni J, Underhill PA, Cavalli-Sforza LL. Y chromosome diversity, human expansion, drift, and cultural evolution. Proc Natl Acad Sci U S A. 2009 Dec 1;106(48):20174-9. doi: 10.1073/pnas.0910803106. Epub 2009 Nov 17. Erratum in: Proc Natl Acad Sci U S A. 2010 Jul 27;107(30):13556. PMID: 19920170; PMCID: PMC2787129, https://pmc.ncbi.nlm.nih.gov/articles/PMC2787129/
[31] Karmin M, Saag L, Vicente M, Wilson Sayres MA, Järve M, Talas UG, Rootsi S, Ilumäe AM, Mägi R, Mitt M, Pagani L, Puurand T, Faltyskova Z, Clemente F, Cardona A, Metspalu E, Sahakyan H, Yunusbayev B, Hudjashov G, DeGiorgio M, Loogväli EL, Eichstaedt C, Eelmets M, Chaubey G, Tambets K, Litvinov S, Mormina M, Xue Y, Ayub Q, Zoraqi G, Korneliussen TS, Akhatova F, Lachance J, Tishkoff S, Momynaliev K, Ricaut FX, Kusuma P, Razafindrazaka H, Pierron D, Cox MP, Sultana GN, Willerslev R, Muller C, Westaway M, Lambert D, Skaro V, Kovačevic L, Turdikulova S, Dalimova D, Khusainova R, Trofimova N, Akhmetova V, Khidiyatova I, Lichman DV, Isakova J, Pocheshkhova E, Sabitov Z, Barashkov NA, Nymadawa P, Mihailov E, Seng JW, Evseeva I, Migliano AB, Abdullah S, Andriadze G, Primorac D, Atramentova L, Utevska O, Yepiskoposyan L, Marjanovic D, Kushniarevich A, Behar DM, Gilissen C, Vissers L, Veltman JA, Balanovska E, Derenko M, Malyarchuk B, Metspalu A, Fedorova S, Eriksson A, Manica A, Mendez FL, Karafet TM, Veeramah KR, Bradman N, Hammer MF, Osipova LP, Balanovsky O, Khusnutdinova EK, Johnsen K, Remm M, Thomas MG, Tyler-Smith C, Underhill PA, Willerslev E, Nielsen R, Metspalu M, Villems R, Kivisild T. A recent bottleneck of Y chromosome diversity coincides with a global change in culture. Genome Res. 2015 Apr;25(4):459-66. https://www.semanticscholar.org/paper/A-recent-bottleneck-of-Y-chromosome-diversity-with-Karmin-Saag/1e676ee5564b690d9534a3e395d2db6de8cf7875
(Pubmed) https://pmc.ncbi.nlm.nih.gov/articles/PMC4381518/
[32] Collins, Nathan, Wars and clan structure may explain a strange biological event 7,000 years ago, Stanford researchers find , 30 May 2018, Stanford Report, Stanford University, https://news.stanford.edu/stories/2018/05/war-clan-structure-explain-odd-biological-event
[33] Zeng, T.C., Aw, A.J. & Feldman, M.W. Cultural hitchhiking and competition between patrilineal kin groups explain the post-Neolithic Y-chromosome bottleneck. Nat Commun9, 2077 (2018). https://doi.org/10.1038/s41467-018-04375-6
[34] Collins, Nathan, Wars and clan structure may explain a strange biological event 7,000 years ago, Stanford researchers find , 30 May 2018, Stanford Report, Stanford University, https://news.stanford.edu/stories/2018/05/war-clan-structure-explain-odd-biological-event
[35] Davidski , Cultural hitchhiking and competition between patrilineal kin groups may have led to the post-Neolithic Y-chromosome bottleneck (Zeng et al. 2018) , Friday, May 25, 2018 , Eurogenes Blog, https://eurogenes.blogspot.com/2018/05/cultural-hitchhiking-and-competition.html#google_vignette
Collins, Nathan, Wars and clan structure may explain a strange biological event 7,000 years ago, Stanford researchers find , 30 May 2018, Stanford Report, Stanford University, https://news.stanford.edu/stories/2018/05/war-clan-structure-explain-odd-biological-event
[36] “In genetics, a selective sweep is the process through which a new beneficial mutation that increases its frequency and becomes fixed (i.e., reaches a frequency of 1) in the population leads to the reduction or elimination of genetic variation among nucleotide sequences that are near the mutation.”
Selective sweep, Wikipedia, This page was last edited on 1 February 2025, https://en.wikipedia.org/wiki/Selective_sweep
Genetic hitchhiking, Wikipedia, This page was last edited on 10 February 2025, https://en.wikipedia.org/wiki/Genetic_hitchhiking
[37] Hashem, Ihab & Telen, Dries & Nimmegeers, Philippe & Van Impe, Jan. (2018). The Silent Cooperator: An Epigenetic Model for Emergence of Altruistic Traits in Biological Systems. Complexity. 2018. 1-16. 10.1155/2018/2082037
[38] Bersaglieri, Todd; Sabeti, Pardis C.; Patterson, Nick; Vanderploeg, Trisha; Schaffner, Steve F.; Drake, Jared A.; Rhodes, Matthew; Reich, David E.; Hirschhorn, Joel N. (2004-06-01). “Genetic signatures of strong recent positive selection at the lactase gene”. American Journal of Human Genetics. 74 (6): 1111–1120. doi: 10.1086/421051. PMC 1182075. PMID 15114531, https://pmc.ncbi.nlm.nih.gov/articles/PMC1182075/
Tishkoff, Sarah A.; Reed, Floyd A.; Ranciaro, Alessia; Voight, Benjamin F.; Babbitt, Courtney C.; Silverman, Jesse S.; Powell, Kweli; Mortensen, Holly M.; Hirbo, Jibril B. (2007-01-01). “Convergent adaptation of human lactase persistence in Africa and Europe”. Nature Genetics. 39 (1): 31–40, https://pmc.ncbi.nlm.nih.gov/articles/PMC2672153/
[39] Yi, Xin; Liang, Yu; Huerta-Sanchez, Emilia; Jin, Xin; Cuo, Zha Xi Ping; Pool, John E.; Xu, Xun; Jiang, Hui; Vinckenbosch, Nicolas (2010-07-02). “Sequencing of 50 human exomes reveals adaptation to high altitude”. Science. 329 (5987): 75–78. Bibcode:2010 Sci…329…75Y. doi:10.1126/science.1190371. PMC 3711608. PMID 20595611 , https://pmc.ncbi.nlm.nih.gov/articles/PMC3711608/
[40] Cultural hitchhiking, Wikipedia, This page was last edited on 23 October 2024, https://en.wikipedia.org/wiki/Cultural_hitchhiking
Whitehead, Hal; Vachon, Felicia; Frasier, Timothy R. (May 2017). “Cultural Hitchhiking in the Matrilineal Whales”. Behavior Genetics. 47 (3): 324–334. doi:10.1007/s10519-017-9840-8. PMID 28275880. S2CID 3866892, https://doi.org/10.1007/s10519-017-9840-8
[40] Premo, L. S.. “Hitchhiker’s guide to genetic diversity in socially structured populations.” Current Zoology, vol. 58, no. 2, Apr. 2012, pp. 287-297. https://doi.org/10.1093/czoolo/58.2.287
[41] Carrignon, Simon, Encrico R Crema, Anne Kandler, Stephen Shennan, Postmarital residence rules and transmission pathways in cultural hitchhiking, 18 Nov 2024, PNAS, Vol 121 No 48 https://www.pnas.org/doi/10.1073/pnas.2322888121
Whitehead, Hal; Vachon, Felicia; Frasier, Timothy R. (May 2017). “Cultural Hitchhiking in the Matrilineal Whales”. Behavior Genetics. 47 (3): 324–334. doi:10.1007/s10519-017-9840-8. PMID 28275880. S2CID 3866892, https://doi.org/10.1007/s10519-017-9840-8
[42] Fogarty L, Otto SP. Signatures of selection with cultural interference. Proc Natl Acad Sci U S A. 2024 Nov 26;121(48):e2322885121. doi: 10.1073/pnas.2322885121. Epub 2024 Nov 18. PMID: 39556724; PMCID: PMC11621839, https://pmc.ncbi.nlm.nih.gov/articles/PMC11621839/
[43] Carrignon, Simon, Encrico R Crema, Anne Kandler, Stephen Shennan, Postmarital residence rules and transmission pathways in cultural hitchhiking, 18 Nov 2024, PNAS, Vol 121 No 48 https://www.pnas.org/doi/10.1073/pnas.2322888121
[44] Carrignon, Simon, Encrico R Crema, Anne Kandler, Stephen Shennan, Postmarital residence rules and transmission pathways in cultural hitchhiking, 18 Nov 2024, PNAS, Vol 121 No 48 https://www.pnas.org/doi/10.1073/pnas.2322888121
Fogarty L, Otto SP. Signatures of selection with cultural interference. Proc Natl Acad Sci U S A. 2024 Nov 26;121(48):e2322885121. doi: 10.1073/pnas.2322885121. Epub 2024 Nov 18. PMID: 39556724; PMCID: PMC11621839, https://pmc.ncbi.nlm.nih.gov/articles/PMC11621839/
[45] Premo, L. S.. “Hitchhiker’s guide to genetic diversity in socially structured populations.” Current Zoology, vol. 58, no. 2, Apr. 2012, pp. 287-297. https://doi.org/10.1093/czoolo/58.2.287
Whitehead, H., Laland, K.N., Rendell, L. et al. The reach of gene–culture coevolution in animals. Nat Commun 10, 2405 (2019). https://doi.org/10.1038/s41467-019-10293-y
[46] Zeng, T.C., Aw, A.J. & Feldman, M.W. Cultural hitchhiking and competition between patrilineal kin groups explain the post-Neolithic Y-chromosome bottleneck. Nat Commun9, 2077 (2018). https://doi.org/10.1038/s41467-018-04375-6
[47] Laland Kevin N. Exploring gene-culture interactions: insights from handedness, sexual selection and niche-construction case studies. Philos Trans R Soc Lond B Biol Sci. 2008 Nov 12;363(1509):3577-89. doi: 10.1098/rstb.2008.0132. PMID: 18799415; PMCID: PMC2607340, https://pmc.ncbi.nlm.nih.gov/articles/PMC2607340/
One a approach, niche construction theory (NCT), describes how organisms actively modify their own and other species’ evolutionary environments through their activities and behaviors1. This process goes beyond passive adaptation to environments, as organisms create systematic changes that affect natural selection pressures on themselves and future generations. [a]
Rather than viewing evolution as a one-way process, NCT presents it as a dynamic feedback system where organisms modify their environments, modified environments create new selection pressures, and these pressures influence subsequent evolution. This perspective transforms evolutionary theory from focusing solely on organismal evolution to examining the co-evolution of organisms with their environments. [b]
[47a] Laland K, Matthews B, Feldman MW. An introduction to niche construction theory. Evol Ecol. 2016;30:191-202. doi: 10.1007/s10682-016-9821-z. Epub 2016 Feb 3. PMID: 27429507; PMCID: PMC4922671, https://pmc.ncbi.nlm.nih.gov/articles/PMC4922671/
Niche construction, Wikipedia, This page was last edited on 6 January 2025, https://en.wikipedia.org/wiki/Niche_construction
[47b] Kevin Laland, John Odling-Smee and ohn Endler, Niche construction, sources of selection and trait coevolution, Interface Focus, 18 August 2017, https://doi.org/10.1098/rsfs.2016.0147
[48] Ecological Fallacy, Wikipedia, This page was last edited on 21 September 2024, https://en.wikipedia.org/wiki/Ecological_fallacy
[49] Spatial Aggregation and the Ecological Fallacy. Chapman Hall CRC Handb Mod Stat Methods. 2010;2010:541-558. doi: 10.1201/9781420072884-c30. PMID: 25356440; PMCID: PMC4209486, https://pmc.ncbi.nlm.nih.gov/articles/PMC4209486/
[50] See for example, Parahu, Ancient DNA from Ethiopia, 11 Mar 2023, Land of Punt, https://landofpunt.wordpress.com/2023/03/11/ancient-dna-from-ethiopia-2/
[51] Templeton, Alan R., Genetics and Recent Human Evolution, 19 Apr 2007, Perspective: The Society for the Study of Evolution, Evolution 61-7 : 1507–1519, https://www.sfu.ca/biology/courses/bisc441/Course_Materials/Readings/13-(Lect8)Templeton2007.pdf
Guha P, Srivastava SK, Bhattacharjee S, Chaudhuri TK. Human migration, diversity and disease association: a convergent role of established and emerging DNA markers. Front Genet. 2013 Aug 9;4:155. doi: 10.3389/fgene.2013.00155. PMID: 23950760; PMCID: PMC3738866 https://pmc.ncbi.nlm.nih.gov/articles/PMC3738866/
[52] Spatial Aggregation and the Ecological Fallacy. Chapman Hall CRC Handb Mod Stat Methods. 2010;2010:541-558. doi: 10.1201/9781420072884-c30. PMID: 25356440; PMCID: PMC4209486, https://pmc.ncbi.nlm.nih.gov/articles/PMC4209486/
[53] Loog L. Sometimes hidden but always there: the assumptions underlying genetic inference of demographic histories. Philos Trans R Soc Lond B Biol Sci. 2021 Jan 18;376(1816):20190719. doi: 10.1098/rstb.2019.0719. Epub 2020 Nov 30. PMID: 33250022; PMCID: PMC7741104, https://pmc.ncbi.nlm.nih.gov/articles/PMC7741104/
[54] Ainash Childebayeva, Adam Benjamin Rohrlach, Rodrigo Barquera, Maïté Rivollat, Franziska Aron, András Szolek, Oliver Kohlbacher, Nicole Nicklisch, Kurt W. Alt, Detlef Gronenborn, Harald Meller, Susanne Friederich, Kay Prüfer, Marie-France Deguilloux, Johannes Krause, Wolfgang Haak, Population Genetics and Signatures of Selection in Early Neolithic European Farmers, Molecular Biology and Evolution, Volume 39, Issue 6, June 2022, msac108, https://doi.org/10.1093/molbev/msac108
Arias L, Schröder R, Hübner A, Barreto G, Stoneking M, Pakendorf B. Cultural Innovations Influence Patterns of Genetic Diversity in Northwestern Amazonia. Mol Biol Evol. 2018 Nov 1;35(11):2719-2735. doi: 10.1093/molbev/msy169. PMID: 30169717; PMCID: PMC6231495, https://pmc.ncbi.nlm.nih.gov/articles/PMC6231495
Deborah A. Bolnick, Daniel I. Bolnick, David Glenn Smith, Asymmetric Male and Female Genetic Histories among Native Americans from Eastern North America, Molecular Biology and Evolution, Volume 23, Issue 11, November 2006, Pages 2161–2174, https://doi.org/10.1093/molbev/msl088
[55] Chyleński, M., Makarowicz, P., Juras, A. et al. Patrilocality and hunter-gatherer-related ancestry of populations in East-Central Europe during the Middle Bronze Age. Nat Commun 14, 4395 (2023). https://doi.org/10.1038/s41467-023-40072-9
[56] See for example Estes, Roberta, New Native American Mitochondrial DNA Haplogroups, 2 mar 217, DNAeXplained – Genetic Genealogy, https://dna-explained.com/2017/03/02/new-native-american-mitochondrial-dna-haplogroups/
[57] See for example:
Arias L, Schröder R, Hübner A, Barreto G, Stoneking M, Pakendorf B. Cultural Innovations Influence Patterns of Genetic Diversity in Northwestern Amazonia. Mol Biol Evol. 2018 Nov 1;35(11):2719-2735. doi: 10.1093/molbev/msy169. PMID: 30169717; PMCID: PMC6231495
Deborah A. Bolnick, Daniel I. Bolnick, David Glenn Smith, Asymmetric Male and Female Genetic Histories among Native Americans from Eastern North America, Molecular Biology and Evolution, Volume 23, Issue 11, November 2006, Pages 2161–2174, https://doi.org/10.1093/molbev/msl088
[58] Wang, K., Tobias, B., Pany-Kucera, D. et al. Ancient DNA reveals reproductive barrier despite shared Avar-period culture. Nature 638, 1007–1014 (2025). https://doi.org/10.1038/s41586-024-08418-5
[59] Deborah A. Bolnick, Daniel I. Bolnick, David Glenn Smith, Asymmetric Male and Female Genetic Histories among Native Americans from Eastern North America, Molecular Biology and Evolution, Volume 23, Issue 11, November 2006, Pages 2161–2174, https://doi.org/10.1093/molbev/msl088
Arias L, Schröder R, Hübner A, Barreto G, Stoneking M, Pakendorf B. Cultural Innovations Influence Patterns of Genetic Diversity in Northwestern Amazonia. Mol Biol Evol. 2018 Nov 1;35(11):2719-2735. doi: 10.1093/molbev/msy169. PMID: 30169717; PMCID: PMC6231495, https://pmc.ncbi.nlm.nih.gov/articles/PMC6231495/
[60] Isern, N., Fort, J. & de Rioja, V.L. The ancient cline of haplogroup K implies that the Neolithic transition in Europe was mainly demic. Sci Rep 7, 11229 (2017). https://doi.org/10.1038/s41598-017-11629-8
[61] Wang, K., Tobias, B., Pany-Kucera, D. et al. Ancient DNA reveals reproductive barrier despite shared Avar-period culture. Nature 638, 1007–1014 (2025). https://doi.org/10.1038/s41586-024-08418-5
[62] There are several documented instances where Indo-European languages were adopted without corresponding significant genetic changes in European populations.
The Hungarians represent one of the most studied cases of language-genetic mismatch in Europe. While they speak a Uralic language (not Indo-European), they are genetically similar to their Indo-European speaking neighbors. This population preserved the language brought by the Magyars who conquered the Carpathian Basin in the ninth century CE, while becoming genetically assimilated to their Indo-European-speaking neighbors over time. [a]
The Maltese present another interesting case. They speak an Afro-Asiatic language with lexical influences from Italian and English, making them the only Afro-Asiatic speakers in Europe. Their genetic profile can be described as a mix of ancestries from throughout the Mediterranean basin, being genetically close to Eastern Sicilians while sharing genetic relatedness with Indo-European speakers from the Balkans. [b]
More recent European examples where language and genes do not match include the spread of Slavic languages across the Balkans and elsewhere. These cases demonstrate that language adoption can occur through cultural processes rather than genetic replacement. [c]
In Greece, archaeological and genetic evidence indicates that Indo-European languages spread without major population replacement. Studies show that steppe ancestry (associated with early Indo-European speakers) was present at relatively low levels of about in both elite and non-elite individuals in ancient Greece4. [d] Unlike northern Europe, where steppe-descended peoples replaced up to 90% of the native population, in Greece the steppe migrants became integrated both socially and genetically into Aegean societies rather than dominating them.
Concept of Language Shift
The concept of language sift has been utilized as an attempt to explain one aspecet of the relationship between genetics and culture. Language shifts can occur through elite dominance rather than mass migration.
The “elite recruitment” model suggests that Indo-European languages likely spread through the actions of “Indo-European chiefs” and their “ideology of political clientage” rather than through complete population replacement. Small elite groups have successfully imposed their languages in various historical contexts without significantly altering the genetic makeup of the local population. [e]
David Anthony, who proposed a “revised Steppe hypothesis,” argues that Indo-European languages spread not through “chain-type folk migrations” but through this elite recruitment process, where ritual and political elites introduced these languages and were then emulated by larger groups.
As David Anthony explains, “Language shift can be understood best as a social strategy through which individuals and groups compete for positions of prestige, power, and domestic security.” A relatively small immigrant elite population can encourage widespread language shift among numerically dominant indigenous populations if they employ specific combinations of encouragements and punishments. [f]
However, some scholars like Axel Kristinsson question the elite dominance model, noting that historically, it is often the conquerors who adopt the language of the conquered rather than vice versa. He points out that for elite dominance to effectively cause language shift, it typically requires additional elements like a centralized state, which did not exist in the fourth millennium BCE when Indo-European languages began spreading. [g]
Correlations between genetic and linguistic diversity across European populations
A 2015 study by Longobardi et al. revealed significant correlations between genetic and linguistic diversity across European populations. The research employed innovative linguistic comparison tools: a refined list of Indo-European cognate words and a novel method estimating linguistic diversity from a universal inventory of grammatical polymorphisms. [h]
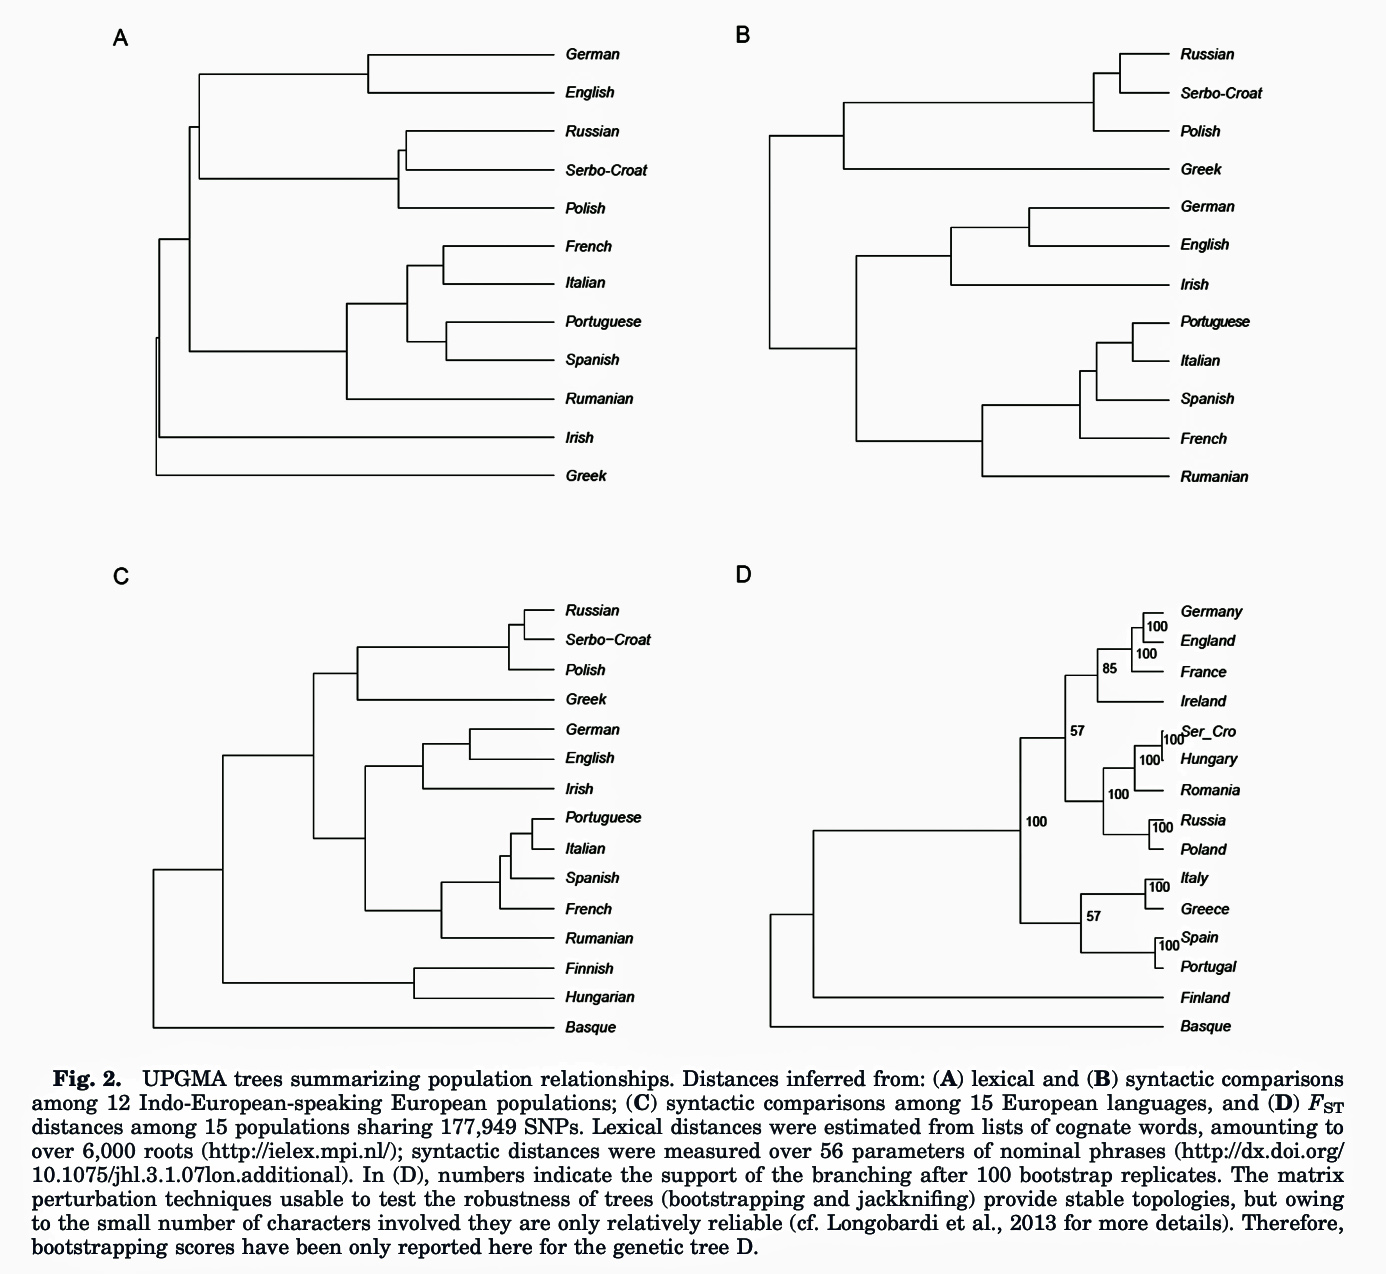
The study found that populations speaking different languages are more likely to have different genetic makeup. The degree of genetic diversity between two European populations was proportional to their linguistic diversity.
Contrary to previous observations, language proved to be a better predictor of genetic differences than geographical distribution. Both lexical and syntactic distances showed higher correlations with genetic distances than genes did with geography
The research by Longobardi et al suggests that migrating populations carried their genes alongside their language, rather than just experiencing cultural diffusion of linguistic features. Inferred episodes of genetic admixture following major population splits had convincing correlates in the linguistic realm.
Research has shown significant correlations between genomic and linguistic diversity in Europe, with language sometimes proving to be a better predictor of genomic differences than geography. However, these correlations do not necessarily imply that language shifts always coincide with genetic changes.
The debate about Indo-European language origins continues, with competing theories placing their birthplace either in Anatolia (with the first farmers) or on the Eurasian steppe. Recent genetic evidence supports the steppe hypothesis, identifying the Caucasus Lower Volga people as the likely originators of Proto-Indo-European around 6,500 years ago. [i]
The spread of these languages throughout Europe likely involved both migration and cultural adoption processes, with varying degrees of genetic impact in different regions.
[a] Barbieri, Chaiara, Damián E. Blasi, Epifanía Arango-Isaza, and Kentaro K. Shimizu, A global analysis of matches and mismatches between human genetic and linguistic histories, 21 Nov 2022, PNAS, 119 (47), https://www.pnas.org/doi/10.1073/pnas.2122084119
[b] Ibid
[c] Alberto González, Origins and spread of Indo-European languages: an alternative view, 8 Dec 2024, Ancient DNA Era, https://adnaera.com/2024/12/08/origins-and-spread-of-indo-european-languages-an-alternative-view/
[d] Shaw, Jonathan, Seeking the First Speakers of Indo-European Language, 25 Aug 2022, Harvard Magazine, https://www.harvardmagazine.com/2022/08/indo-european-languages
Iosif Lazaridis et al. ,The genetic history of the Southern Arc: A bridge between West Asia and Europe, Science 377, eabm4247 (2022). DOI:10.1126/science.abm4247, https://www.science.org/doi/10.1126/science.abm4247
Language shift, Wikipedia, This page was last edited on 23 December 2024, https://en.wikipedia.org/wiki/Language_shift
Indo-European migrations, Wikipedia, This page was last edited on 21 February 2025, https://en.wikipedia.org/wiki/Indo-European_migrations
[e] Language shift, Wikipedia, This page was last edited on 23 December 2024, https://en.wikipedia.org/wiki/Language_shift
[f] Language shift, Wikipedia, This page was last edited on 23 December 2024, https://en.wikipedia.org/wiki/Language_shift
[g] Kristinsson, Axel, Indo-European Expansion Cycles, The Journal of Indo-European Studies , Volume 40, Number 3 & 4, Fall/Winter 2012, https://www.axelkrist.com/docs/Indo-European_Expansion_Cycles.pdf
[h] Giuseppe Longobardi, Silvia Ghirotto, Cristina Guardiano, Francesca Tassi, Andrea Benazzo, Andrea Ceolin, Guido Barbujani, Across language families: Genome diversity mirrors linguistic variation within Europe, Physical Anthropology, 157 (4) Aug 2015: 630-640, online: https://onlinelibrary.wiley.com/doi/full/10.1002/ajpa.22758
[i] Giuseppe Longobardi, Silvia Ghirotto, Cristina Guardiano, Francesca Tassi, Andrea Benazzo, Andrea Ceolin, Guido Barbujani, Across language families: Genome diversity mirrors linguistic variation within Europe, Physical Anthropology, 157 (4) Aug 2015: 630-640, online: https://onlinelibrary.wiley.com/doi/full/10.1002/ajpa.22758
DeSmith, Christy, Ancient-DNA Study Identifies Originators of Indo-European Language Family, 5 Feb 2025, Harvard Gazette, https://hms.harvard.edu/news/ancient-dna-study-identifies-originators-indo-european-language-family
Lazaridis, I., Patterson, N., Anthony, D. et al. The genetic origin of the Indo-Europeans. Nature (2025). https://doi.org/10.1038/s41586-024-08531-5
Dutchen, Stephanie, A Steppe Forward: Ancient DNA challenges popular theory of Indo-European language arrival in Europe, 2 mar 2015, News & Research, Harvard Medical School, https://hms.harvard.edu/news/steppe-forward
Dutchen, Stephanie, Old Mysteries: New Insights Ancient DNA illuminates 15,000 years of history at Europe-Asia crossroads, News & Research, 25 Aug 2022, Harvard Medical School, https://hms.harvard.edu/news/old-mysteries-new-insights
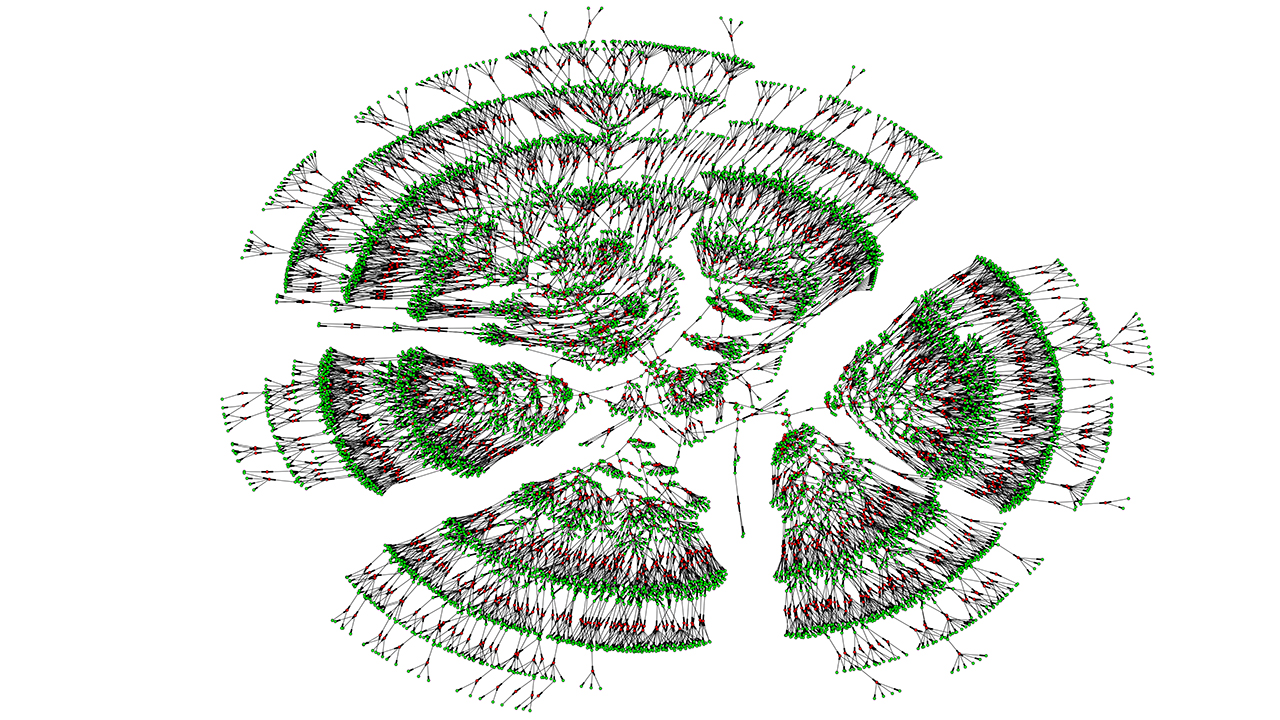
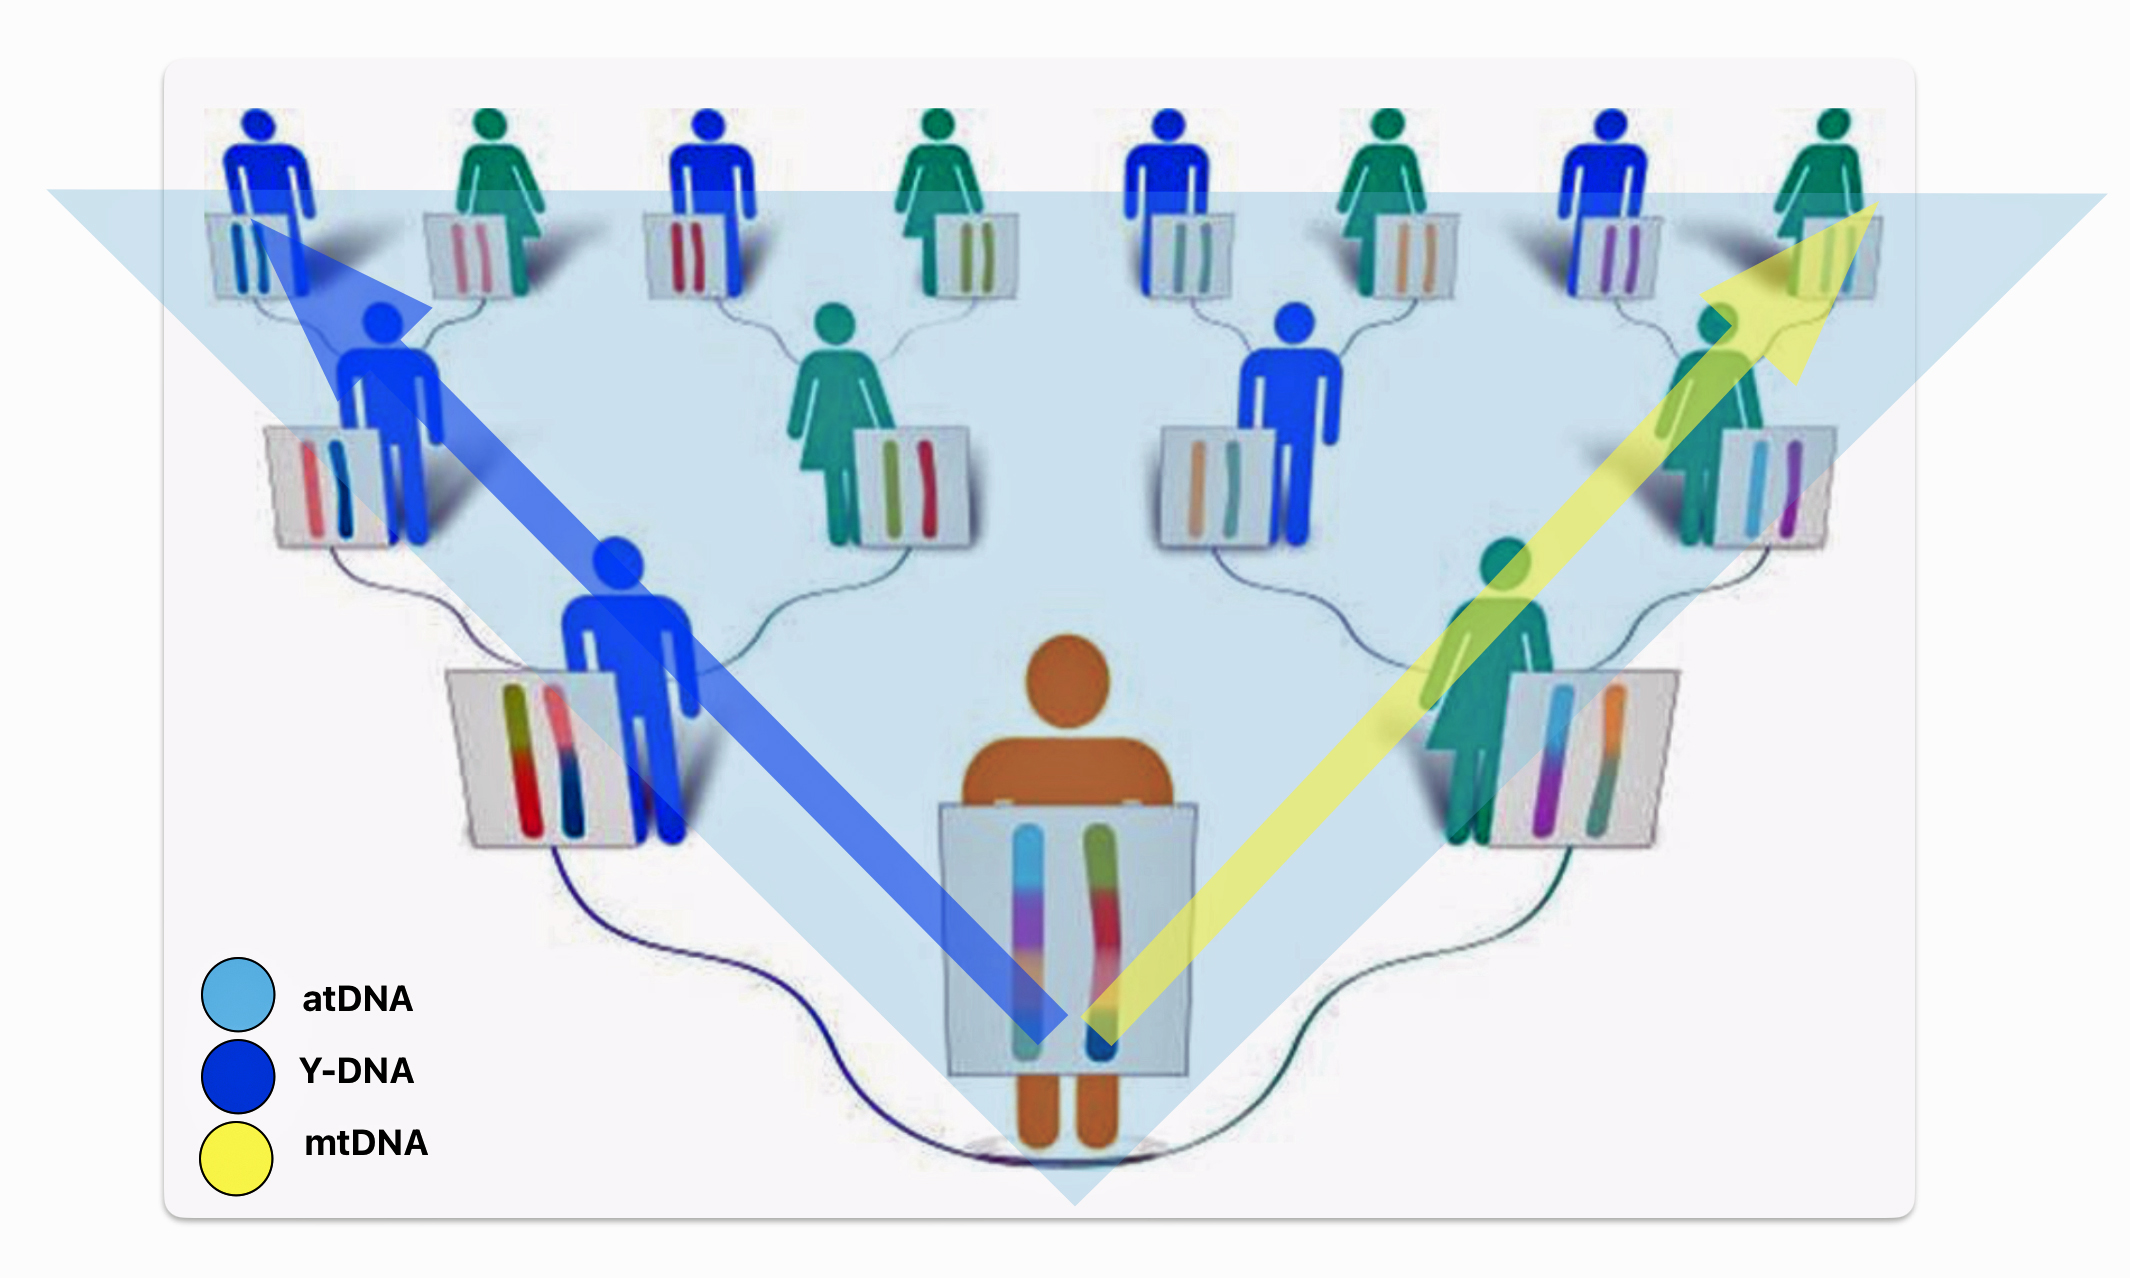
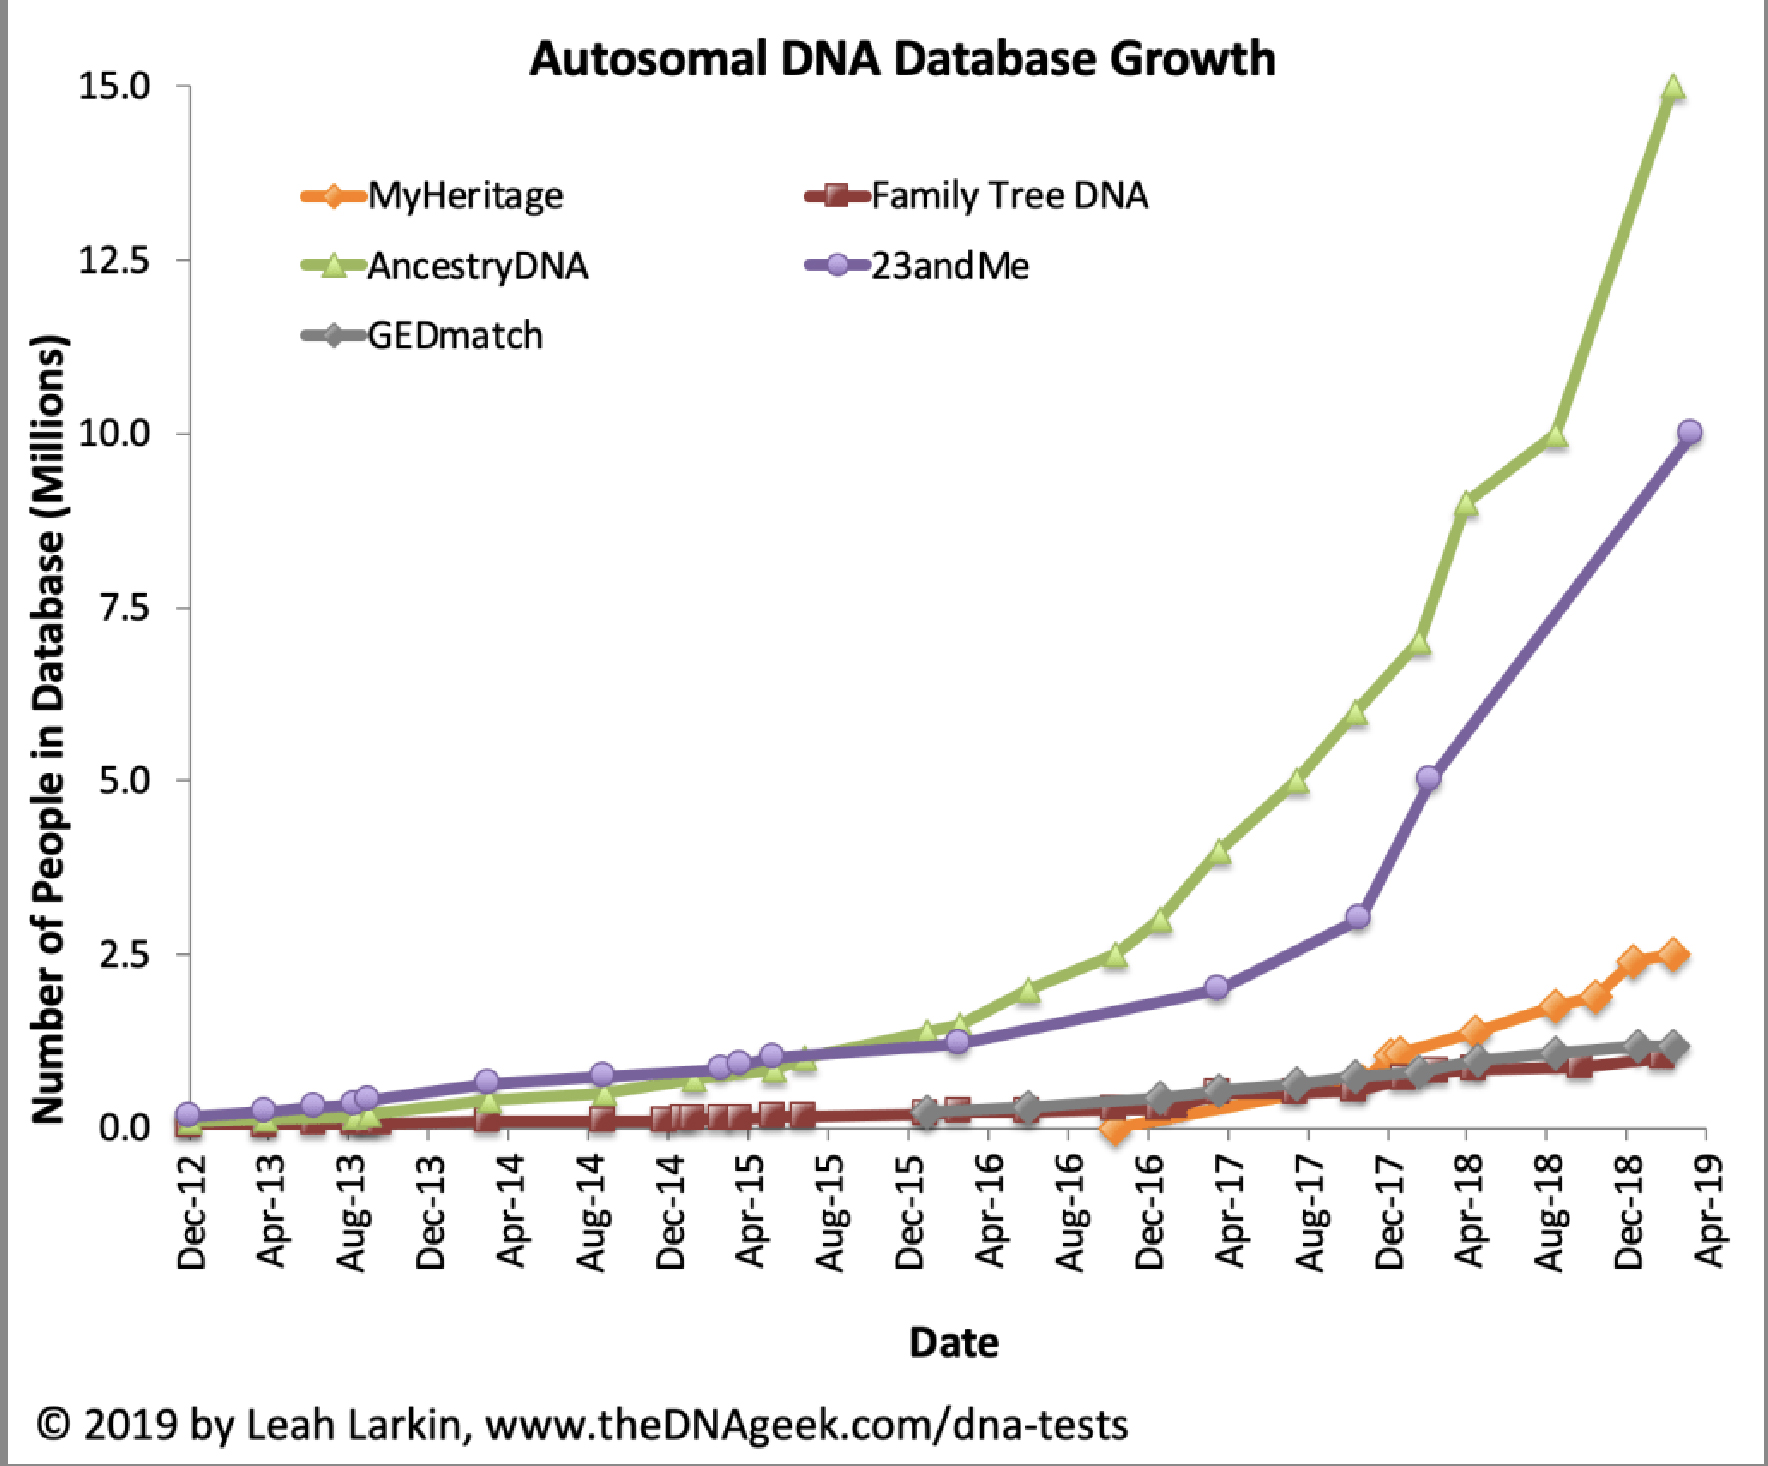
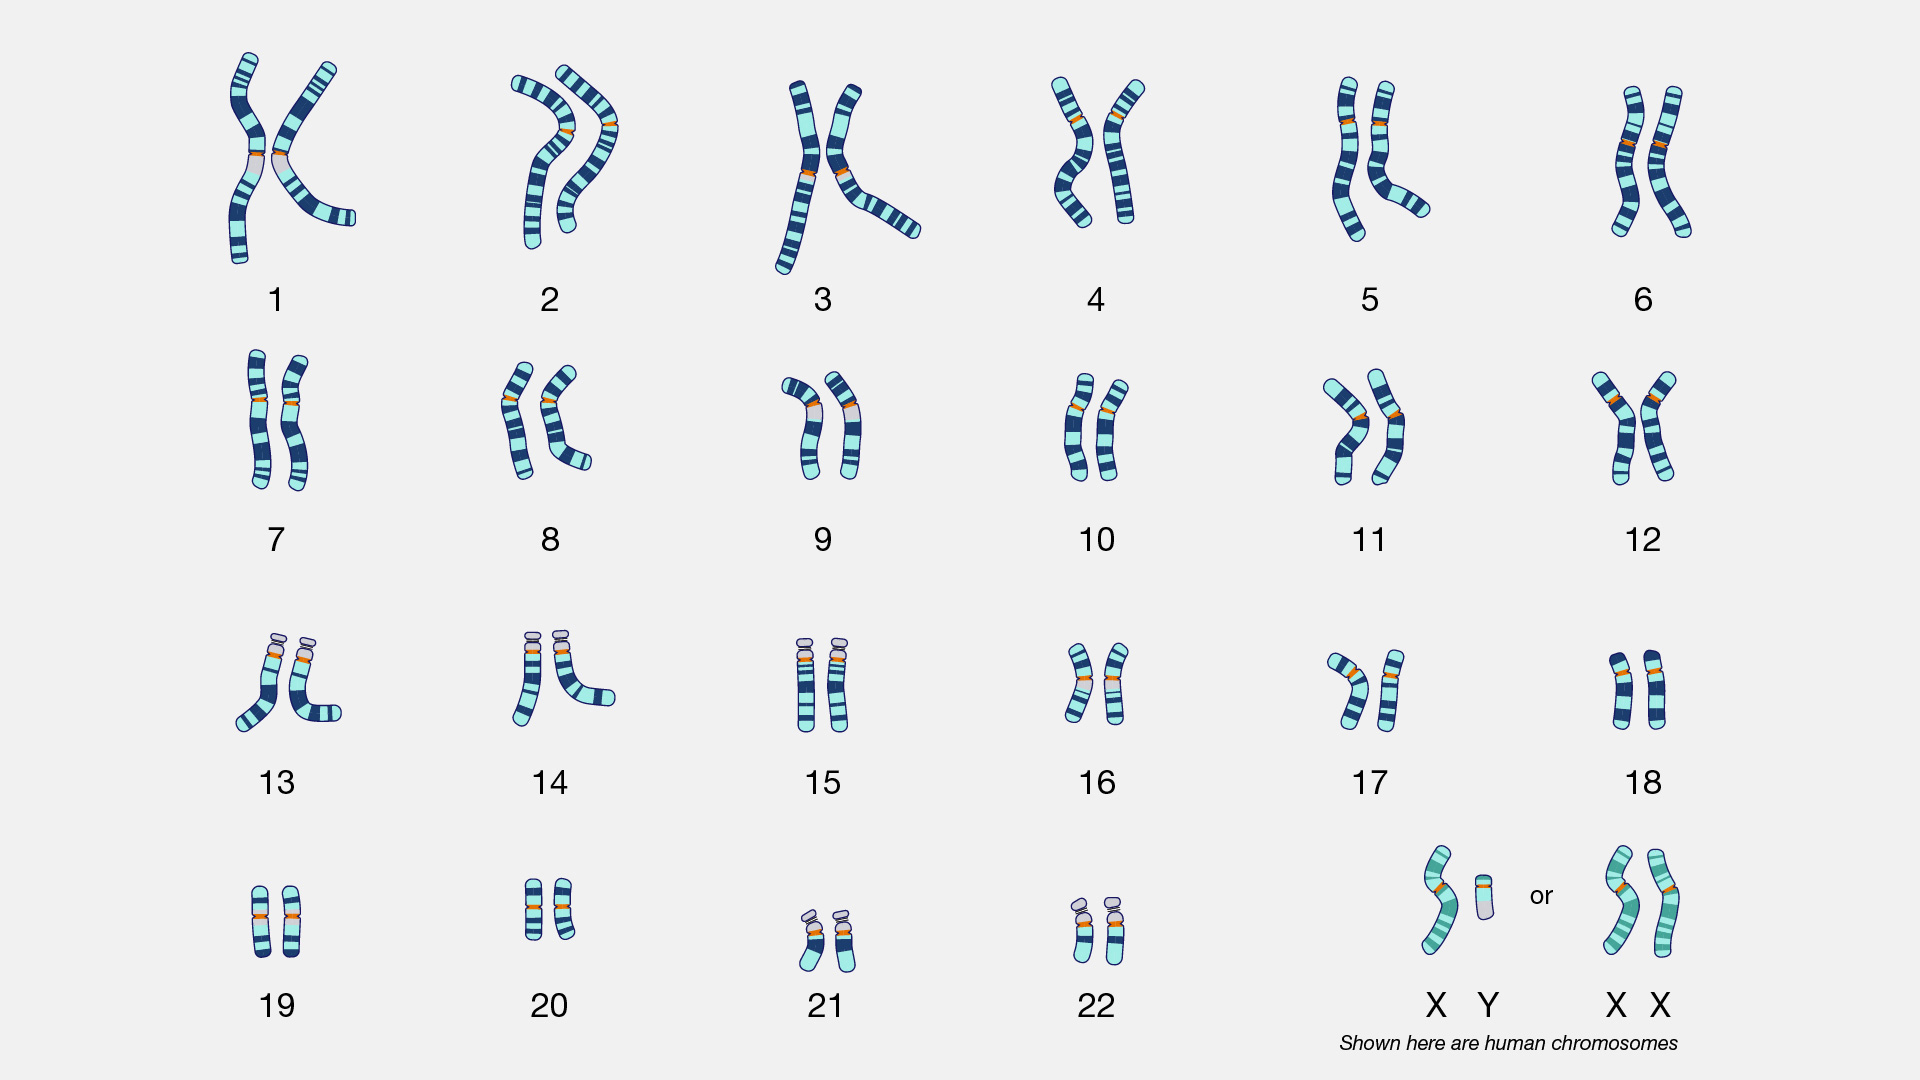
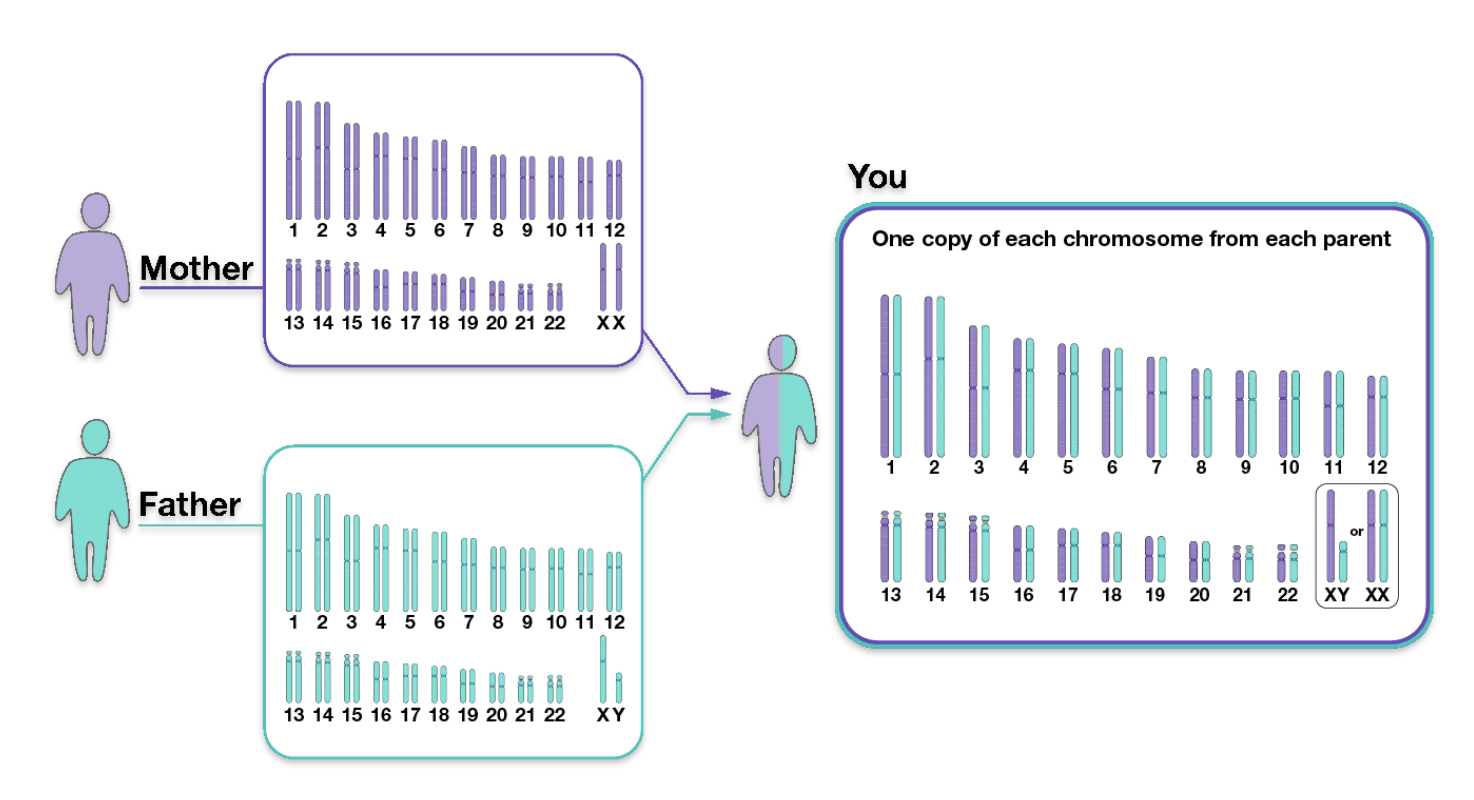
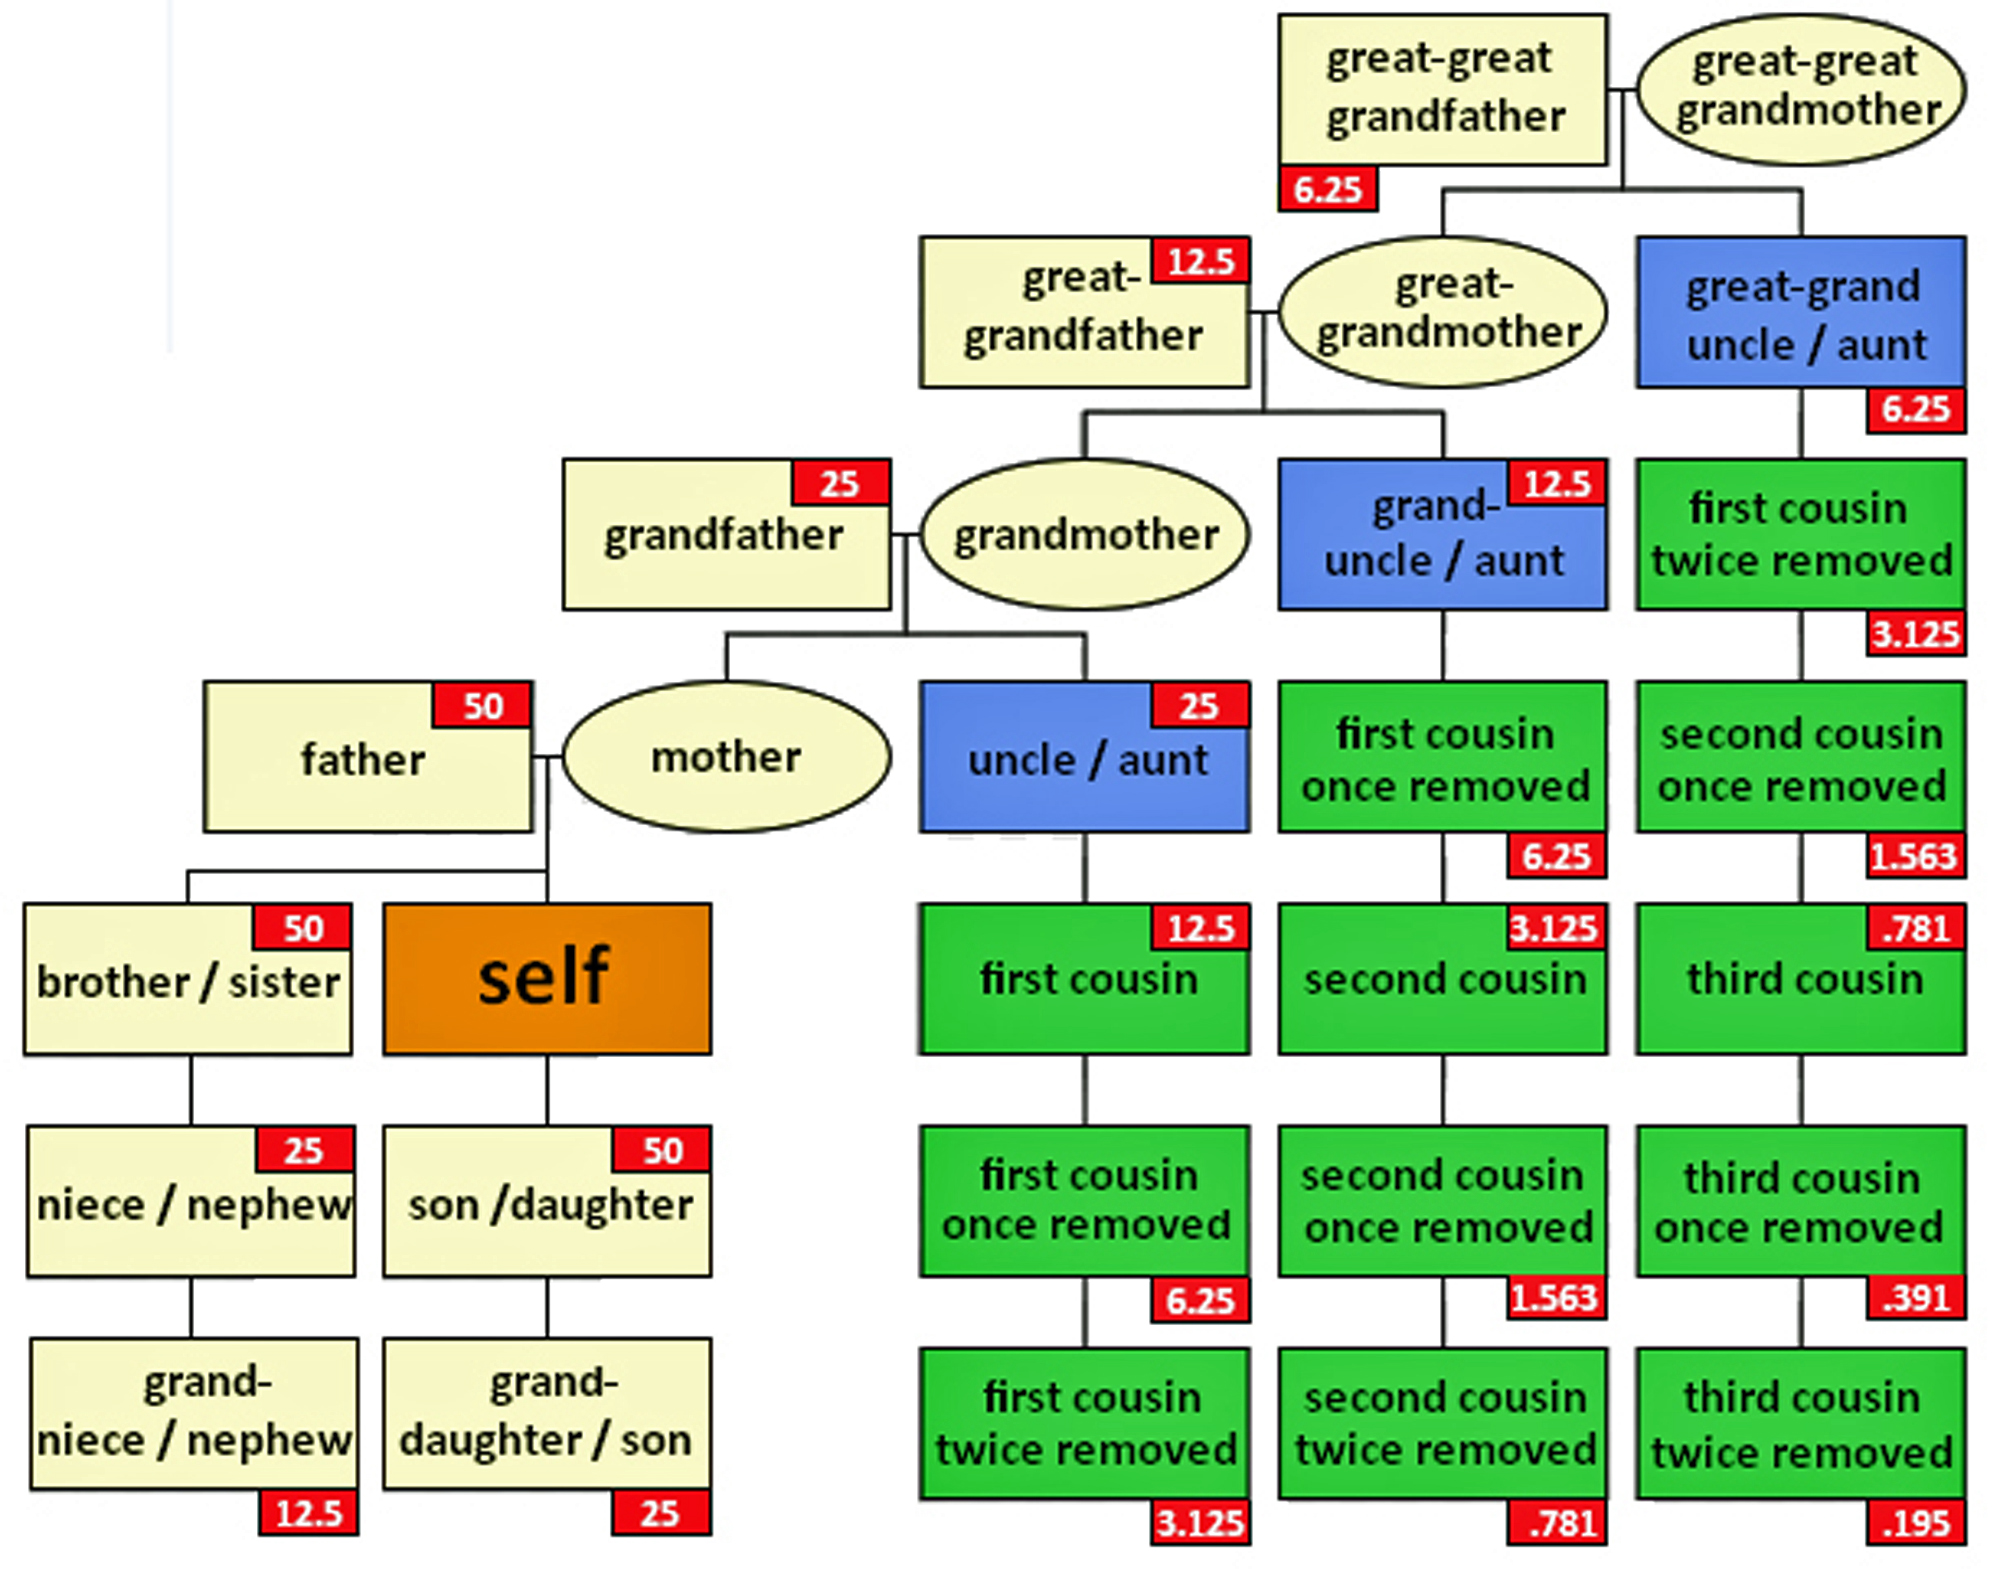
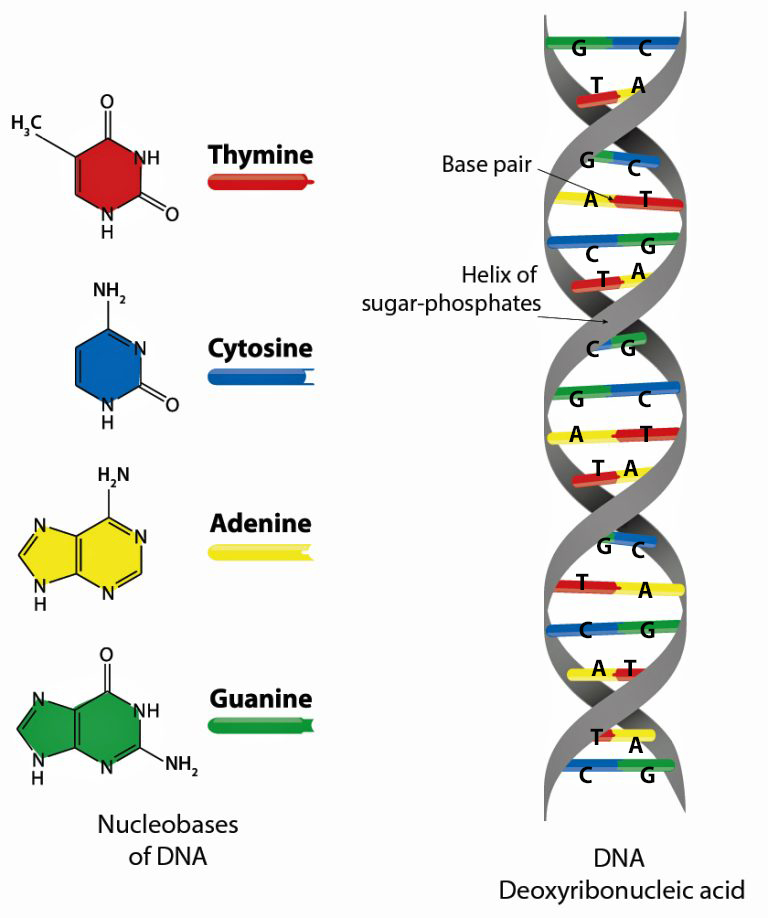
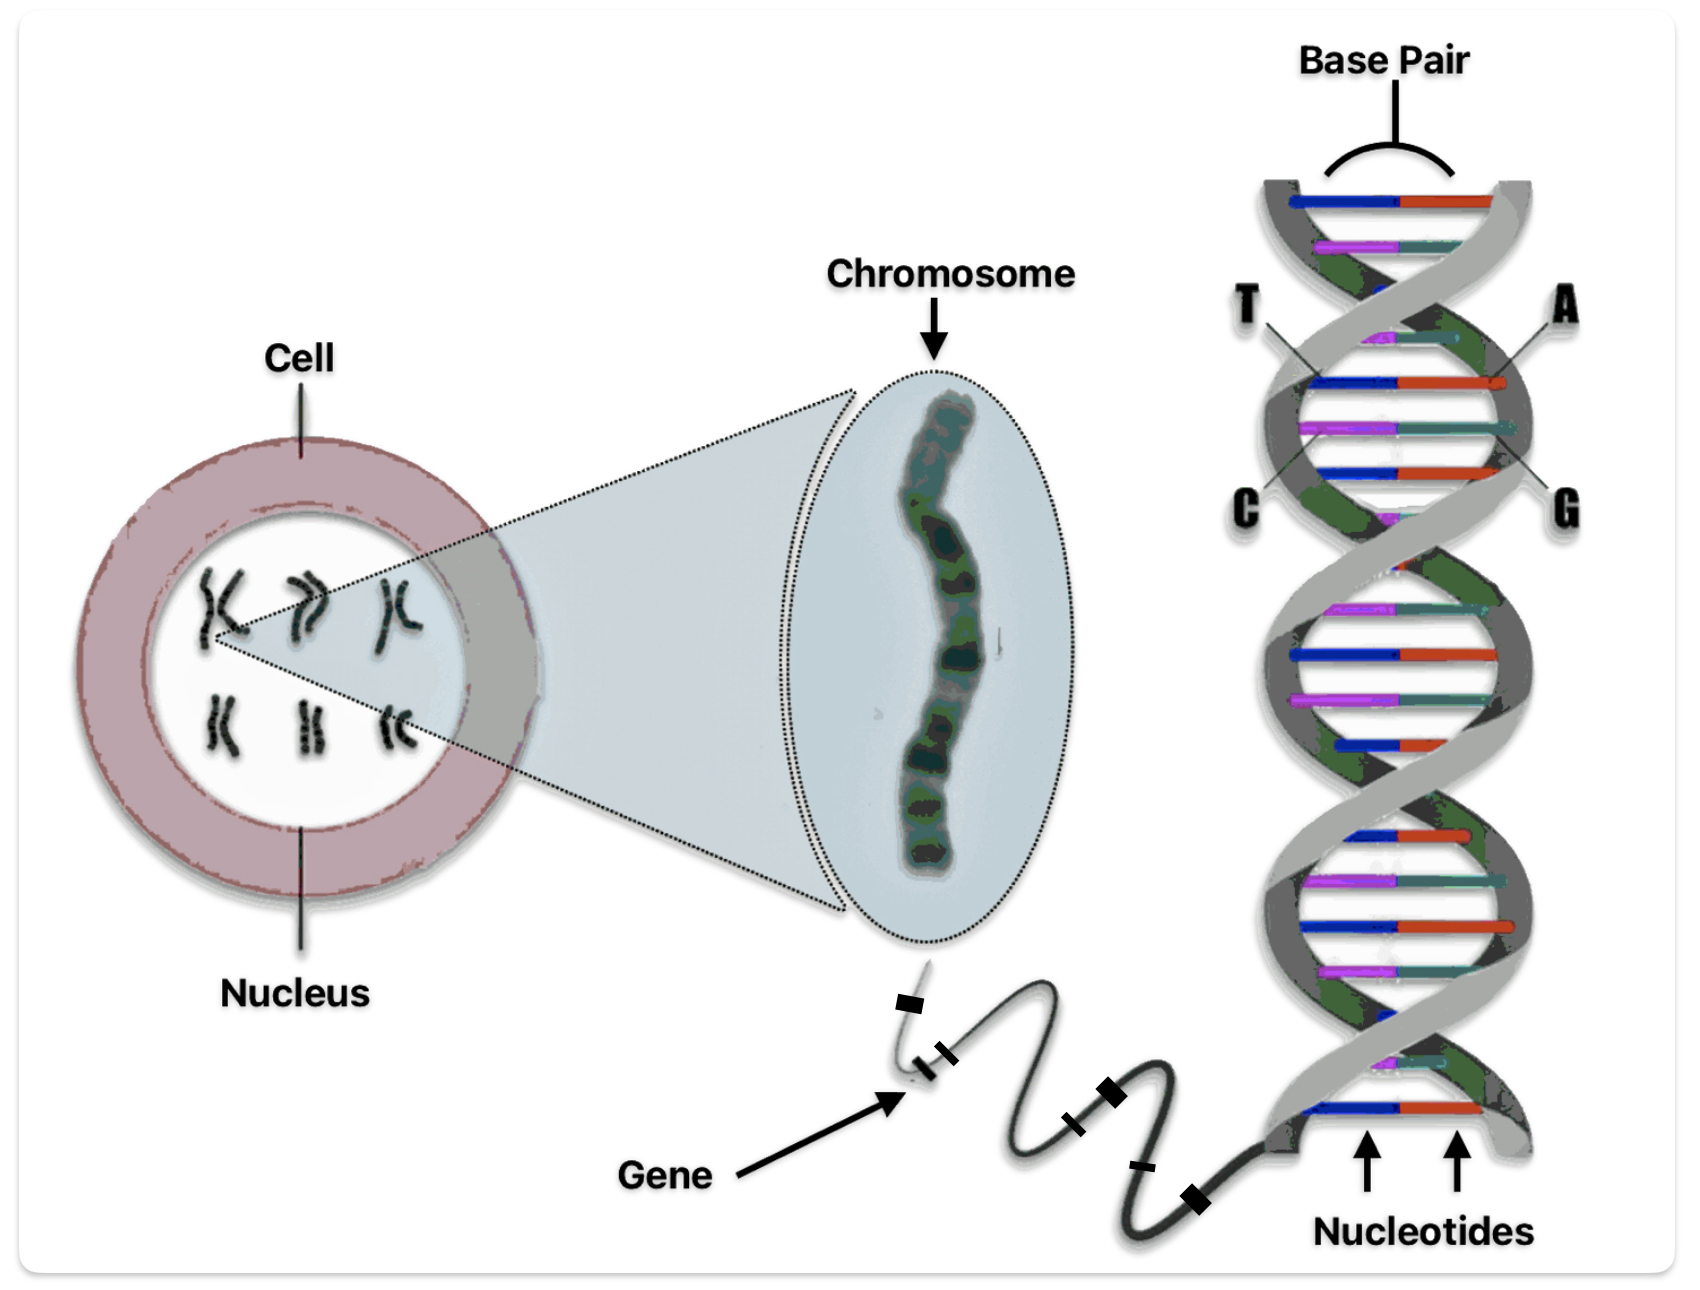
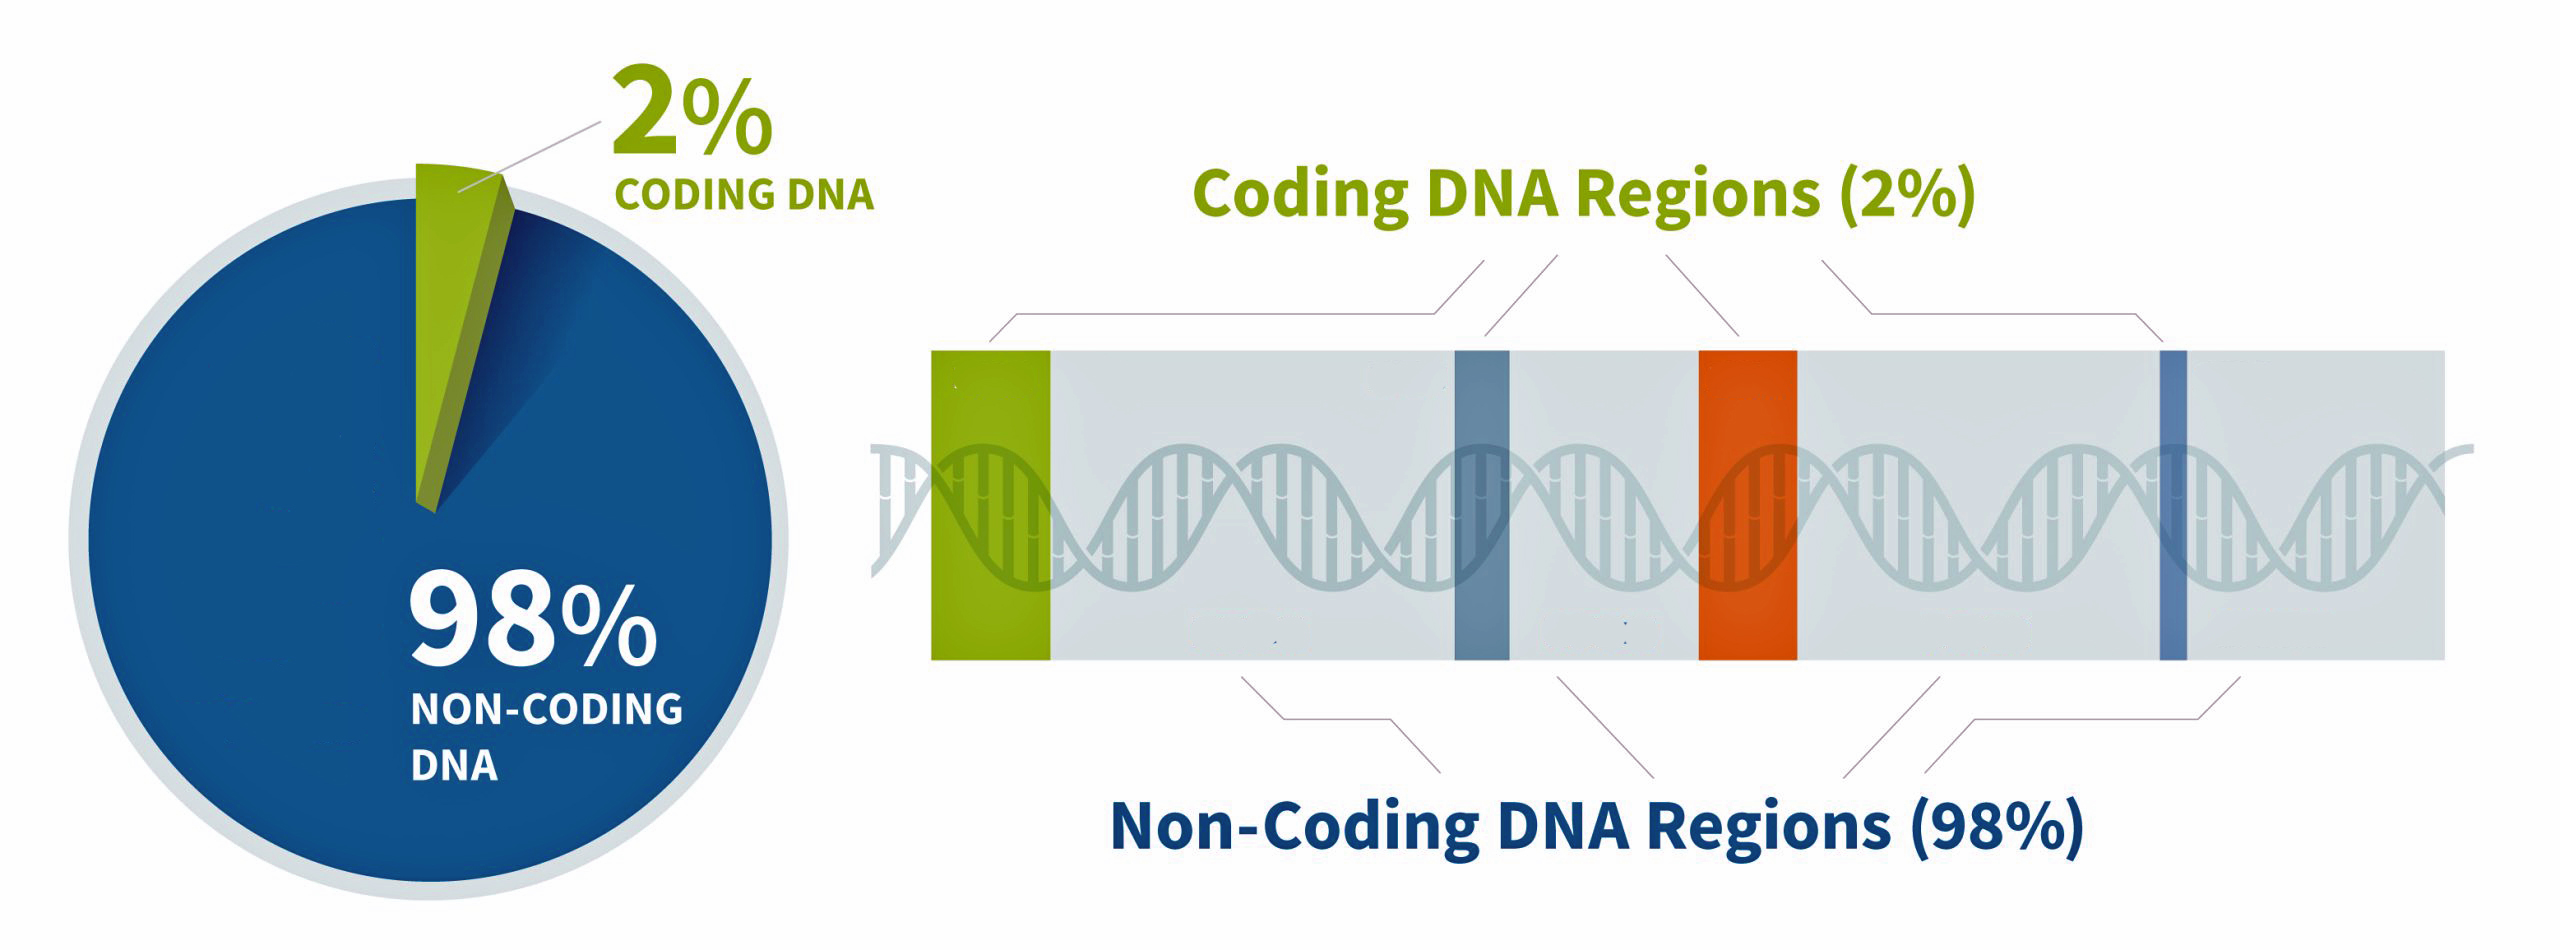
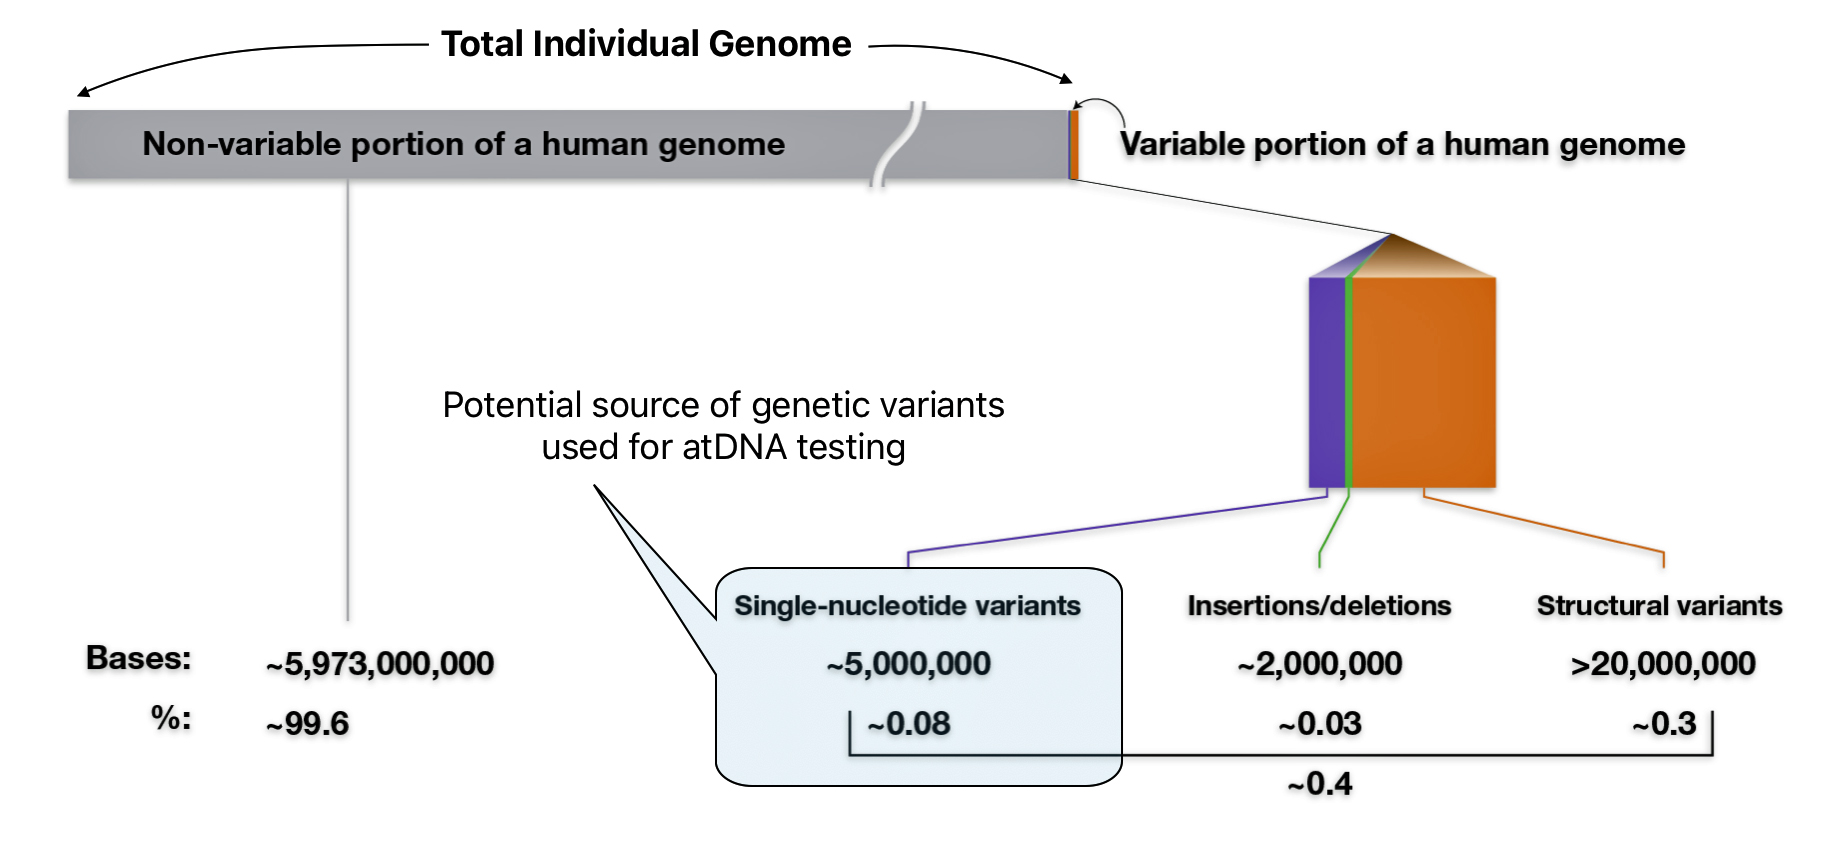
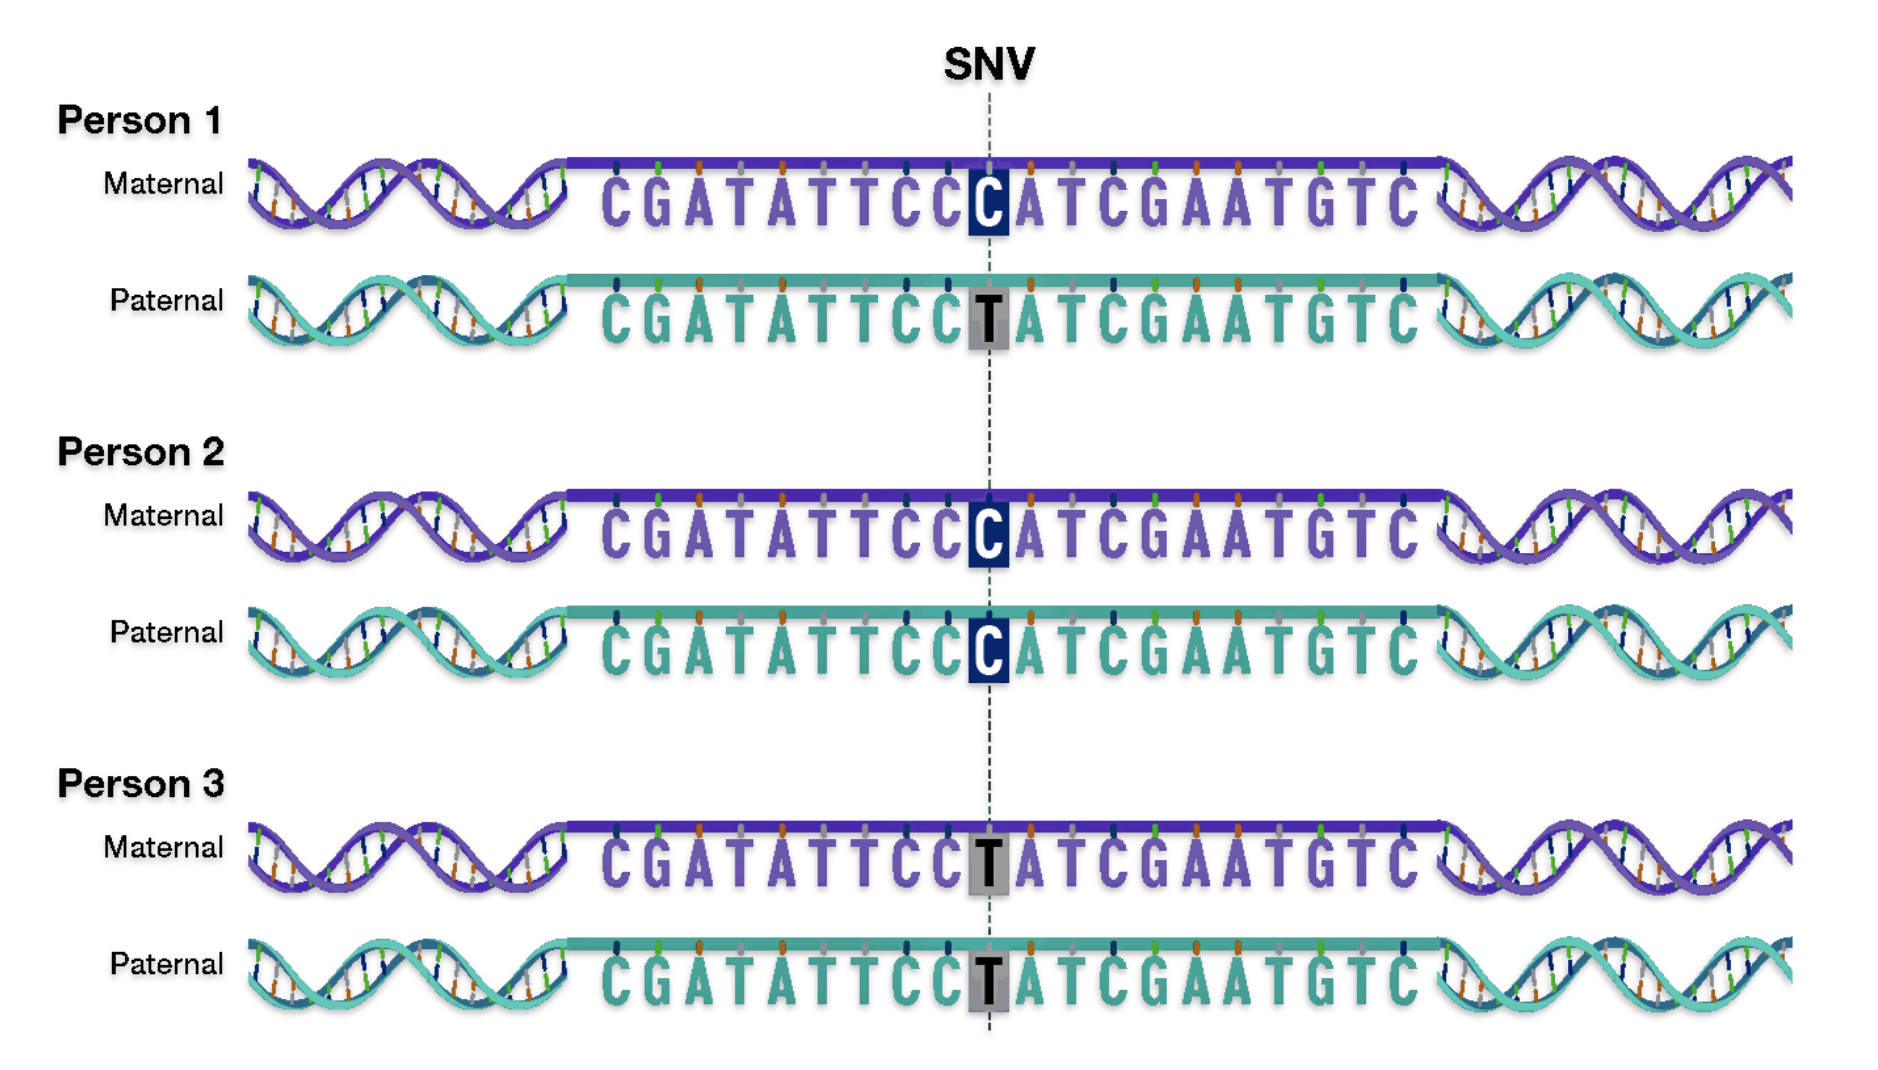
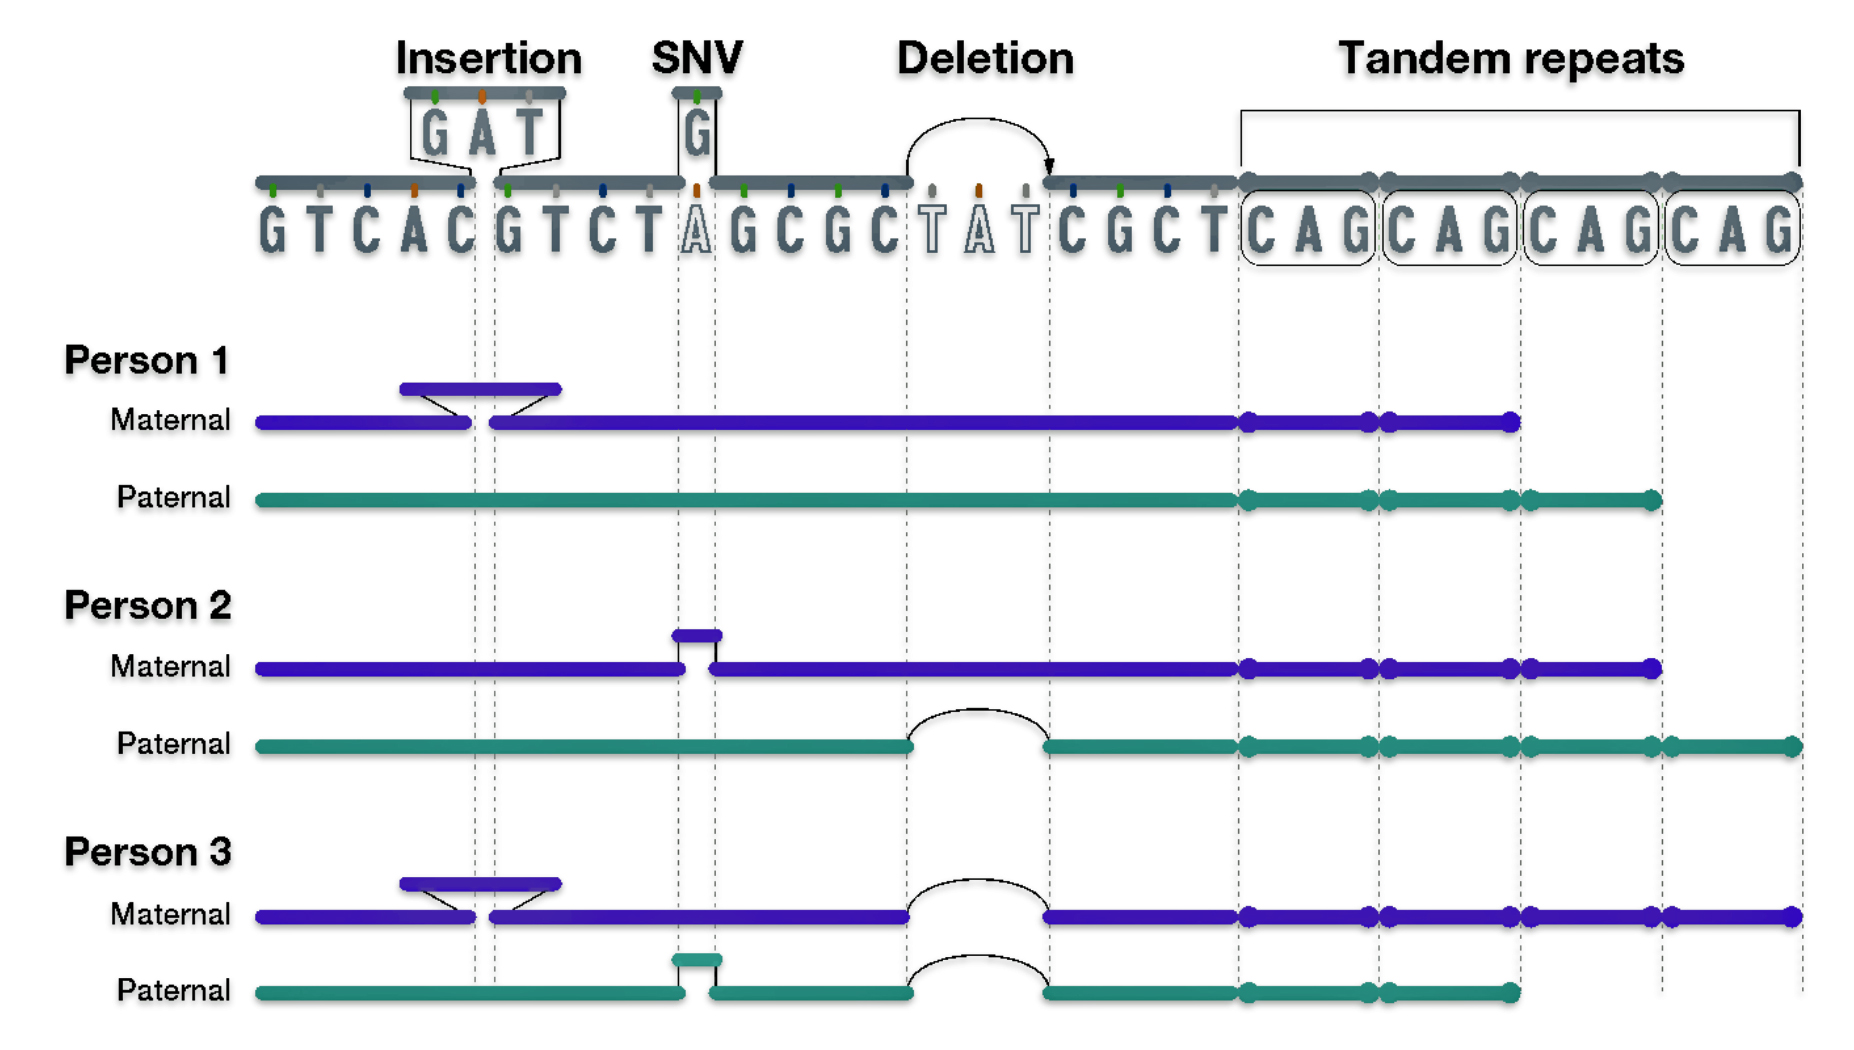

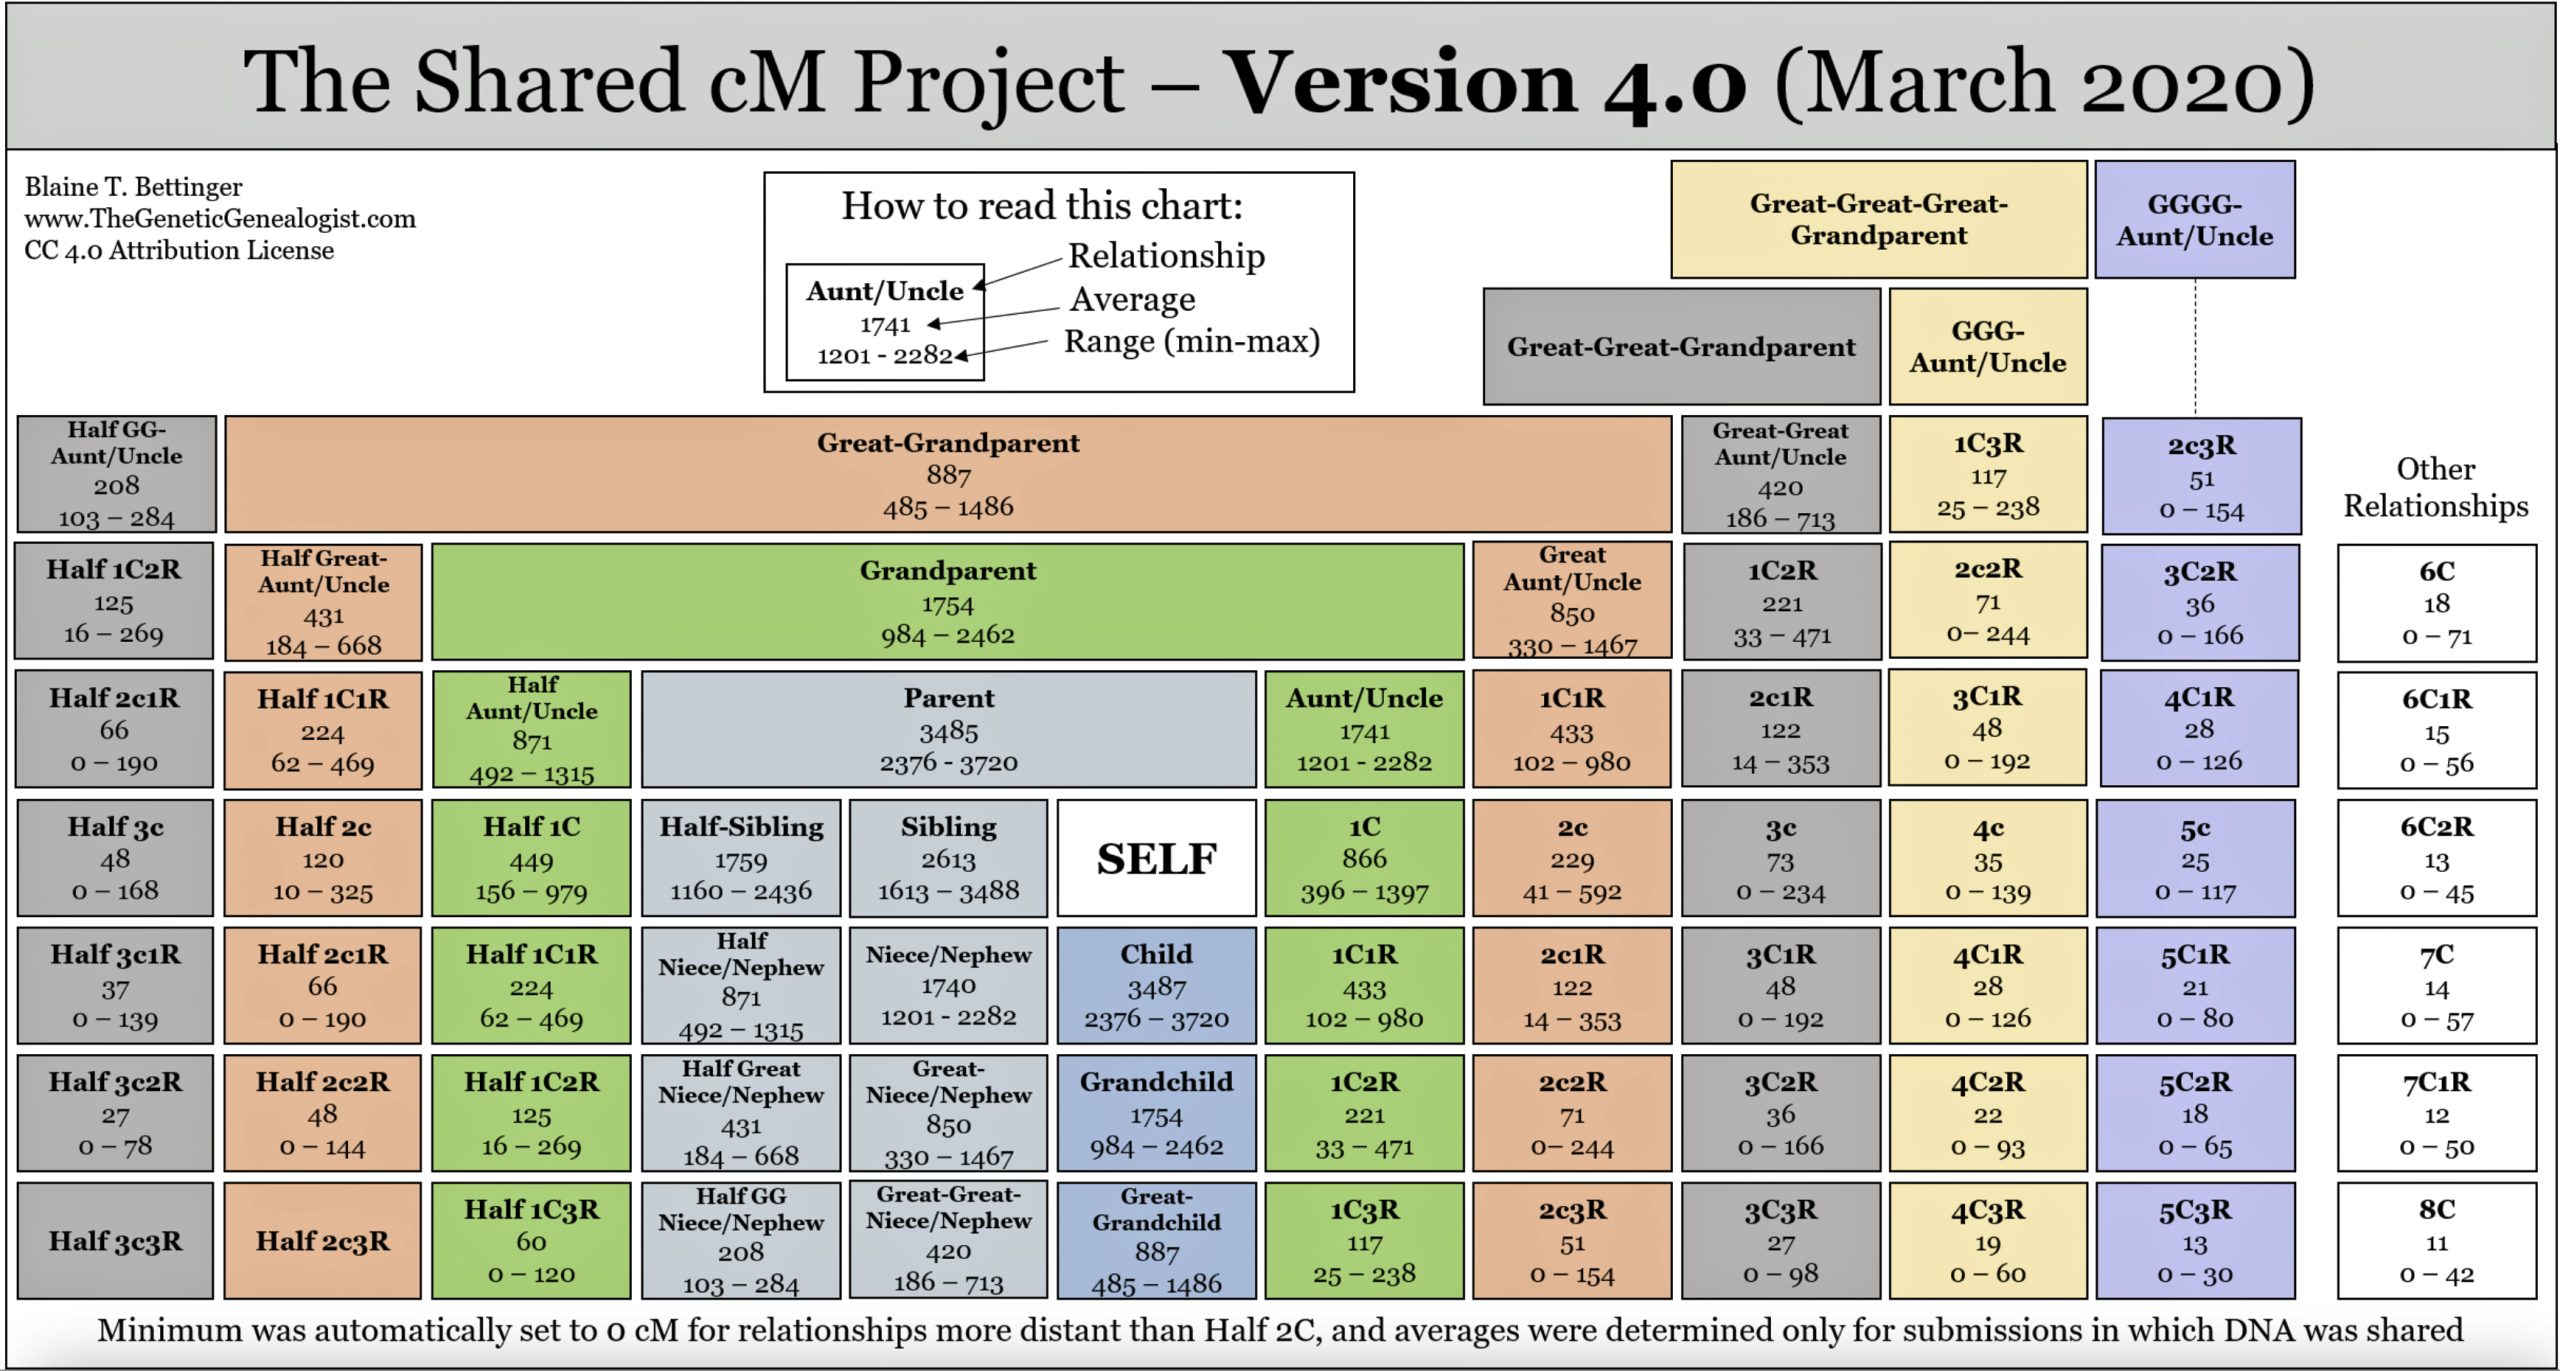
.png)