Autosomal DNA Tests: Estimating Genetic Relationships and Discovering Relatives

In prior posts, I discussed the utility of Y-DNA tests as a possible avenue to gain insights and possible leads on identifying information about tracing the lineage associated with family surnames for the Griffis(ith)(es) family. [1] I have not discussed my experience of using autosomal DNA tests for genealogical and family research.

There are perhaps two unique things that atDNA tests can provide. They can:

  • identify unknown living relatives and their possible relationships; and
  • identify a possible relationship of a common ancestor that you share with a living relative.

My experience with atDNA tests have largely resulted in the initial discovery of many living third to fifth generational cousins. However, all of these distant cousins fail to document their respective lines of descent in various DNA company databases. The lack of this additional genealogical information makes it difficult to document where our common distant family connections are located.

A few of the genetic connections from the atDNA tests have provided documentation on common family connections. Based on their information, I have been able to identify a few distant connections. On two other occasions, I have discovered two half brothers.

This three part story focuses on the merits and limitations as well as my personal experience of using autosomal DNA (atDNA) tests for documenting genetic kinship ties in the Griffis family. This part provides general background to make sense of the DNA results. The second part of the story discusses my ongoing DNA discoveries from these tests. As such, the information can change in the future. The third part is devoted to my profound discovery of having two half siblings David and Greg.

General Comparison of DNA Tests

Depending on the DNA test, they tell you how much of their DNA you have inherited from unspecified ancestors on each side of your family or how far back you can trace genetic lineages through a maternal or paternal line. Genetic genealogy or results from DNA tests do not tell you where each member on your family tree lived or provide information on their specific family relationships.

DNA results can identify matches of living individuals and their possible shared kinship relationships. These estimates are based on the amount of shared DNA segments between the match and you. When it comes to identifying specific individuals and verifying kinship relationships, traditional genealogical research is typically required for interpretation of the results. [2]

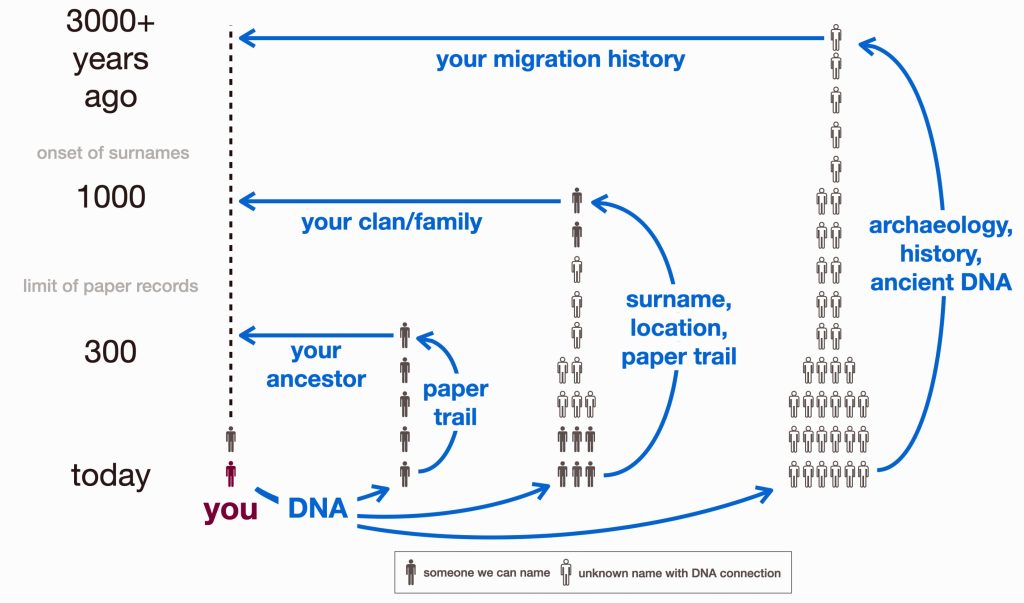
There are basically three types of genetic tests used in genealogical research. Autosomal ancestry (atDNA), Y-DNA, and mitochondrial DNA (mtDNA) tests (see illustration one below). Autosomal tests can analyze a broader range of genetic family network ties than the Y-DNA or mtDNA tests. Y-DNA and mtDNA tests respectively trace the paternal and maternal sides of one’s genetic history. The atDNA tests are broader in their ability to trace genetic relatives on both sides of your family tree. However, their effectiveness of tracing ancestors is limited in terms of how many generations back they can effectively provide results. Another unique characteristic of the atDNA tests is matching living test takers through the amount of shared autosomal DNA.

Illustration One: Three Types of DNA Tests

Click for Larger View | Source: Modified version of an image found at Edward Sweeney, Types of DNA Test, MacDugall DNA Research Project, https://macdougalldna.org/types-of-dna-test-b/

As indicated in table one, while limited to the paternal line of descent, Y-DNA tests can effectively track male genetic descendants back around 300,000 years. Mitochondrial testing of the matrilineal line can also provide results that go back over 140 thousands of years. The popular atDNA ‘ethnicity’ tests can trace back through a limited number of generations. While women have two X chromosomes, DNA testing of the X-DNA is usually tested along with other chromosomes as part of an atDNA test. [3]

Table 1: Type of DNA Testing

CharacteristicAutosomal
DNA (atDNA)
Y – DNA (YDNA)Mitochondrial
DNA (mtDNA)
What does it test?All autosomal chromosomesY chromosomeMitochondria
Available toBoth males and
females
Only males can
take test
Both males and
females
How far back?5 – 9 generations~155,000 Years~200,000+ years
Source of TestingAutosomal
Chromosomes
Y ChromosomeX Chromosom
found in Mitochondria
What genealogical lines tested?All ancestry linesOnly Paternal (father’s
father’s father, etc)
Maternal (mother’s
mother’s mother, etc.)
Benefits – utilityFinding relatives within
a few generations, determining broader
ethnicity estimations,
identifying potential
matches across both sides
Tracing direct
paternal lines, surnames,
identifying specific
paternal lineages and haplogroups,
studying deep paternal ancestry
Tracing a direct
maternal line,
identifying maternal haplogroups,
analyzing ancient
ancestry patterns
Available from
the following
companies:
– ancestry.com
– Family Tree DNA
– 23andMe
– Myheritage
– Living DNA
– Family Tree DNA
– 23andME (high level)
– YSEQ
– Full Genome Corp
– Family Tree DNA
– 23andMe
– YSEQ
– Full Genome Corp

Autosomal DNA tests are useful for finding relatives, such as unknown relatives, clarifying uncertain family relationships and identifying distant relatives. Typically DNA companies identify matches up to six generations. The Y-DNA and mtDNA tests, while limited to only tracing paternal lines or maternal lines respectively, can trace genetic lineage back over 150,000 years.

Popularity of Autosomal DNA Tests

“For about a hundred dollars, it is now possible to spit into a tube, drop it in the mail, and within a couple of months gain access to a list of likely relatives. If you have any colonial American ancestors, the first thing you realize, taking a DNA test for genealogical purposes, is that potential sixth cousins are a whole lot easier to come by than you ever imagined. Even fifth cousins — people with whom you share a fourth great-grandparent — aren’t a particular scarcity.” [4]

These tests provide information about an individual’s ancestral roots, and they can help to connect people with their relatives, sometimes as distantly related as fourth or fifth cousins. Such information can be particularly useful when a person does not know their genealogical ancestry (eg. many adoptees and the descendants of forced migrants). [5]

The direct-to-consumer genetic testing market has shown significant growth in recent years, but there are indications of a recent slowdown in sales in 2023.

As many people purchased consumer DNA tests in 2018 as in all previous years combined. [6] Combined with prior years of personal consumer testing, more than 26 million consumers had added their DNA to ostensibly four leading commercial ancestry and health databases.

Chart One: atDNA Database Growth

Click for Larger View | Source: 23andMe Has More Than 10 Million Customers, April 8, 2019, The DNA Geek Blog, https://thednageek.com/23andme-has-more-than-10-million-customers/

In late 2019, there were signs of declining sales. Ancestry and 23andMe saw drops in direct website sales of 38% and 54% respectively compared to 2018. [7]

“Less than five years ago, consumer DNA tests were being hailed as the innovative technology of the future—but today, declining sales have forced several companies in the field to scale back their workforces and adjust their business strategies.” [8]

Market data from DNA companies suggest that the market continues to grow, albeit at a slower rate than the initial boom years. Projections include all type of DNA tests (e.g. genetic relatedness, ancestry, lifestyle wellness, reproductive health, personalized medicine, sports nutrition, reproductive health, diagnostics and others). Factors like market saturation among early adopters and privacy concerns may be contributing to the moderation in growth rates.

Despite the decade-long rise in sales, in 2020 there was a sudden decline in interest. Two of the leading companies, 23andMe and AncestryDNA, experienced declines in sales of DNA ancestry kits of 54 and 38 percent, respectively. The decline was attributed to market saturation, economic recession related to the COVID-19 pandemic, and privacy concerns. [9]

Since 2021, 23andMe, a prominent direct-to-consumer genetic testing company, has faced significant financial challenges that have raised concerns about its future and the security of customer data. The company’s financial situation has deteriorated rapidly. Its stock price has plummeted, losing over 97% of its value since going public in 2021. 23andMe is reportedly on the verge of bankruptcy and has never turned a profit.  In 2023, the company suffered a major data breach affecting nearly 7 million users. The company has had turnover of board members and internal dissension between board members and executive management. [10]

This situation surrounding 23andMe serves as a cautionary tale about the risks associated with entrusting sensitive genetic information to private companies and highlights the need for robust data protection measures in the rapidly evolving field of consumer genomics. It also underscores the need to have back up contingencies of one’s DNA data. [10a]

What do atDNA Tests Measure?

Autosomal DNA tests basically measure five things.

  1. Genetic Markers: atDNA tests look at hundreds of thousands of genetic markers in a DNA sample called single nucleotide polymorphisms (SNPs) across the 22 autosomal chromosome pairs. More on SNPs later in this story. These sampled SNPs represent DNA sequences that can be used to efficiently identify genetic differences and similarities between individuals.
  2. Inheritance Patterns: The tests examine the autosomal DNA inherited from both parents, which includes genetic contributions from all recent ancestors. This allows for connections to be made with relatives on all “recent” branches of a family tree, not just direct paternal or maternal lines in the past six or so generations.
  3. Genetic Relatives: The tests identify shared DNA segments between the test taker and other individuals in the DNA test company’s database, allowing for the discovery of genetic relatives that are living and linking each matched DNA tester to past generations.
  4. Ethnicity Estimates: By comparing an individual’s genetic markers to reference populations maintained by a DNA test company, autosomal DNA tests can provide estimates of a person’s ancestral origins and ethnic background.
  5. Health Traits: Many atDNA testing companies also include screening for certain inherited health conditions or physical traits that can play in one’s life to identify certain genetic code that could affect health.

The Genetic Influence of Autosomal DNA

An atDNA test is a measurement of sampled parts of your 22 autosomal chromosomes. Everyone (with rare exceptions) is born with a set of 23 pairs of chromosomes. The twenty-third chromosome is the sex chromosome. In most cases, we inherit an X chromosome from our mother and a Y or X chromossome from our father to determine our sex differentiation. (See illustration two).

Illustration Two: Karyotype of Human Chromosomes [11]

Click for Larger View | Source: Karyotype, National Genome Human Genome Research Institute, https://www.genome.gov/genetics-glossary/Karyotype

We inherit half of our chromosomes from our mother and the other half from our father. Two of those pairs are usually sex chromosomes (for most cases, XX in females and XY in males). The remaining 22 pairs of chromosomes are autosomal chromosomes or autosomes. For example, as illustrated below, chromosomes from the depicted mother are labeled in purple, and chromosomes from the depicted father are labeled in teal. (See illustration three).  [12]

Illustration Three: Inheritance of Parental Chromosomes

Click for Larger View| Source: Human Genomic Variation, Fact Sheet, National Human Genome Research Institute, 1 Feb 2023, https://www.genome.gov/about-genomics/educational-resources/fact-sheets/human-genomic-variation

The genetic inheritance patterns associated with autosomal chromosomes become more complex and diluted over generations due to recombination and variable inheritance patterns. [13] Illustration four shows the average amount of atDNA inherited by all close relations up to the third cousin level. The illustration uses the maternal side as a an example. The percentages can be replicated for the paternal side. [14] As reflected in the chart, fifty percent of one’s atDNA is inherited from each parent and roughly equally portions from grandparents to about 3x great-grandparents. 

Illustration Four: Percent of Autosomal Genetic Inheritance from Descendants

Click for Larger View | Source: Dimario, A chart illustrating the different types of cousins, including genetic kinship marked within boxes in red which shows the actual genetic degree of relationship (gene share) with ‘self’ in percentage (%), 27 April 2010, Wikimedia Commons, https://commons.wikimedia.org/wiki/File:Cousin_tree_(with_genetic_kinship).png

During meiosis [15], genetic recombination occurs, shuffling segments of DNA from each of the parents. This means that siblings may inherit different combinations of DNA segments from their parents; and with each generation, the specific segments inherited become more randomized. As a result, the amount of shared DNA between relatives decreases exponentially with each generation, making it more challenging to detect distant relationships through autosomal testing.

The random nature of genetic inheritance leads to variability in how much DNA is shared between relatives, especially for more distant relationships. This is known as variable expressivity. [16] For example, as indicated in table two, full siblings may share anywhere from about 35% to 65% of their DNA; and first cousins typically share around 12.5% of their DNA, but the actual range can vary significantly. This variability increases with more distant relationships, making it harder to precisely determine the degree of relatedness based solely on shared DNA percentages (see table two).  [17]

Table Two: Average Percent of Autosomal DNA Shared Between Selected Relatives

RelationshipAverage Percent
of DNA Shared
Range of DNA
Shared
Identical Twin100%N/A
Parent-Child50% (but 47.5% for father-son relationships)N/A
Full Sibiling50%38% – 61%
Half Sibling
Grandparent / Grandchild
Aunt / Uncle
Niece / Nephew
25%17% – 34%
1st Cousin
Great-grandparent
Great-grandchild
Great-Uncle / Aunt
Great Nephew / Niece
12.5%4% – 23%
1st Cousin once removed
Half first cousin
6.25%2% – 11.5%
2nd Cousin3.13%2% – 6%
2nd Cousin once removed
Half second cousin
1.5%0.6% – 2.5%
3rd Cousin0.78%0% – 2.2%
4th Cousin0.20%0% – 0.8%
5th Cousin
to Distant Cousin
0.05%
Source: Average Percent DNA Shared Between Relatives, 23andMe Customer Care, Tools, 23andMe, https://customercare.23andme.com/hc/en-us/articles/212170668-Average-Percent-DNA-Shared-Between-Relatives

While autosomal DNA testing has become increasingly accurate, there are still limitations in the context of estimating genetic relations and finding relatives. Current testing methods typically analyze only a subset of genetic markers. In addition, the interpretation of results relies on comparison to reference populations, which may not fully represent all ancestral groups. In the end, as previously stated, traditional genealogical research brings atDNA results into focus.

Genetic Variants: The Genetic Basis of atDNA Testing

genome is the complete set of DNA instructions found in every cell. [18] As discussed in a prior story, the human cell is a masterpiece of data compression. [19] Its nucleus, just a few microns wide, contains (if you ‘spell’ it out) six feet of genetic code comprised in a double helix called the DNA: deoxyribonucleic acid (see illustration five).

Illustration Five: Structure of Deoxyribonucleaic Acid (DNA)

Source: Modified image of DNA as found in Ruairo J Mackenie, DNA vs. RNA – 5 Key Differences and Comparison, 18 Dec 2020, updated 24 Jan 2024, Technology Networks, Genomics Research, https://www.technologynetworks.com/genomics/lists/what-are-the-key-differences-between-dna-and-rna-296719

The DNA helical molecules string together some three billion pairs of nucleotides that are comprised of proteins, sugar (deoxyribose), a phosphate and four types of nitrogenous bases which are represented by an initial: A (adenine), C (cytosine), G (guanine), and T (thymine). Nucleotides are the fundamental building blocks that make up the DNA strands. The sequence of nucleotides along the DNA strand encodes genetic information and regulates when codes are activated. [20]

The nucleotides form base pairs and are the cornerstone of genetic testing. (See illustration six.) They are the foundation of the programming language of our genetic code. Whenever a particular base is present on one side of a strand of the DNA, its complementary base is found on the other side. Guanine always pairs with cytosine. Thymine always pairs with adenine. So one can write the DNA sequence by listing the bases along either one of the two sides or strands. When DNA companies perform their tests, they essentially separate the two stands of the helix and use one side of the helix as the template or coding strand when they map out an individual’s DNA results.

Illustration Six: Relationship between Nucleotides, Base Pairs, Chromosomes, Genes, and DNA

Approximately 2% of our genome encodes proteins – this is where gene strands are located (illustration seven).  Coding “gene” DNA makes up only about one to three percent of the human genome, while noncoding DNA comprises approximately 97-99% of our total genetic material. This distribution shows that the vast majority of our genome consists of noncoding sequences. [21]

Genes are the basic unit of inherited DNA and carry information for making proteins, which perform important functions in your body. The coded regions of the genome produce proteins with structural, functional, and regulatory roles in cells and to a larger extent the human body. The remainder of our genome is made of noncoding DNA, sometimes called “junk DNA”, which is a misnomer. It is estimated that between 25% and 80% of non-coding DNA regulates gene expression (e.g. when, where, and for how long a gene is turned on to make a protein). [22] The non-coding DNA that does not regulate gene activity is composed either of deactivated genes that were once useful for our non-human ancestors (like a tail) or parasitic DNA from virus that have entered our genome and replicated themselves hundreds or thousands of times over the generations, or generally serve no purpose in the host organism.

Illustration Seven: Coding and Non-Coding Regions of the Genome

Clck for Larger View | Source: Modified version of graphic found at – Non-Coding DNA, AncestryDNA Learning Hub, https://www.ancestry.com/c/dna-learning-hub/junk-dna

Out of 3.2 billion DNA letters or nucleotides, there are only a ‘handful of places’ on the DNA ribbon that might be different between individuals. Humans share a very high percentage of their DNA. The exact figure is subject to some debate and depends on how it is measured. The commonly cited figure is that humans are 99.9% genetically identical. More recent research suggests a slightly lower, but still very high, level of similarity. Humans share a very high percentage of their DNA – roughly 99.4% to 99.9%. The small differences of 0.1 and 0.6 between individuals are crucial for understanding human diversity and health. [23]

As indicated in illustration eight, there are multiple types of genomic variants that comprise 0.4 percent of the genome.. The smallest genomic variants are known as single-nucleotide variants (SNVs). Each SNV reflects a difference in a single nucleotide (or letter) in the DNA chain. For a given SNV, the DNA letter at that genomic position might be a C in one person but a T in another person as reflected in illustration nine. [24]

Illustration Eight: Potential Sources of Genetic Variants for atDNA Testing

Click for Larger View | Source: Modification of a chart found at – Chart Human Genomic Variation, Fact Sheet, National Human Genome Research Institute, 1 Feb 2023, https://www.genome.gov/about-genomics/educational-resources/fact-sheets/human-genomic-variation

Single-nucleotide variants (SNVs) are differences of one nucleotide at a specific location in the genome. An individual may have different nucleotides at a specific location on each chromosome (getting a different one from each parent), such as with Person 1 in illustration nine. An individual may also have the same nucleotide at such a location on both chromosomes, such as with Person 2 and Person 3 in the illustration.

Illustration Nine: An Example of a single-nucleotide variant (SNV)

Click for Larger View | Source: Human Genomic Variation, Fact Sheet, National Human Genome Research Institute, 1 Feb 2023, https://www.genome.gov/about-genomics/educational-resources/fact-sheets/human-genomic-variation

As reflected in illustration ten below, there are also a small group of genetic variants that are called insertions and deletions of nucleotides.

“Insertion/deletion variants reflect extra or missing DNA nucleotides in the genome, respectively, and typically involve fewer than 50 nucleotides. Insertion/deletion variants are less frequent than SNVs but can sometimes have a larger impact on health and disease (e.g., by disrupting the function of a gene that encodes an important protein).” [25]

One of the most common types of insertion/deletion variants are tandem repeats. [26] Tandem Repeats are short stretches of nucleotides that are repeated multiple times and are highly variable among people. Different chromosomes can vary in the number of times such short nucleotide stretches are repeated, ranging from a few times to hundreds of times.

Each person has a collection of different genomic variants. For example, in illustration ten below, Person 1 has an insertion variant; Person 2 has a SNV and deletion variant; and Person 3 has an insertion, SNV, and deletion variant. All three people have different tandem repeats. Different variants can be inherited from different parents as reflected in the illustration.

Illustration Ten: Examples of Other Types of Genetic Variants

Click for Larger View | Source: Human Genomic Variation, Fact Sheet, National Human Genome Research Institute, 1 Feb 2023, https://www.genome.gov/about-genomics/educational-resources/fact-sheets/human-genomic-variation

As indicated in illustration seven above, the third general type of genomic variations are structural variants (SVs). Structural variants extend beyond small stretches of nucleotides to larger chromosomal regions. These large-scale genomic differences involve at least 50 nucleotides and as many as thousands of nucleotides that have been inserted, deleted, inverted or moved from one part of the genome to another. [27]

Tandem repeats that contain more than 50 nucleotides are considered structural variants. In fact, such large tandem repeats account for nearly half of the structural variants present in human genomes. When a structural variant reflects differences in the total number of nucleotides involved, it is called a copy number variant (CNV). CNVs are distinguished from other structural variants, such as inversions and translocations, because the latter types often do not involve a difference in the total number of nucleotides. [28]

Cornerstone of atDNA Testing: Single Nucleotide Polymorphisms (SNPs)

A subtype of SNVs is the single-nucleotide polymorphism (SNP), pronounced as “snip” for short. To be considered a SNP, a SNV must be present in at least 1% of the human population. As such, a SNP is more common than the rare single-nucleotide differences.  [29]

Among the genetic variants, SNPs are relatively common, occurring approximately once every 500-1000 base pairs in the human genome. This translates to about 4 to 5 million SNPs in an individual’s genome. Scientists have found more than 600 million SNPs in populations around the world. The combination of technical feasibility, scientific reliability, and analytical power makes SNPs the optimal choice for autosomal DNA testing in genealogical and ancestry applications. [30]

Ancestry information markers refers to locations in the genome that have varied sequences at that location and the relative abundance of those markers differs based on the continent from which individuals can trace their ancestry. So by using a series of these ancestry information markers, sometimes 20 or 30 more, and genotyping an individual you can determine from the frequency of those markers where their great, great, great, great ancestors may have come from. [31]

SNPs represent natural variations that make individuals unique while being common enough to be reliable DNA test markers. Their high frequency makes them ideal markers for genetic analysis. The vast majority of SNPs have no effect on health or development. SNPs are generally found in the DNA between genes rather than within genes themselves. [32]

While other genetic markers exist, SNPs are preferred ancestry information markers. SNPs are used for genetic testing based on their reliability and accuracy. SNPs are stable genetic markers that are passed down through generations. SNPs offer more detailed information about both recent and ancient ancestry. They also allow for fairly precise ethnic profiling and ancestral location inference.[33]

How atDNA Tests Figure Out Genetic Relationships

In a “Nutshell”: How do DNA companies Figure Out Genetic Relationships

Analyzing SNPs: DNA companies analyze hundreds of thousands of single nucleotide polymorphisms (SNPs) across the 22 autosomal chromosomes. [34]

The results from different atDNA test companies can vary. The variance is based on a number of factors. All major DNA testing companies use equipment that analyze DNA specimens with what are called ‘chips’ that use DNA microarray technology supplied by a company named Illumina. However, different companies use different versions of the Illumina chip and each version tests different sets of SNP (Single Nucleotide Polymorphism) locations.

Illustration Ten: How DNA Microarray Technology Analyzes Autosomal DNA

Source: Bergström, Ann-Louise and Lasse Folkersen , DNA microarray, 15 May 2020, Moving Science, https://movingscience.dk/dna-microarray/

Companies can specify their own “other” locations to be included on their chip. The number of markers tested varies significantly by company. FamilyTreeDNA uses a customized Illumina chip. 23andMe and AncestryDNA use a customized Illumina Global Screening Array (GSA) chip. Living DNA uses an Affymetrix Axiom microarray (Sirius) chip. My Heritage uses an Illumina GSA chip. [35]

Illustration of Illumina Microarray Chips

Source: Web Graphic Array with GE Inserts, Illumina, Powerfully Informative Microarrays, Illumina,https://www.illumina.com/techniques/microarrays.html

“Each DNA testing company purchases DNA processing equipment. Illumina is the big dog in this arena. Illumina defines the capacity and structure of each chip. In part, how the testing companies use that capacity, or space on each chip, is up to each company. This means that the different testing companies test many of the same autosomal DNA SNP locations, but not all of the same locations. … This means that each testing company includes and reports many of the same, but also some different SNP locations when they scan your DNA. …  In addition to dealing with different file formats and contents from multiple DNA vendors, companies change their own chips and file structure from time to time. In some cases, it’s a forced change by the chip manufacturer. Other times, the vendors want to include different locations or make improvements.” [36]

When DNA companies change DNA chips, a different version of the company’s own file may contain different positions. DNA testing companies have to “fill in the blanks” for compatibility, and they do this using a technique called imputation. Illumina forced their customers to adopt imputation in 2017 when they dropped the capacity of their chip. [37]

Identify Matching Segments: The DNA test software for respective DNA companies compare the SNP data between two individuals to identify segments of DNA that appear to be identical or similar. These matching DNA segments indicate the likelihood of DNA inherited from a common ancestor. [38]

The ability to identify DNA matches between individuals is largely influenced by the size of database tests and the SNPs that were sampled to atDNA tests. As indicated, there are main differences between atDNA tests from various companies (e.g. 23andMe, Ancestry.com, FamilyTree DNA, LivingDNA, MyHeritage) regarding SNPs that are tested and the relative size of their respective database results.

Each company maintains its own proprietary reference databases and matching algorithms. As indicated in table three below, AncestryDNA has a larger customer database (over 20 million) compared to 23andMe (about 12 million). This gives AncestryDNA an advantage for finding genetic relatives.

Table Three: Data Base Size and Number of SNPs Tested by DNA Company in 2024

DNA
Company
Data Base Size of
atDNA Test Results
No. of Autosome
SNPs Tested
23andMe14 Million630,`132
FamilyTreeDNA1.7 million612,272
AncestryDNA25 million637,639
My Heritage8.5 million576,157
Living DNA300,000683,503
Source: Autosomal DNA testing comparison chart, International Society of Genetic Genalogy Wiki, This page was last edited on 8 October 2024, https://isogg.org/wiki/Autosomal_DNA_testing_comparison_chart

Measuring Segment Length: The length of matching segments of SNPs is measured in centimorgans (cM). Centimorgans measure the likelihood of genetic recombination between two markers on a chromosome. One centimorgan represents a one percent chance that two genetic markers will be separated by a recombination event in a single generation. This measurement helps geneticists and genealogists estimate how close two individuals are genetically related. [39]

Centimorgans (cM) are a crucial unit of measurement in genetic atDNA testing. It is used to quantify genetic distance and determine relationships between individuals based on shared DNA. The more centimorgans two people share, the more likely they are related. in addition to the number of cMs shared, longer segments generally indicate a closer relationship.

One cM corresponds on the average to about 1 million base pairs in humans. The total human genome is approximately 7400 cM long. A parent-child relationship typically shares about 3400-3700 cM. More distant relatives share fewer cMs. However, there can be overlap in cM ranges for different relationship types, so additional genealogical research is often needed to determine exact relationships.

(A centiMorgan) is less of a physical distance and more of a measurement of probability. It refers to the DNA segments that you have in common with others and the likelihood of sharing genetic traits. The ends of shared segments are defined by points where DNA swapped between two chromosomes, and the centimorgan is a measure of the probability of getting a segment that large when these swaps occur.” [40]

Chart One: Ranges of Shared centiMorgans with Family

Click for Larger View | Source: Bettinger, Blaine, Version 4.0! March 2020 Update to the Shared cM Project!, 27 Mar 2020, The Genetic Genealogist, https://thegeneticgenealogist.com/2020/03/27/version-4-0-march-2020-update-to-the-shared-cm-project/

When you take an atDNA test, the testing company compares your DNA to others in their database. The amount of DNA you share with a match is reported in centimorgans. Generally, the more centimorgans you share with someone, the more closely you are related to this other person. Shared centimorgan ranges can often indicate how many generations separate two people. Certain shared cM values can also suggest possible half-sibling or half-first cousin relationships as opposed to full relatives.

Calculating Total Shared DNA: The total amount of shared DNA is calculated by summing up the lengths of all matching segments, typically expressed in cMs or as a percentage of the total amount of shared SNPs sampled. [41]

Applying Thresholds: Each company sets minimum thresholds for segment length and total shared DNA to be considered a match. For example, FamilyTree DNA requires at least one segment of 9 cM or more.

Table Four: Different cM Thresholds for atDNA Matches Across DNA Companies

DNA CompanyCriteria for matching segments
23andMe9 cMs and at least 700 SNPs for one half-identical region

5 cMs and 700 SNPs with at least two half-identical regions being shared
FamilyTreeDNAAll matching segments must be at least 6 cMs in length. almost all matching segments contain at least 800 SNPs & all matching segments contain at least 600 SNPs.
AncestryDNA6 cMs per segment before the Timber algorithm is applied and a total of at least 8 cMs after Timber is applied.
My Heritage8 cM for the first matching segment and at least 6 cMs for the 2nd matching segment; 12 cM for the first matching segment in people whose ancestry is at least 50% Ashkenazi Jewish
Living DNA9.46 cMs for the first segment
Source: Autosomal DNA testing comparison chart, International Society of Genetic Genalogy Wiki, This page was last edited on 8 October 2024, https://isogg.org/wiki/Autosomal_DNA_testing_comparison_chart

Relationship Prediction: The amount of shared DNA is compared to expected ranges for different relationships to predict how two people may be related. Close relationships like parent/child or full siblings have very distinct amounts of shared DNA, while more distant relationships have overlapping ranges. [42]

Special Considerations: Some of the DNA companies use phasing algorithms to improve accuracy, especially for analyzing smaller shared segments. Some also apply special algorithms for populations with higher rates of endogamy, like Ashkenazi Jews. [43]

Moving Onward

I imagine all of this makes total sense. I, however, believe, all of this is totally confusing. To walk away with some semblance of understanding, I would focus on the following observations:

  • DNA tests can only provide so much information. Traditional genealogical research brings atDNA results into focus. Genetic and traditional research strategies can work hand in hand.
  • atDNA tests have the ability to trace living genetic relatives on both sides of your family tree. However, their effectiveness is limited in terms of how many generations back they can effectively provide results.
  • While autosomal DNA testing has become increasingly accurate, there are still limitations in the context of estimating genetic relations and finding relatives.
  • When looking at atDNA matches, centimorgans (cM) are the key unit of measurement in genetic atDNA testing. It is used to determine relationships between individuals based on shared DNA. The more centimorgans two people share, the more likely they are related. in addition to the number of cMs shared, longer segments generally indicate a closer relationship.

Sources

Feature image: The image depicts a branch from a massive family tree that shows 6,000 relatives spanning seven generations.  It is part of a study that links 13 million people related by genetics or marriage.  Source: Jocelyn Kaiser, Thirteen million degrees of Kevin Bacon: World’s largest family tree shines light on life span, who marries whom, Science, 1 Mar 2018, https://www.science.org/content/article/thirteen-million-degrees-kevin-bacon-world-s-largest-family-tree-shines-light-life-span 

[1] See the following stories:

[2] Bettinger, Blaine, Everyone Has Two Family Trees – A Genealogical Tree and a Genetic Tree, 10 Nov 2009, The Genetic Genealogist, https://thegeneticgenealogist.com/2009/11/10/qa-everyone-has-two-family-trees-a-genealogical-tree-and-a-genetic-tree/

Understanding genetic ancestry testing, International Society of Genetic Genealogy Wiki, This page was last edited on on 25 August 2015, https://isogg.org/wiki/Understanding_genetic_ancestry_testing

[3] Human Y-chromosome DNA haplogroup, Wikipedia, This page was last edited on 5 October 2024,, https://en.wikipedia.org/wiki/Human_Y-chromosome_DNA_haplogroup

Human mitochondrial DNA haplogroup, Wikipedia, This page was last edited on 5 October 2024, https://en.wikipedia.org/wiki/Human_mitochondrial_DNA_haplogroup

Rowe, Katy, Genealogy’s Secret Weapon: How Using mtDNA Can Solve Family Mysteries, 10 May 2023, FamilyTreeDNA Blog, https://blog.familytreedna.com/mtdna/

MtDNA testing comparison chart, International Society of Genetic Genealogy Wiki, This page was last edited on 3 September 2023, https://isogg.org/wiki/MtDNA_testing_comparison_chart

Y chromosome DNA tests, International Society of Genetic Genealogy Wiki, This page was last edited on 6 September 2024, https://isogg.org/wiki/Y_chromosome_DNA_tests

Y-DNA STR testing comparison chart, International Society of Genetic Genealogy Wiki, This page was last edited on 11 July 2022, https://isogg.org/wiki/Y-DNA_STR_testing_comparison_chart

Balding, David, Debbie Kennett and Mark Thomas, Understanding genetic ancestry testing, This page was last edited on 25 August 2015, Iternational Society of Genetic Genealogy Wiki, https://isogg.org/wiki/Understanding_genetic_ancestry_testing

Rowe-Schurwanz, Kathy, Using mtDNA for Genealogical Research, Aug 14, 2024, FamilyTreeDNA Blog, https://blog.familytreedna.com/using-mtdna-genealogical-research/

Rowe-Schurwanz, Kathy, How Autosomal DNA Testing Works, June10, 2024, FamilyTreeDNA Blog, https://blog.familytreedna.com/how-autosomal-dna-testing-works/

Unveiling the Power of Big Y-700: Unraveling the Journey and Advantages, Oct 21, 2022, FamilyTreeDNA Blog, https://blog.familytreedna.com/big-y-700/

Mitochondrial Eve, Wikipedia, This page was last edited on 18 September 2024, https://en.wikipedia.org/wiki/Mitochondrial_Eve

Y-chromosomal Adam, Wikipedia, This page was last edited on 19 September 2024, https://en.wikipedia.org/wiki/Y-chromosomal_Adam

[4] Newton, Maud, America’s Ancestry Craze: Making sense of our family-tree obsession, June 2014, Harper’s Magazine, https://harpers.org/archive/2014/06/americas-ancestry-craze/

[5] Jorde LB, Bamshad MJ. Genetic Ancestry Testing: What Is It and Why Is It Important? JAMA. 2020 Mar 17;323(11):1089-1090. doi:10.1001/jama.2020.0517 PMID: 32058561; PMCID: PMC8202415 https://www.ncbi.nlm.nih.gov/pmc/articles/PMC8202415/

[6] Antonio Regalodo, More than 26 million people have taken an at-home ancestry test, MIT Technology Review, 11 Feb 2019, https://www.technologyreview.com/2019/02/11/103446/more-than-26-million-people-have-taken-an-at-home-ancestry-test/

Covering Your Bases: Introduction to Autosomal DNA Coverage, Legacy Tree Genealogists, https://www.legacytree.com/blog/introduction-autosomal-dna-coverage

DNA Geek, Family DNA Tests for Ancestry & Genealogy, Navigating the World of DNA,

[7] Has the consumer DNA test boom gone bust?, Feb 20, 2020, updated Jul 28, 2024, Advisory Board, https://www.advisory.com/daily-briefing/2020/02/20/dna-tests 

[8] Ibid

[9] Krimsky Sheldon, The Business of DNA Ancestry, in: Understanding DNA Ancestry. Understanding Life. Cambridge University Press; 2021, Pages 8-16.

Molla, Rami, Why DNA tests are suddenly unpopular, 13 Feb 2020, Vox, https://www.vox.com/recode/2020/2/13/21129177/consumer-dna-tests-23andme-ancestry-sales-decline#

Spiers, Caroline, Keeping It in the Family: Direct-to-Consumer Genetic Testing and the Fourth Amendment, Houston Law Review, Vol 59, Issue 5, May 23 2020, https://houstonlawreview.org/article/36547-keeping-it-in-the-family-direct-to-consumer-genetic-testing-and-the-fourth-amendment

Has the consumer DNA test boom gone bust?, Updated 28 Jul 2023, Advisory Board, https://www.advisory.com/daily-briefing/2020/02/20/dna-tests

Linder, Emmett, As 23andMe Struggles, Concerns Surface About Its Genetic Data, 5 Oct 2024, New York Times, https://www.nytimes.com/2024/10/05/business/23andme-dna-bankrupt.html

Estes, Roberta, DNA Testing Sales Decline: Reason and Reasons, 11 Feb 2020, DNAeXplained – Genetic Genealogy Blog, https://dna-explained.com/2020/02/11/dna-testing-sales-decline-reason-and-reasons/

[10] Fish, Eric, The Sordid Saga of 23andMe, 21 Oct 2024, All Science Great & Small, https://allscience.substack.com/p/the-sordid-saga-of-23andme

Prictor, Megan, Millions of People’s DNA in Doubt as 23andMe Faces Bankruptcy, 21 Oct 2024, Science Alert, https://www.sciencealert.com/millions-of-peoples-dna-in-doubt-as-23andme-faces-bankruptcy

Linder, Emmett, As 23andMe Struggles, Concerns Surface About Its Genetic Data, 5 Oct 2024, New York Times, https://www.nytimes.com/2024/10/05/business/23andme-dna-bankrupt.html

Allyn, Bobby, 23andMe is on the brink. What happens to all its DNA data?, NPR, https://www.npr.org/2024/10/03/g-s1-25795/23andme-data-genetic-dna-privacy

23andMe Facing Bankruptcy, FoxLocal 26, , https://youtu.be/ZfBOCxbWAeY

[10a] Estes, Roberta, 23andMe Trouble – Step-by-Step Instructions to Preserve Your Data and Matches, 19 Sep 2024, DNAeXplained – Genetic Genealogy, https://dna-explained.com/2024/09/19/23andme-trouble-step-by-step-instructions-to-preserve-your-data-and-matches/

[11] A karyotype is a visual representation of an individual’s complete set of chromosomes, displaying their number, size, and structure, typically arranged in pairs and ordered by size.

“A karyotype is the general appearance of the complete set of chromosomes in the cells of a species or in an individual organism, mainly including their sizes, numbers, and shapes. … A karyogram or idiogram is a graphical depiction of a karyotype, wherein chromosomes are generally organized in pairs, ordered by size and position of centromere for chromosomes of the same size.”

Karotype, Wikipedia, This page was last edited on 12 September 2024, https://en.wikipedia.org/wiki/Karyotype

Karyotype, Wikipedia, This page was last edited on 17 October 2024,, https://en.wikipedia.org/wiki/Karyotype

Dutra, Ameria, Karyotype, National Genome Human Genome Research Institute, https://www.genome.gov/genetics-glossary/Karyotype

Karyotype, ScienceDirect, definition and discussion is from from Antonie D. Kline and Ethylin Wang Jabs, eds., Genomics in the Clinic,  2024, Shen Gu, Bo Yuan, Ethylin Wang Jabs, Christine M. Eng , Chapter 2 – Basic Principles of Genetics and Genomics,  Pages 5-28 ,  https://www.sciencedirect.com/topics/biochemistry-genetics-and-molecular-biology/karyotype 

Shen Gu, Bo Yuan, Ethylin Wang Jabs, Christine M. Eng, Chapter 2 – Basic Principles of Genetics and Genomics, Editor(s): Antonie D. Kline, Ethylin Wang Jabs, Genomics in the Clinic, Academic Press, 2024, Pages 5-28

[12] Autosomes are the non-sex chromosomes found in the cells of organisms. Autosomes are any chromosomes that are not sex chromosomes (allosomes). In humans, there are 22 pairs of autosomes, numbered from 1 to 22. They come in identical pairs in both males and females. They are numbered based on size, shape, and other properties. They contain genes that control the inheritance of all traits except sex-linked ones.

[13] Recombination is a process by which pieces of DNA are broken and recombined to produce new combinations of nucleotides or alleles. Recombination primarily happens between homologous chromosomes, which are paired chromosomes with similar genetic information, allowing for the exchange of corresponding DNA segments.

During meiosis, when homologous chromosomes pair up, a process called “crossing over” occurs where DNA strands break and rejoin, swapping genetic material between the chromosomes. This recombination process creates genetic diversity at the level of genes that reflects differences in the DNA sequences of different organisms. 

Recombination, Scitable by nature Education, Nature, 2014, https://www.nature.com/scitable/definition/recombination-226/

Genetic recombination, Wikipedia, This page was last edited on 5 October 2024, https://en.wikipedia.org/wiki/Genetic_recombination

Alberts B, Johnson A, Lewis J, et al., General Recombination, in The cell, New York: Garland Science; 2002. https://www.ncbi.nlm.nih.gov/books/NBK26898/

[14] Autosomal DNA Statistics, International Society of Genetic Genealogy Wiki, Page was last edited 4 August 2022, Page accessed 14 Aug 2022, https://isogg.org/wiki/Autosomal_DNA_statistics

Nicole Dyer, Charts for Understanding DNA Inheritance, 14 Aug 2019, Family Locket, Page accessed 10 Oct 2021, https://familylocket.com/charts-for-understanding-dna-inheritance/

[15] Meiosis is a type of cell division that reduces the number of chromosomes in the parent cell by half and produces four gamete cells. This process is required to produce egg and sperm cells for sexual reproduction.

Meiosis, 2014, Scitable by Nature Education, Nature, https://www.nature.com/scitable/definition/meiosis-88/

Gilchrist, Daniel, Meiosis, National Human Genome Research Institute, https://www.genome.gov/genetics-glossary/Meiosis

Meiosis, Wikipedia, This page was last edited on 22 August 2024, https://en.wikipedia.org/wiki/Meiosis

[16] What are reduced penetrance and variable expressivity?, MedlinePlus, https://medlineplus.gov/genetics/understanding/inheritance/penetranceexpressivity/

Miko, Iiona,  Phenotype variability: penetrance and expressivity. Nature Education 1(1):137 , 2008, https://www.nature.com/scitable/topicpage/phenotype-variability-penetrance-and-expressivity-573/

Expressivity (genetics), Wikipedia, This page was last edited on 9 October 2024, https://en.wikipedia.org/wiki/Expressivity_(genetics)

[17] Average Percent DNA Shared Between Relatives, 23andMe Customer Care, Tools, 23andMe, https://customercare.23andme.com/hc/en-us/articles/212170668-Average-Percent-DNA-Shared-Between-Relatives

Autosomal Statistics, International Society of Genetic Genealogy Wiki, This page was last edited on 17 October 2022, https://isogg.org/wiki/Autosomal_DNA_statistics

[18] The genome is the entire set of DNA instructions found in a cell. In humans, the genome consists of 23 pairs of chromosomes located in the cell’s nucleus, as well as a small chromosome in the cell’s mitochondria. A genome contains all the information needed for an individual to develop and function.

Human Genomic Variation, Fact Sheet, National Human Genome Research Institute, 1 Feb 2023, https://www.genome.gov/about-genomics/educational-resources/fact-sheets/human-genomic-variation

[19] Fundamental Concepts of Genetics and about the Human Genome, Eupedia, page accessed 3 Feb 2021, https://www.eupedia.com/genetics/human_genome_and_genetics.shtml

Sheldon Krimsky, Understanding DNA Ancestry, Cambridge: Cambridge University , 2022, Page 18

Human Genomic Variation, Fact Sheet, National Human Genome Research Institute, 1 Feb 2023, https://www.genome.gov/about-genomics/educational-resources/fact-sheets/human-genomic-variation

[20] Nucleotide, National Cancer Institute, https://www.cancer.gov/publications/dictionaries/genetics-dictionary/def/nucleotide

Nucleotide, Wikipedia, This page was last edited on 3 September 2024, https://en.wikipedia.org/wiki/Nucleotide

Brody, Lawrence, Nucleotide, National Human Genome Research Institute, 1 Nov 2024, https://www.genome.gov/genetics-glossary/Nucleotide 

[21] Non-Coding DNA, AncestryDNA Learning Hub, 16 Aug 2016, https://www.ancestry.com/c/dna-learning-hub/non-coding-dna

What is Noncoding DNA?, MedlinePlus, https://medlineplus.gov/genetics/understanding/basics/noncodingdna/

[22] Non-Coding DNA, AncestryDNA Learning Hub, https://www.ancestry.com/c/dna-learning-hub/junk-dna

Ohno, Susumu. “So Much ‘Junk’ DNA in Our Genome.” Brookhaven Symposium on Biology, Volume 23, 1972: 366-370.

Zhang F, Lupski JR. Non-coding genetic variants in human disease. Hum Mol Genet. 2015 Oct 15;24(R1):R102-10. doi: 10.1093/hmg/ddv259. Epub 2015 Jul 7. PMID: 26152199; PMCID: PMC4572001 https://pmc.ncbi.nlm.nih.gov/articles/PMC4572001/

Peña-Martínez EG, Rodríguez-Martínez JA. Decoding Non-coding Variants: Recent Approaches to Studying Their Role in Gene Regulation and Human Diseases. Front Biosci (Schol Ed). 2024 Mar 1;16(1):4. doi: 10.31083/j.fbs1601004. PMID: 38538340; PMCID: PMC11044903 https://pmc.ncbi.nlm.nih.gov/articles/PMC11044903/

Malte Spielmann, Stefan Mundlos, Looking beyond the genes: the role of non-coding variants in human disease, Human Molecular Genetics, Volume 25, Issue R2, 1 October 2016, Pages R157–R165, https://doi.org/10.1093/hmg/ddw205

Vitsios, D., Dhindsa, R.S., Middleton, L. et al. Prioritizing non-coding regions based on human genomic constraint and sequence context with deep learning. Nat Commun 12, 1504 (2021). https://doi.org/10.1038/s41467-021-21790-4

Ellingford, J.M., Ahn, J.W., Bagnall, R.D. et al. Recommendations for clinical interpretation of variants found in non-coding regions of the genome. Genome Med 14, 73 (2022). https://doi.org/10.1186/s13073-022-01073-3

[23]  The 1000 Genomes Project Consortium. A global reference for human genetic variation. Nature 526, 68–74 (2015). https://doi.org/10.1038/nature15393https://www.nature.com/articles/nature15393#citeas

Human Genomic Variation, National Human Genome Research Institute, https://www.genome.gov/about-genomics/educational-resources/fact-sheets/human-genomic-variation

For the 99.9 percent figure, see for example: Krimsky, Sheldon, Understanding DNA Ancestry, Cambridge, Cambridge University Press, 2022, Page 18

[22] Zou H, Wu LX, Tan L, Shang FF, Zhou HH. Significance of Single-Nucleotide Variants in Long Intergenic Non-protein Coding RNAs. Front Cell Dev Biol. 2020 May 25;8:347. doi: 10.3389/fcell.2020.00347. PMID: 32523949; PMCID: PMC7261909

The Order of Nucleotides in a Gene Is Revealed by DNA Sequencing, Scitable, Nature Education, https://www.nature.com/scitable/topicpage/the-order-of-nucleotides-in-a-gene-6525806/

single nucleotide variant, National Cancer Institute, https://www.cancer.gov/publications/dictionaries/genetics-dictionary/def/single-nucleotide-variant

Wright, A.F. (2005). Genetic Variation: Polymorphisms and Mutations. In eLS, (Ed.). https://doi.org/10.1038/npg.els.0005005

Single-nucleotide polymorphism, Wikipedia, This page was last edited on 29 September 2024, https://en.wikipedia.org/wiki/Single-nucleotide_polymorphism

SNVs vs. SNPs, CD Genomics, https://www.cd-genomics.com/resource-snvs-vs-snps.html

[23] Human Genomic Variation, Fact Sheet, National Human Genome Research Institute, 1 Feb 2023, https://www.genome.gov/about-genomics/educational-resources/fact-sheets/human-genomic-variation

[24] Ichikawa, K., Kawahara, R., Asano, T. et al. A landscape of complex tandem repeats within individual human genomes. Nat Commun 14, 5530 (2023). https://doi.org/10.1038/s41467-023-41262-1 

Tandem Repeat, Wikipedia, This page was last edited on 12 July 2024, https://en.wikipedia.org/wiki/Tandem_repeat

Myers, P., Tandem repeats and morphological variation. Nature Education 1(1):1, 2007,  http://scienceblogs.com/pharyngula/2007/10/tandem_repeats_and_morphologic.php

Usdin K. The biological effects of simple tandem repeats: lessons from the repeat expansion diseases. Genome Res. 2008 Jul;18(7):1011-9. doi: 10.1101/gr.070409.107. PMID: 18593815; PMCID: PMC3960014. https://pmc.ncbi.nlm.nih.gov/articles/PMC3960014/

Ichikawa, K., Kawahara, R., Asano, T. et al. A landscape of complex tandem repeats within individual human genomes. Nat Commun 14, 5530 (2023). https://doi.org/10.1038/s41467-023-41262-1 

Mitsuhashi, S., Frith, M.C., Mizuguchi, T. et al. Tandem-genotypes: robust detection of tandem repeat expansions from long DNA reads. Genome Biol 20, 58 (2019). https://doi.org/10.1186/s13059-019-1667-6 

Sequencing 101: Tandem repeats, 22 Nov 2023, PacBio, https://www.pacb.com/blog/sequencing-101-tandem-repeats/

Kai Zhou, Abram Aertsen, Chris W. Michiels, The role of variable DNA tandem repeats in bacterial adaptation, FEMS Microbiology Reviews, Volume 38, Issue 1, January 2014, Pages 119–141, https://doi.org/10.1111/1574-6976.12036

Fan H, Chu JY. A brief review of short tandem repeat mutation. Genomics Proteomics Bioinformatics. 2007 Feb;5(1):7-14. doi: 10.1016/S1672-0229(07)60009-6. PMID: 17572359; PMCID: PMC5054066. https://pmc.ncbi.nlm.nih.gov/articles/PMC5054066/

[25] Structural variation, Wikipedia, This page was last edited on 30 August 2024, https://en.wikipedia.org/wiki/Structural_variation

Scott AJ, Chiang C, Hall IM. Structural variants are a major source of gene expression differences in humans and often affect multiple nearby genes. Genome Res. 2021 Dec;31(12):2249-2257. doi: 10.1101/gr.275488.121. Epub 2021 Sep 20. PMID: 34544830; PMCID: PMC8647827 https://pmc.ncbi.nlm.nih.gov/articles/PMC8647827/

Feuk, L., Carson, A. & Scherer, S. Structural variation in the human genome. Nat Rev Genet 7, 85–97 (2006). https://doi.org/10.1038/nrg1767 

[26] CNVs are typically defined as DNA segments that are: larger than 1,000 base pairs (1 kilobase); usually less than 5 megabases in length; and  can include both duplications (additional copies) and deletions (losses) of genetic material. 

CNVs are remarkably common in human genomes. They account for approximately 5 to 9.5% of the human genome. They affect more base pairs than other forms of mutation when comparing two human genomes. They play crucial roles in evolution, population diversity, and disease development. 

Copy number variation, Wikipedia, This page was last edited on 24 September 2024, https://en.wikipedia.org/wiki/Copy_number_variation

Pös O, Radvanszky J, Buglyó G, Pös Z, Rusnakova D, Nagy B, Szemes T. DNA copy number variation: Main characteristics, evolutionary significance, and pathological aspects. Biomed J. 2021 Oct;44(5):548-559. doi: 10.1016/j.bj.2021.02.003. Epub 2021 Feb 13. PMID: 34649833; PMCID: PMC8640565 https://pmc.ncbi.nlm.nih.gov/articles/PMC8640565/

Eichler, E. E. Copy Number Variation and Human Disease. Nature Education 1(3):1, 2008,  https://www.nature.com/scitable/topicpage/copy-number-variation-and-human-disease-741737/

What are copy number variants?, 12 Aug 2020, Genomics Education Programme, https://www.genomicseducation.hee.nhs.uk/blog/what-are-copy-number-variants/

Clancy, S. Copy number variation. Nature Education 1(1):95, 2008, https://www.nature.com/scitable/topicpage/copy-number-variation-445/

Copy number variant, National Cancer Institute, https://www.cancer.gov/publications/dictionaries/genetics-dictionary/def/copy-number-variant

Copy Number Variation (CNV), 3 Nov 2024, National Human Genome Research Institute, https://www.genome.gov/genetics-glossary/Copy-Number-Variation

[29] Several approaches are used to determine if an SNV meets the one percent population frequency threshold:

  • Large-Scale Population Studies: Projects like the 1000 Genomes Project have sequenced thousands of individuals across multiple populations to identify and validate SNPs
  • A number of detection technologies are used such as real-time PCR, the use of microarrays, and Next-generation sequencing (NGS).

See for example:

The 1000 Genomes Project Consortium. A global reference for human genetic variation. Nature 526, 68–74 (2015). https://doi.org/10.1038/nature15393 

Patricia M Schnepp, Mengjie Chen, Evan T Keller, Xiang Zhou, SNV identification from single-cell RNA sequencing data, Human Molecular Genetics, Volume 28, Issue 21, 1 November 2019, Pages 3569–3583, https://doi.org/10.1093/hmg/ddz207

Telenti A, Pierce LC, Biggs WH, di Iulio J, Wong EH, Fabani MM, Kirkness EF, Moustafa A, Shah N, Xie C, Brewerton SC, Bulsara N, Garner C, Metzker G, Sandoval E, Perkins BA, Och FJ, Turpaz Y, Venter JC. Deep sequencing of 10,000 human genomes. Proc Natl Acad Sci U S A. 2016 Oct 18;113(42):11901-11906. doi: 10.1073/pnas.1613365113. Epub 2016 Oct 4. PMID: 27702888; PMCID: PMC5081584. https://pmc.ncbi.nlm.nih.gov/articles/PMC5081584/

SNVs vs. SNPs, CD Genomics, https://www.cd-genomics.com/resource-snvs-vs-snps.html

Efficiently detect single nucleotide polymorphisms and variants, Illumina, https://www.illumina.com/techniques/popular-applications/genotyping/snp-snv-genotyping.html

[30] What are single nucleotide polymorphisms (SNPs)?, MedlinePlus, https://medlineplus.gov/genetics/understanding/genomicresearch/snp/

SNP, IMS Riken Center for Integrative Medical Sciences, https://www.ims.riken.jp/english/glossary/genome.php

The 1000 Genomes Project Consortium. A global reference for human genetic variation.Nature 526, 68–74 (2015). https://doi.org/10.1038/nature15393

[31] Ancestry Information Markers, National Human Genome Research Institute, https://www.genome.gov/genetics-glossary/Ancestry-informative-Markers

Joon-Ho You, Janelle S. Taylor, Karen L. Edwards, Stephanie M. Fullerton, What are our AIMs? Interdisciplinary Perspectives on the Use of Ancestry Estimation in Disease Research, National Library of Medicine, 2012 Nov 5. doi: 10.1080/21507716.2012.717339

Huckins, L., Boraska, V., Franklin, C. et al. Using ancestry-informative markers to identify fine structure across 15 populations of European origin. Eur J Hum Genet 22, 1190–1200 (2014). https://doi.org/10.1038/ejhg.2014.1

[32] What are single nucleotide polymorphisms (SNPs)?, MedlinePlus, https://medlineplus.gov/genetics/understanding/genomicresearch/snp/

[33] AIMs are single-nucleotide polymorphisms (SNPs) that show substantially different frequencies between populations from different geographical regions15. These genetic variations can be used to estimate the geographical origins of a person’s ancestors, typically by continent of origin.

AIMs are found within the approximately 15 million SNP sites in human DNA (about 0.4% of total base pairs). They are often traced to the Y chromosome, Mitochondrial DNA, and Autosomal regions.

AIMs can distinguish between major continental populations (Africa, Asia, Europe). They require multiple markers working together (typically 20-30 or more) for accurate ancestry determination. They can identify fine population structure within continents using larger marker sets. 

The effectiveness of AIMs depends on the number of markers used:

  • 40-80 markers can identify five broad continental clusters;
  • 128 markers can characterize samples into 8 broad continental groups; and
  • Larger sets (>46,000 markers) can identify detailed subpopulation structure

Hinkley, Ellen, DNA Testing Choice, 16 Dec 2016, https://dnatestingchoice.com/en-us/news/what-is-an-autosomal-dna-test

Lamiaa Mekhfi, Bouchra El Khalfi, Rachid Saile, Hakima Yahia, and Abdelaziz Soukri, The interest of informative ancestry markers (AIM) and their fields of application, , BIO Web of Conferences 115, 07003 (2024),https://doi.org/10.1051/bioconf/202411507003 

Huckins, L., Boraska, V., Franklin, C. et al. Using ancestry-informative markers to identify fine structure across 15 populations of European origin. Eur J Hum Genet 22, 1190–1200 (2014). https://doi.org/10.1038/ejhg.2014.1 

Ancestry Information Markers, National Human Genome Research Institute, https://www.genome.gov/genetics-glossary/Ancestry-informative-Markers

Ancestry-informative marker, Wikipedia, This page was last edited on 14 August 2024, https://en.wikipedia.org/wiki/Ancestry-informative_marker

[34] Autosomal DNA Statistics, International Society of Genetic Genealogy Wiki, This page was last edited on 17 October 2022, https://isogg.org/wiki/Autosomal_DNA_statistics

Autosomal SNP comparison chart, International Society of Genetic Genealogy Wiki, This page was last edited on 29 January 2024, https://isogg.org/wiki/Autosomal_SNP_comparison_chart

DNA Structure and the Testing Process, FamilyTreeDNA Help Center, https://help.familytreedna.com/hc/en-us/articles/6189190247311-DNA-Structure-and-the-Testing-Process

Catherine A. Ball, Mathew J Barber, Jake Byrnes, Peter Carbonetto, Kenneth G. Chahine, Ross E. Curtis, Julie M. Granka, Eunjung Han, Eurie L. Hong, Amir R. Kermany, Natalie M. Myres, Keith Noto, Jianlong Qi, Kristin Rand, Yong Wang and Lindsay Willmore, AncestryDNA Matching White Paper, 31 Mar 2016, AncestryDNA, https://www.ancestry.com/cs/dna-help/matches/whitepaper; PDF: https://www.ancestry.com/dna/resource/whitePaper/AncestryDNA-Matching-White-Paper.pdf

Autosomal DNA match thresholds, International Society of Genetic Genealogy Wiki, This page was last edited on 31 August 2024, https://isogg.org/wiki/Autosomal_DNA_match_thresholds

Daniel Kling, Christopher Phillips, Debbie Kennett, Andreas Tillmar,

Investigative genetic genealogy: Current methods, knowledge and practice, Forensic Science International: Genetics, Volume 52, 2021, https://doi.org/10.1016/j.fsigen.2021.102474

Davis DJ, Challis JH. Automatic segment filtering procedure for processing non-stationary signals. J Biomech. 2020 Mar 5;101:109619. doi: 10.1016/j.jbiomech.2020.109619. Epub 2020 Jan 9. PMID: 31952818.

The Order of Nucleotides in a Gene Is Revealed by DNA Sequencing, Scitable, Nature Education, https://www.nature.com/scitable/topicpage/the-order-of-nucleotides-in-a-gene-6525806/

[35] The Illumina Global Screening Array (GSA) is a customizable genotyping microarray platform.  Its base configuration

  • Contains approximately 654,000 fixed markers spanning the human genome;
  • Supports 24 samples per array in standard format;
  • Requires 200 ng DNA input;
  • Achieves call rates greater than 99% and reproducibility greater than 99.9%; and
  • Allows addition of up to 100,000 custom markers

Illumina microarray solutions, Illumina, https://www.illumina.com/techniques/microarrays.html

Efficiently detect single nucleotide polymorphisms and variants, Illumina, https://www.illumina.com/techniques/popular-applications/genotyping/snp-snv-genotyping.html

Custom design tools for genotyping any variant, in any species, Illumina, https://www.illumina.com/techniques/popular-applications/genotyping/custom-genotyping.html

Infinium™ Global Screening Array-24 v3.0 BeadChip, Illumina , https://www.illumina.com/content/dam/illumina-marketing/documents/products/datasheets/infinium-global-screening-array-data-sheet-370-2016-016.pdf

Infinium Global Screening Array-24 Kit, Illumina, https://www.illumina.com/products/by-type/microarray-kits/infinium-global-screening.html

Efficiently detect single nucleotide polymorphisms and variants, Illumina, https://www.illumina.com/techniques/popular-applications/genotyping/snp-snv-genotyping.html

Custom design tools for genotyping any variant, in any species, Illumina, https://www.illumina.com/techniques/popular-applications/genotyping/custom-genotyping.html

[36] Estes, Roberta, Comparing DNA Results – Different Tests at the Same Testing Company, 5 Sep 2017, DNAeXplained – Genetic Genealogy, https://dna-explained.com/2023/05/18/comparing-dna-results-different-tests-at-the-same-testing-company/

[37]  Estes, Roberta, Concepts -Imputation, 5 Sep 2017, DNAeXplained – Genetic Genealogy, https://dna-explained.com/2017/09/05/concepts-imputation/

Illumina microarray solutions, Illumina, https://www.illumina.com/techniques/microarrays.html

Efficiently detect single nucleotide polymorphisms and variants, Illumina, https://www.illumina.com/techniques/popular-applications/genotyping/snp-snv-genotyping.html

[38] See for example: Our Autosomal DNA Test (Family Finder™), FamilyTreeDNA HelpCenter, https://help.familytreedna.com/hc/en-us/articles/4411203169679-Our-Autosomal-DNA-Test-Family-Finder

[39] Different DNA testing companies use centimorgans (cM) in slightly different ways when reporting matches and relationships:

  1. Matching thresholds: Companies set different minimum thresholds for reporting matches. For example: AncestryDNA currently uses a threshold of 8 cM; 23andMe uses 7 cM and at least 700 SNPs for the first matching segment; and MyHeritage uses 8 cM.
  2. Algorithms and filtering: Companies use proprietary algorithms to filter and process the raw DNA data. AncestryDNA uses algorithms called Timber and Underdog to phase data and filter out high-frequency segments. Other companies may use different methods, leading to variations in reported shared cM.
  3. Total cM calculations: The total amount of cM a person has can vary between companies. 23andMe reports about 7,440 cM total and AncestryDNA seems to use around 6,800-7,000 cM total.
  4. Reporting of segments: Some companies like 23andMe and FamilyTreeDNA provide detailed segment data. AncestryDNA does not show specific segment information.
  5. Confidence levels: Companies may assign different confidence levels or relationship probabilities based on shared cM. For example, AncestryDNA previously used confidence scores like “Extremely High” for cMs greater than 60.
  6. Handling of small segments: Companies differ in how they handle very small matching segments, with some including segments as small as one cM and others excluding anything below their threshold.

These differences in methodologies can result in variations in reported shared cM and relationship estimates between companies for the same pair of individuals. This is why matches and relationship predictions may not be identical across different testing companies.

Centimorgan, Wikipedia, This page was last edited on 1 May 2024, https://en.wikipedia.org/wiki/Centimorgan

What’s the difference between shared centimorgans and shared segments?, 11 Nov 2019, The Tech Initiative, https://www.thetech.org/ask-a-geneticist/articles/2019/centimorgans-vs-shared-segments/

centiMorgan, Internatioal Society of Genetic Genealogy, This page was last edited on 15 August 2024, https://isogg.org/wiki/CentiMorgan

[40] Hansen, Annelie, Untangling the Centimorgans on Your DNA Test, FamilySearch Blog, https://www.familysearch.org/en/blog/centimorgan-chart-understanding-dna

Green Dragon Genealogy, Yes, but what EXACTLY is a centiMorgan?, 19 Sep 2021, Green Dragon Genealogy,https://greendragongenealogy.co.uk/dna/yes-but-what-exactly-is-a-centimorgan/

[41] Autosomal DNA match thresholds, International Society of Genetic Genealogy Wiki, This page was last edited on 31 August 2024, https://isogg.org/wiki/Autosomal_DNA_match_thresholds

[42] Autosomal DNA Statistics, International Society of Genetic Genealogy Wiki, This page was last edited on 17 October 2022, https://isogg.org/wiki/Autosomal_DNA_statistics

Autosomal DNA match thresholds, International Society of Genetic Genealogy Wiki, This page was last edited on 31 August 2024, https://isogg.org/wiki/Autosomal_DNA_match_thresholds

Estes, Roberta , Comparing DNA Results – Different Tests at the Same Testing Company, DNAeXplained – Genetic Genealogy Blog, 18 May 2023, https://dna-explained.com/2023/05/18/comparing-dna-results-different-tests-at-the-same-testing-company/

Autosomal DNA testing comparison chart, International Society of Genetic Genealogy Wiki, This page was last edited on 8 October 2024, https://isogg.org/wiki/Autosomal_DNA_testing_comparison_chart

[43] Phasing, International Society of Genetic Genealogy Wiki, This page was last edited on 24 May 2024, https://isogg.org/wiki/Phasing

A Guide to Phasing from Illumina: https://youtu.be/15NPZCGP_e4

Autosomal DNA match thresholds, International Society of Genetic Genealogy Wiki, This page was last edited on 31 August 2024, https://isogg.org/wiki/Autosomal_DNA_match_thresholds

Davis DJ, Challis JH. Automatic segment filtering procedure for processing non-stationary signals. J Biomech. 2020 Mar 5;101:109619. doi: 10.1016/j.jbiomech.2020.109619. Epub 2020 Jan 9. PMID: 31952818.

Is the Huntington NY Griff(is)(es)(ith) Family Name Welsh?

Based on a number of sources of supporting evidence, it is strongly believed that the Griff(is)(es)(ith)) surname of the family is a Welsh surname. Based on oral family stories it is beleived that the family came from Wales. [1] The documented variability of the surname spellings of the twelve children and descendants of William Griffis in America (e.g. Griffith, Griffis, Griffes) is also reflective of the historic characteristics associated with the evolution of Welsh surnames. [2]

In addition, aside from the Dutch and French, the Welsh together with the Scotts and English were some of the earliest colonists to arrive in America in the 1600’s and 1700’s. [3] Many of the Welsh that came to the colonies were either residing in England or from southern Wales. The southern region of Wales is located just across the Bristol Channel from what was then England’s second largest port city, Bristol. The port of Bristol supplied thousands of emigrants to England during the 17th and 18th centuries. 

“Estimates suggest that at least 6,000 Welsh-born persons had settled in London in the early seventeenth century, amounting to some seven per cent of the capital’s resident population.” [4]

To a large degree, the Welsh that initially immigrated with the English to the colonies in the 1600’s came from the English ports of Bristol and London. [5] The influx of the first major wave of Welsh immigrants to America began in the mid to late 1600s. While there were movements of individuals, the majority transferred in denominational groups and settled together in small communities. Between the Restoration (1660) and the turn of the century, it is estimated that about 3,000 individuals of Welsh descent came to the colonies. [6] It is not known how many arrived prior to 1660.

“Some few people from Wales did emigrate during the Laudian persecution of the 1630s to gain religious and political freedom and were active in New England in the 1650s in evangelical reform. … At the same time, Wales was experiencing extreme economic problems. To a much greater extent than England, Wales consisted of a multitude of small tenant farmers whose plight was worsening with the concentration of land and power in the grasp of a prospering minority. … It is against this background that the first sizable emigrations from Wales occur, though quality rather than quantity is the keystone. ” [7]

While not certain, through my journey of hunches, dead-ends and successful finds, there is a plausible argument that William’s ancestors came from southern Wales. It is believed that one of more of the Griffith clan traveled from Bristol to Boston or another northern port. Another possibility is that William’s ancestors were Irish or English and had the Griffith, Griffiths, or Griffis surname and emigrated from one of these ports to the colonies.

However, there is no direct proof that the patrilneal family line was Welsh, English or Irish.

Similar to the Duck Test [8] of abductive reasoning:

  • Family folklore has stated that the surname was of Welsh origin;
  • the timing of when the family immigrated to the Colonies (mid to late 1600’s) suggest they were of English or Welsh origin;
  • the modifications of use of the Griffith(is)(es) surname in the Colonies has the historical characteristics of the Welsh in the late transition from a patronymic to surname naming custom ;
  • the derivation of the Griffith name is mainly of Welsh origin, therefore I believe that
  • the Griffith surname is a Welsh surname.

Well, I do tend to lean toward believing my second cousin four times removed, William Case Griffis regarding his recollections of his great grandfather William Griffis. [9]

Portrait of William Case Griffis | Click for Larger View.

Nevertheless, I thought I would delve a bit more into possible Y-DNA leads and review census data and Y-DNA associated with surnames from the present and past in Great Britain and Ireland to possibly add more ‘ballast’ to the argument that the family surname reflects a paternal line that was Welsh.

The Griff(ith)(iths) Surname

The surname of the Griff(is)(es)(ith) is actually a variant of the name Griffith and Griffiths, and its Welsh form of Gruffudd or Gruffydd. It is a traditional name of Welsh origin that was originally used as a personal name and eventually used as a surname, with or without the ‘s‘ as in Griffiths[10] The name has many variations as a result of the natural evolution of the name in Welsh, as well as the translation of the name from Welsh into both Latin and English. Common variants include Griffin, Griffith, Griffiths, Griffing, Griffes, Griffis and other variations. The anglicized and Welsh forms are treated as different spellings of the same name in Wales.

Although there is documentation that Griffith families came from north Wales, there were in fact documented more Griffiths throughout Wales and across the border in England. [11]

The name Griffith in Ireland originally appeared in Gaelic as Ó Gríobhtha, which is derived from the word “gríobhtha,” which means “griffin-like.” While most of the instances of this name in Ireland can be traced to this native Irish source, the name also came to Ireland in the 12th century with the Anglo-Norman invasion of Strongbow. In this instance, the Griffith surname is derived from the Welsh personal names Griffin, Gruffin, or Griffith, pet-forms of the Middle Welshname Gruffudd. [12]

In studies of Welsh forenames in use in Wales in the fifteenth century, it has been noted that Welsh forenames were fading while ‘new’ Anglo-Norman names were growing. However, among the ‘traditional’ Welsh forenames that continued to be used, Gruffudd represented 6 percent throughout Wales. The modern derivative, Griffths, continued to be used throughout Wales. For comparison, the figures for surnames in Wales between 1813-1837 indicate that Griffiths represented 2.8 percent of the Welsh population.  [13]

Griffi(th)(iths) Surname Distribution in British & Irish Census

The Griff(is)(es)(ith) family immigrated to the colonies in the mid to late 1600’s. I have not been able to find historical documentation on the prevalence and distribution of the Griffith surname in Wales in the 1600’s or 1700’s.

Perhaps reviewing the surname distribution patterns in the late 1800’s might provide a plausible glimpse of the historic distribution patterns that were similar to the 1600’s. This of course tenuously assumes that most folks in the British Isles did not have high migration patterns within and between Wales, Ireland and England during the 1600’s through 1800’s. This is not necessarily the case. [14] The economic effects of industrialization in the mid to late 1800’s had an effect on migration patterns on the British Isles. However, assuming most families within three to four generations (1600-1800) stuck within a certain geographic radius, we might see similarities in surname distributions within Wales and on the border of England and assume this reflects, to a degree, surname distributions in the mid-1600’s.

The ten most common surnames in Wales in 1856 were Jones (13.84%), Williams (8.91%), Davies (7.09%), Thomas (5.70%), Evans (5.46%), Roberts (3.69%), Hughes (2.98%), Lewis (2.97%), Morgan (2.63%) and Griffiths (2.58%)[15] 

Of these ten common Welsh surnames, only five were found throughout Wales and did not display any marked concentration in any one area: Thomas, Lewis, Griffiths, Edwards and Morris. Other common surnames included Owen, Pritchard and Parry. The popular given names from which these surnames derived, such as Jones from John, and Davies from David, clearly depict the patronymic practice. While these figures reflect all of Wales, there have been studies which document that different areas of Wales have different levels and mixtures of surnames.  [16] 

For example:

“(T)he ten most common names in the Uwchgwyrfai area of Caernarfonshire covered more than 90% of the population. those names (in the early part of the nineteenth century) were: Jones (22.8%), Williams (18.40%), Roberts (13.28%), Hughes (7.78%), Griffiths (7.39%), Thomas (5.37%), Owen (4.86%), Evans (4.17%), Pritchard (3.65%) and Parry (2.92%).” [17]

Given the documented broad range of presence of Griffith and Griffiths throughout Wales and neighboring counties England, I did not anticipate getting any strong clues as to the location of where the ancestors of William Griffis resided. However, I thought I might find certain counties as having an higher probability of where the ancestors of the Griff(is)(es)(ith) family were from.

Keeping an Open Mind on Welsh Surnames: Don’t Fixate on One Name

Given the history of the emergence and use of surnames among the Welsh, pedantically looking for the literal spelling of one’s present day surname in historical records or Y-DNA test kit results is unwise. It is wise to pay attention to surnames that are geographically similar to where Griffith(s) households are found especially in terms of genetic matches. Families may have used different surnames in Wales as the practice of using surnames became more widespread in specific geographical areas.

In a study of Welsh wills, John and Sheila Rowlands documented ‘patterns of decay’ in the use of the patronymic naming system in Wales. [18] They completed a study aimed at providing a means of determining areas in Wales when the use of the patronymic naming system reduced to about 10 percent of the names in a given area.

Illustration One: Patronymic Decay and the Rise of Surnames in Wales

Source: John and Sheila Rowlands, The Use of Surnames, Chapter 4, Patronymic Naming – A Survey in Transition, Llandysul, Ceredigion: Gomer Press, 2013, Figure 4-3: Decay in the use of patronymic naming to the 10% level, Page 56 | Click for Larger View

The map above (Illustration One), which is from their study, reveals the wide variation when surnames were adopted in various parts of Wales. Surnames became the norm by 1750 across the coastal plain of south Wales and along the eastern border with England.

It was not until the mid-nineteenth century that the Patronymic system was fully replaced in Wales. When the Welsh immigrated to America in the seventeenth and eighteenth centuries, the patronymic pattern on both sides of the Atlantic eventually stopped, and their surnames became hereditary. However, it is not uncommon to find variations of surname spellings within and between family generations in documents associated with our family members in the 1600’s and 1700’s in the colonies. The use of surnames was, compared to the curing of concrete, “wet cement” in the 1600’s and 1700’s.

The Widespread Presence of Griffith(s) surnames in Wales

A review of data from the 1881 census of Great Britain and Griffith’s Valuation in Ireland 1853-1865, indicate that the surname of Griffith and Griffiths is found in a large number of countries throughout Great Britain and Ireland. Eighty percent of the prevalence of the Griffith(s) surnames are found within 77 mile radius of Caernarfon, Wales [19]. The Griffiths surname is more prevalent by county than Griffith.

Illustration Two: Prevalence of Griffiths and Griffis Surnames in Welsh and English Counties

Looking at this data on a map in Illustration Three, one can see that households with the Griffiths and Griffith surnames are located throughout Wales. The circle with a dotted boundary indicates the 77 mile radius of the 80 percent prevalence of the two surnames in the British and Irish census data combined. Where the two surnames are relatively larger in specific counties, a small pie chart appears and portions of the pie reflecting areas proportionate to prevalence of the two surnames. Counties that have a lessor presence of the surnames are reflected with small dots. The Griffith and Griffiths surnames were present in small varying degrees in many of the counties of Great Britain and Ireland. [21]

Illustration Three: Census Prevalence of Griffith & Griffiths Surnames in England and Ireland, Mid to late 1800s

Source: Rob Spencer, Britain and Ireland SNP and Surname Mapper | Click for Larger View

If we look at the 1881 census data for only the Welsh counties as depicted in Table One, four of the twelve counties represent 63 percent of Welsh households that have the name Griffith or Griffith. Glamorgan has the largest proportionate presence of the Griffith(s) surnames (27%). Penbroke, Caernafon and Carmarthen are the second, third and fourth largest in representation of Griffith(s) households (15.7%, 10.4% and 10.0% respectively). While these four counties contain the largest concentration of Griffith and Griffiths households, the Griffith(s) surnames are represented in all of the Welsh counties. These two surnames are in the top ten of most popular surnames in seven of the twelve counties.

Table One: Distribution of Griffith and Griffiths Head of Households by Welsh County 1881

CountySur-
name
Griff-
ith/iths
Sur-
name
Rank
of top
300 sur-
Names /
County
Number
of House-
holds in
county
Percentage of
Griffith(s)
Households
Across Counties
Angleseyith14th7222.4 %
iths00
Brecknockith175th243.2%
iths12th937
Caernarfonith10th295415.7%
iths12th1697
Cardiganith70th254.6%
iths13th1330
Carmarthenith73rd7810.0%
iths8th2842
Denbighith30th2756.8%
iths10th1726
Flinshireith64th1065.8%
iths9th1626
Glamorganith66th64027.0%
iths10th7362
Merionethith19th6182.7%
iths12th787
Monmouthith005.4%
iths19th1605
Montgomeryith84th764.0%
iths14th1095
Penbrokeith84th11010.4%
iths6th2974
Data from Rob Spencer, Britain and Ireland SNP and Surname Mapper, http://scaledinnovation.com/gg/biMapper.html

So what does this mean? In essence, the ancestors of William Griffis could conceivably be from anywhere in Great Britain given the prevalence of the Griffith(s) surnames! However, there is a good chance that his ancestors were from Wales and from southern Wales. As reflected in Illustration Four, four counties in Wales represent more than a majority of households with the name of Griffiths or Griffith. Perhaps William’s ancestors were from Glamorgan, Penbroke, Caernafon or Carmarthen counties in Wales.

Illustration Four: 1800 Map of Highlighted Welsh Counties that had the highest concentrations of Griffith(s) households in 1881

Distinctive Surname Patterns and ‘Surname Insularity’ in Wales

A review of surname distributions in Welsh counties reveals similar patterns of surnames among the Welsh counties. This is also the case when viewing the border counties between Wales and England.

Counties whose residents share the same surname distribution mixes can be considered similar. This can be represented in a quantitative manner. The example in the Illustration Five below shows four counties A-D. Counties A and C have 2 of their 3 names in common and could be called 67% similar. A and B are 33% similar and all other pairs are 0% similar. From this a dendrogram can be constructed which visually expresses these counties’ mutual surname similarity. [22]

Illustration Five: Geographic Surname Similarity Portrayed in a Dendrogram

Source: Rob Spencer, County Clustering by Surnames, Tracking Back: a website for genetic genealogy tools, experimentation, and discussion | Click for Larger View

Clustering the 117 counties of Britain and Ireland by surnames indicates a clear pattern where the similarity of surnames generally follows historic political boundaries. Each region of Great Britain and Ireland (Wales, Scotland, England, Ireland, and Northern Ireland) is generally characterized with its own unique cluster of surnames. One noteworthy observation is the British counties of Herefordshire and Shropshire are deeply clustered with Wales. [23]

Illustration Six: Similarity of Counties Based on the Top 500 Surnames Found in Each County in 1881 (Top 5 Surnames are listed next to Each County)

Source: Rob Spencer, County Clustering by Surnames, Tracking Back: a website for genetic genealogy tools, experimentation, and discussion | Click for Larger View

The dendrogram above basically illustrates the similarity of Welsh counties based on their unique distributions of the 500 surnames found in the respective counties. For example, Carmarthen and Glamorgan counties are more similar in their top 500 surname disributions than compared wih the other counties. Also, as an example, Shropshire’s names are more similar to Wales than England. Regional identities remain largely the same whether one examines just the very common or just the very uncommon surnames. 

Surnames can be viewed as a measure of the historic influence of patronymic influence, language. lineage, and culture, and they may be shaped by political boundaries or those boundaries may be superimposed on preexisting surname patterns. The crossing of a surname pattern over a political boundary may indicate past boundaries and/or may be related to cultural or sectarian differences.

In order to compare surnames to political or historic regions Rob Spencer looked at surname differences along six tlines that crossed regional borders (see the map in Illustration Six below). Similarity between the counties at the start and end of each arrow are calculated and shown in the six charts below. On the map, the dot on each arrow shows the point where the surname pattern is halfway in terms of similarity between the counties at the ends. The red arrow on the map follows a general pattern where the smaller region (Wales) is ‘tighter’ (homogeneous in terms of Welsh surname patterns) while the larger region (English counties) bleeds into the smaller’s surname pattern (e.g. Shropshire vs Wales). This pattern is depicted in Chart Four. [24]

Illustration Seven: Six Transects through Counties in Great Britain and Ireland

Rober Spencer, County Clustering by Surname | Click for Larger View.

Spencer found in most cases there is an identifiable 50-50 mix in surname patterns along these six lines. If you look at the transect line between Wales and England (highlighted Chart Four below), the 50-50 mix is around Shropshire county in England. In most cases there is a flattening out at one or both ends of the transect into a stable pattern. Pembroke, Cardigan, and Montgomery Welsh counties are all self-similar and iconically Welsh without English admixture, then as the line goes eastward into England, the surname mix is predominantly English.

Charts One Through Six: Similarity of Surnames in 1881 in Border Counties in Great Britain and Ireland

Source: Rob Spencer, County Clustering by Surnames, | Click for Larger View

Surname Variants of Griffiths & Geographical Similarities with other Surnames

Given the history of Welsh patronymics and the historic use of surnames, not only should variants of the spelling of a surname be considered when reviewing various census repositories of information, different surnames should also be considered in specific geographical areas. It is not inconceivable that individuals who were related at specific historical times may have decided to use different surnames when these of surnames became popular.

Illustration Eight indicates variants of the Griffith surname in the 1881 British census. In addition, there are a number of Welsh surnames that are geographically similar to where Griffith(s) surnames were found in 1881. As is evident, the common Welsh surname of Roberts, Owens, Williams, Hughes, Pritchard and Jones are found 80 percent of the time in counties where the Griffith(s) households resides. This is not surprising given the that these surnames were found in most of the Welsh counties.

Illustration Eight: Surname Variant of Griffith and Geographic Similarity of Other Surnames with Griffith

Rober Spencer, County Clustering by Surname | Click for Larger View.

Adding the surname variants of Griffithes, Griffits and Grifiths to the analysis underscores the concentration of households with similar surnames found in Wales and the adjoining counties of Herefordshire and Shopshire in England.

Illustration Nine: Census Prevalence of Variants of Griffiths Surnames in England and Ireland, Mid to late 1800s

Source: Rob Spencer, Britain and Ireland SNP and Surname Mapper| Click for Larger View

Thus far we have observed that the Griffith(s) surname is prevalent in many of the counties in England, Wales and Ireland. There is, however, a relatively higher concentration of Griffith(s) households in all the counties in Wales compared with English and Irish counties. At the latter part of the 1800’s we know that four counties in Wales represented over 60 percent of Griffith(s) households in Wales. Three of the four counties are on the southern border on the Bristol Channel.

Y-DNA & Geographic Location: Crossing the Channel

The comparison of surnames and Y-DNA can show both expected parallels and some surprising differences especially in the “lineage” period of ancestry (see Illustration Ten). This is an era or time period where groups of people have settled in local geographical areas prior to the use of surnames or written history.

Illustration Ten: Three Periods of Ancestry

Source:: | Click for Larger View.

Correlating data associated with the Y-DNA line of descent with the geographic location of the Y-DNA SNPs may provide a plausible but rough depiction of when and where the Griff(is)(es)(ith) family Y-DNA genetic line migrated to the British Isle and specifically to areas that are now modern day Wales. The relative mutation rate for an SNP is extremely low. This makes them ideal for documenting or marking and tracing the history of genetic mutations in the human genetic tree (haplotree) over long periods of time. Many generations can pass without a SNP occurring. This means that SNPs that occur in a specific lineage are unique and seldom change back. They occur thousands or tens of thousands of years ago. 

The analysis of Y-STR data may also shed light on different surnames that are associated with common ancestors within the last 50 generations. As stated in earlier stories about STRs and SNPs, using both SNPs and STRs potentially provide more specificity in tracing the patrilineal line from deep ancestry, through the middle era of lineages and into the more recent historical era of surnames and traditional genealogy. STR markers will generally mutate more frequently than SNPs.  SNP testing is getting better all the time and the advanced tests can now find SNPs every two or three generations, but STRs still mutate faster than that so sometimes you will have branches of the haplotree where no SNP mutations have been identified over a time period and you can not easily determine branching if you do not have the SNP branching points to navigate. STRs can show you where mutations have occurred which are more frequent than SNPs and they can mark branches that are not otherwise identified by SNPs.  So you can get a little more granularity out of STR testing. 

As indicated in other stories on this blog, the Griff(is)(es)(ith) patrilineal line is part of the Y-DNA G-haplogroup. Using an interactive on-line program called “STR Tracker”, an illustrated map chronicles the possible historical migratory path of the family surname haplogroup lineage. [25] This can be used as a basis for evaluating when the Y-DNA genetic line of my patrilineal line possibly migrated to the British Isle.

STR Tracker shows a walking man icon traversing the migratory path of either your paternal or maternal ancestors. Selected major events and cultures appear as the walking man traverses the continent. The app allows you to select various parameters to add information to the migratory path. [26]

Entering my ‘terminal STR’, BY211678, in the app will produce a suggested migratory path to the terminal SNP based on the major SNPs associated with the haplogroup mutations [27].  The terminal SNP is genetically akin to a leaf on small twig (a recent haplogroup branch) on an ancestral tree composed of branches, limbs, twigs and leaves. that was confirmed by my Y-DNA test.

I have recorded a video of the animated path that illustrates the paternal migration time line for the Griff(is)(es)(ith) family Y-DNA. While the accuracy or reliability of the statistical results of such an illustration are fraught with possible sources of error, Spencer, the creator of the app, does an amazing job at bringing historical and DNA data to life.  [28]

The historical path generated from this program is probably not the actual path of the ancestors of the Griff(is)(es)(ith) patrilineal line but it captures the time period and general location of each successive genetic SNP mutation that occurred along the paternal lineage.  

For a larger rendition of the video click here (recommended) and then click on the video arrow for the animation to start the migration process. 

Video: Historical Path of the Griff(is)(es)(ith) Paternal Line

The population of Western Europe has been shaped by various migratory paths of major haplogroups from the east through time. As indicated in Part Three of my DNA story, three major movements of people, shaped the course of European prehistory. While each of these 3 waves of migration were composed of a mix of genetic haplotypes, each were represented by one or two major genetic haplogroups.

The second wave is associated with the migration of Neolithic farmers from the Anatola region. The G-Haplogroup, which the Griff(is)(es)(ith) patrilineal line is a genetic member, was a predominate haplogroup associated with this second wave. They brought not only their DNA but sheep, cattle and wheat to Europe. Within a thousand years the “Neolithic revolution” spread north through Anatolia and into southeastern Europe. By about 6,000 years ago, there were farmers and herders all across Europe.

The third wave, which is predominantly represented by the Yamnaya and are part of the R-Haplogroup, emanated from the Steppes. Illustration eleven depicts three paths of my haplogroup and two R haplogroups. As indicated in the map, the migratory paths of the two R haplogroups moved relatively quickly aacorss continental Europe and into the British Isles. My specific genetic Y-DNA line , part of the G-haplogroup, arrived in the north-central area of continental Europe and stayed there for a longer period of time.

Illustration Eleven: Migratory Paths of G and R Haplogroup Branches

Source: Rob Spencer, SNP Tracker | Click for Larger View

The different timing between the migratory paths of the “second wave” G haplogroup and the “third wave” R haplogroups can be viewed in illustration twelve. It appears the the migratory path of the Griff(is)(es)(ith) genetic line crossed the English channel around the Medieval Era. Prior to this time, they coexisted with a mix of other major haplogroup lines (I, J, R, etc).

Illustration Twelve: Migration Paths of G and R Haplogroups into England by Time and Place

Source: Rob Spencer, SNP Tracker | Click for Larger View

Illustration Thirteen below shows longitude versus time to help visualize the migratory path associated with the Griff(is)(es)(ith) patrilineal line. The colors and thick solid/dashed lines are the same as the map above, and the thin horizontal dotted lines show south-to-north lines at notable longitudes. I have highlighted an area on the chart that suggested a possible time period where an ancestor crossed from the European continent to the British Island.

Illustration Thirteen : Westward Migration of Ancestors of Haplogroup G-BY211678

Source: Rob Spencer, SNP Tracker for G-BY611678 | Click for Larger View.

The following Illustration (Illustration Fourteen) depicts the SNP Y-DNA mutation lines of descent from the G-L497 branch of the G-haplogroup to my terminal SNP branch. The illustration indicates the approximate dates of the man who is the Most Recent Common Ancestor (tMRCA) associated with each of these specific SNP branches. By viewing the approximate dates of each of the MRCAs for each of the branches, we can vaguely estimate when a Y-DNA ancestor possibly crossed from the European continent to the British Isles.

Illustration Fourteen: Estimating When tMRCA Crossed the English Channel

Source: Estimates for MRCA birth and confidence ranges are from Rob Spencer, SNP Tracker |. Click for Larger View.

It should be noted that the statistical confidence levels for the birth dates for each of these MRCA’s are pretty wide! The dates are estimates based on genetic information only. Based on a 95% confidence level, the possible range of birth dates are provided in bold. For example, with a 95% probability, the MRCA of all members of the haplogroup G-Z40857 was born between the years 761 and 1198 CE. The most likely estimate is 1000 CE, rounded to the nearest 100. The chart below indicates a confidence level range of 770 – 1210 CE for the ancestor of G-Z40857. The confidence ranges in the chart are a bit different from FTDNA estimates and are provided through the SNP Tracker application. [29]

It is likely that the most recent common ancestor who crossed the English Channel was the ancestor born at the earliest 700 CE (G-Z6748), or 750 CE (G-Y38335) or the latest around 1000 CE (G-Z40857). Given the statistical ranges associated with each of these three individuals, the ancestor could have crossed between 450 CE and 1200 CE.

The following illustration is a still photograph from the SNP Tracker video that focuses on the approximate location of various SNP mutations that suggest an approximate time when the Griff(is)(es)(ith) lineage crossed the English Channel to the British Isle.

Illustration Fifteen: Estimated Migration Path of the BY211678 Haplogroup

Source: Rob Spencer, SNP Tracker, Click for Larger View

It would appear that the Y-DNA haplogroups of the Griff(is)(es)(ith) line lived in Northern Europe, what is now Germany, for thousands of years, roughly 4000 BCE to 700 CE. During this time, males who were part of this Y-DNA line migrated westward and northward toward the northern European coast. Based on FTDNA test kits who can trace their Y-DNA to the G-Z6748 haplogroup, there is one Y-DNA tester, who reportedly can trace his paternal ancestor back to a Tÿgge Jörgensen who was born in 1678 and died in 1730 and lived in Øbjerg, Denmark. [30]

It appears that the MRCA of the G-Z6748 haplogroup was likely born on the European continent. Some of his descendants migrated to the British Isles. The most likely common genetic ancestor who crossed the English Channel is the MRCA of G-Y38335, born around 750 CE but could have been born around the end o the Roman Empire or as late as before the Norman Invasion.

As Spencer indicates:

Many of the haplogroups [that are claimed to] have originated in the British Isles are simply there because they show up as a handful of cases in Britain or Ireland and we have no evidence of their existence elsewhere due to this [Y-DNA testing] bias. Unless a haplogroup has a very unique geographical distribution or is wholly found in continental Europe (a lot of haplogroups do fit these criteria), it takes several hundred testers to accurately place its origin at the level of individual countries. [31]

The logic behind linking Y-DNA SNP branching and the geographical location with FTDNA test results is intuitive but as Spencer suggests, it has a number of limitations and caveats. One notable caveat is the number of FTDNA testers in each of the descending G-haplogroup branches rapidly declines (see Table Two). SNPs with Irish and Scottish origins are generally better represented in the FTDNA database than those with English and Welsh origins. The G-haplogroup, compared to the R-haplogroup, is a present day minority haplogroup and have few Y-DNA testers.

Table Two: Griff(is)(es)(ith) Y-DNA Lineage on the Family Tree DNA (FTDNA) Haplotree and Number of Testers in Each Branch


FTDNA 
Y Branch
Subclade 
MRCA
Age
Estimate
Number of 
Tested Big Y DNA
Descendants
in FTDNA 
Database
01-14-22
G-L4975300 BCE1,762
G-CTS97374400 BCE1,647
G-Z18173000 BCE1,590
G-Z7272450 BCE1,479
G-FGC4772100 BCE117
G-Z6748700 CE52
G-Y38335750 CE46
G-Z408571000 CE44
G-Y1325051250 CE10
G-BY2116781500 CE8
Source: Family Tree DNA, Data March 2022

As reflected in Table Two, there are only 52 FTDNA Y-DNA test results for men affiliated with the G-Z6748 Haplogroup. This and the subsequent haplogroups descending from this branch are genetic ancestors that lived on the British island.

Y-DNA & Welsh Origin

There are a few STR markers that suggest the Griff(is)es)(ith) genetic line is Welsh. Haplogroup G-P303 (G2a2b2a) is a branch of haplogroup G (M201) that is a few branches pror to the G-L497 branch (see the chart in footnote 27). This older haplogroup represents the majority of haplogroup G men in most areas of Europe west of Russia and the Black Sea. There are also some short tandem repeat (STR) findings among G-P303 men which help in subgrouping them.

The percentage of haplogroup G among available samples from Wales is overwhelmingly G-P303. Such a high percentage is not found in nearby England, Scotland or Ireland. The STR Marker DYS594=12 subgroup has an unusually high percentage of Welsh surnames with the rest mostly of English ancestry based on available samples. (Red highlighted in Table Three).

Many of the men have an unusual value of 13 for Y-STR marker DYS388 ( I also have a 13 value for this marker which is yellow highlighted in Table Three), and some also have 9 at DYS568 (my value is 11). STR marker oddities are often different in each G-P303 subgroup, and characteristic marker values can vary by subgroup. Often the values of STR markers DYS391, DYS392 and DYS393, are respectively 10, 11 and 14 or some slight variation on these for all G-P303 men (all of these values of these markers I also have which are highlighted in blue in Table Three). [32]

In addition the DYS594 STR marker + 12 is a subgroup that has an unusually high percentage of Welsh surnames and to a lesser number of English ancestry. My value for this marker is 11.

Table 3 : FTDNA Y-111 STR Test Results for James Griffis – Markers 1 – 60

Source: FTDNA Y-DNA Results for Y-111 STR Test | Click for Larger View.

Spencer’s Britain and Ireland SNP and Surname Mapper tool provides hints about where and when paternal ancestors lived but is not definitive. Based on a ‘quality control analysis’ of his SNP and Surname Tool, he found that the average error in SNP location is about 160 kilometers.  While a surname may have been prevalent in a specific county, an ancestor could have lived somewhere else. Names such as Jones, Williams and Smith have a very high prevalence in Wales.  This natural bias may suggest the location of Welsh ancestry where there is none. [33]

The following illustration indicates the locations of FTDNA testers that are part of the G-Z4087 haplogroup, which is one of the earlier Y-DNA ancestor branches of the Griff(is)(es)(ith) line. As reflected in the map most of the testers, on the basis of surnames, can be linked to Wales.

Illustration Sixteen: Location Ancestors for Y-DNA FTDNA Testers Who are Descendants G-Z40857

Source: Generated using the Britain and Ireland SNP and Surname Mapper by Rob Spencer | Click for Larger View.

Similar to the results for the G-Z40857 branch, a more recent branch, associated with the Williams surname, is clearly identified with Welsh counties. G-Y132505’s paternal line was formed when it branched off from the ancestor G-Z40857 around 1000 CE. The man who is the most recent common ancestor of this line is estimated to have been born around 1200 CE. [34]

Illustration Seventeen: Location of Reported Ancestors for Y-DNA FTDNA Testers Who are Descendants of the MRCA Y132505

Source: Rob Spencer Britain and Ireland Surname Mapper | Click for Larger View.

Family Tree DNA (FTDNA) Y-DNA datasets include the surname of the modern DNA testers. Most of the DNA testers also provide the name of the earliest known paternal ancestor. Some of the tests provide the location of their earliest known ancestor. Despite the small number of Y-DNA test kits that are from the G-Haplgroup, all of this information can be useful in isolating possible areas where the Griff(is)(es)(ith) parilineal line of descent originated.

All surname groups are made up of distinct Y-DNA lineages. Some of those lineages have common ancestry that predates surnames and can reveal Iron and Roman era genetic relationships. Analyzing surnames of Y-DNA testers in the context of SNP and STR markers can create correlations of surnames with geographical areas. [35]

Since the Welsh were late in the game in adopting surnames, finding Y-DNA genetic matches with test kits associated with different surnames may simply indicate common ancestry. Various genealogists have indicated different time periods when the use of surnames arose in Europe. Some have claimed that surnames emerge 25-30 generations ago. While this might be the case for English and possibly other areas in Europe, I would venture to qualify this rule when dealing with Welsh descendants. I would expect common surnames to emerge among Welsh descendants between 12 to 6 generations. Y-DNA matches of test kits that share a Most Common Recent Ancestor (MCRA) prior to this are related but their respective lineages may assume different surnames during the time period where patronymic name sharing practices fell into disuse. [36] A different surname connecting less than 6 generations ago may indicate an NPE. [37] A different name connecting more than 12 generations ago simply indicates common ancestry

Results from the FTDNA L-497 Haplogroup Project

The following Dendrogram is from my earlier analysis of test kits from the L497 Haplogroup Project when I discovered a genetic match with Henry Griffith. The Dendrogram shows my test kit and the test kit of Henry Griffith (different surname) highlighted in blue. Our MRCA is William Griffis, born 1736. The dendrogram estimated William Griffis’ birth about 8 generations from the present (~1691 CE) which was pretty close. What is notable in the dendrogram is the number of different Welsh surnames that are genetically related to both of us: Williams, Gough, Jones. The dates on the dendrogram refer to the approximate dates of birth for the men who are the MRCA for each of the intersections of the graph. Also we are related to a William Jones reported to have been born 1782 in Lanelii, Wales. Our MCRA was born around 1493 CE.

Illustration Eighteen : Dendrogram Linking James Griffis and Henry Griffith

Click for Larger View

Five of the test kits in the FTDNA L497 Haplogroup Project that are part of my subclade subbranches report that their respective paternal ancestors were born in Wales. One test indicates their paternal ancestor Thomas Thomas was born in 1830 in LLantrisant, Glamorgan. Llantrisant is a town in the county borough of Rhondda Cynon Taf, within the historic county boundaries of GlamorganWales, lying on the River Ely and the Afon Clun.

The other set kit indicates their paternal ancestor, William Rhydderch, was born before 1796 in Swansea, Wales. Swansea, Welsh Abertawe) is a , city, Swansea county, historic county of Glamorgan (Morgannwg), southwestern Wales. It lies along the Bristol Channel at the mouth of the River Tawe.

Another test kit indicates that their paternal ancestor was from Broxton, England. Broxton is a village and civil parish in the unitary authority of Cheshire West and Chester and the ceremonial county of Cheshire, England. The village is 11 miles south of Chester, and only 10 miles east of Wrexham in Wales.

Illustration Nineteen: Reported Location of Paternal Ancestor Filtered for G-Z6748 Haplogroup Y-DNA Testers

Click for Larger View | PDF is also Available for better viewing

Results from the FTDNA Wales Cymru Y-DNA Project

Another FTDNA work group that I am a member is the Wales Cymru Y-DNA Project. This work group project is designed to establish links between various families of Welsh origin with patronymic style surnames. Because the patronymic system continued until the 19th century in some parts of Wales, the project does not limit their study to single surnames. A Williams, for example, could just as easily be related to a Jones, Evans, or Roberts as another Williams in the direct male line. This work group, at the time that this story was written, had 1,598 members. Most of the members are part of the E, I, J and R-haplogroups. These haplogroups are predominate Y-DNA haplogroups in the British Isles. The number of test kits within the G-haplogroup that is part of this Y-DNA work group is small. There are 20 test kits representing the G-Haplogroup in this work group.

Isolating test kits from the G-Haplgroup was relatively easy since most of them had haplogroup paths that included the G-P303 branch which I referenced earlier in the story.

Illustration Twenty: Haplogroup Paths for G Haplogroup kits in the Wales Cymru Y-DNA Project

I created a dendrogram of the 20 test kits that were part of the G-Haplogroup and eleven were shown to be related, albeit distantly. As indicated in Illustration Twenty One , the MRCA for most of the test kits was born around 635 CE. I share a common ancestor who was born around 1328 CE with six test kits. Five of the six surnames of their respective paternal ancestors are common Welsh surnames: Rees, Evans, Griffiths, and Howard. The sixth test kit has an uncommon Welsh surname of Rhydderch. It is interesting to note that for those paternal ancestors that were born on the British Isle, they were all born in Wales:

  • Trefeglwys: Trefeglwys is a village and community in Powys, Wales, within the historic county of Montgomeryshire. The name derives from the Welsh language tref ‘township’ and eglwys ‘church’. The village sits on the Afon Trannon.
  • Carmarthenshire: Carmarthenshire is a coastal county in the south-west of Wales. The three largest towns are Llanelli, Carmarthen and Ammanford. Carmarthen
  • Narbeth: Narberth is both a town and a community in Pembrokeshire, Wales. 
  • Harerfordwest: Haverfordwest is the county town of Pembrokeshire, Wales,
  • Llantrisant: Llantrisant is a town in the county borough of Rhondda Cynon Taf, within the historic county boundaries of Glamorgan, Wales
  • Swansea: Swansea is a city and county on the south coast of Wales.

Illustration Twenty One : Enlarged View of Dendrogram of Y-DNA Test Kits from Wales Cymru Y-DNA Project

For an integrated view of the dendrogram and information related to the haplgroup branches associated with the G-Haplogroup test kits in the Wales Cymru Y-DNA Project see Illustration Twenty Two.

Illustration Twenty Two: Dendrogram of G-Haplogroup Test Kits in the Wales Cymru Y-DNA Project

Source: Family Tree DNA | Click for Larger View

Results from the FTDNA G-Z6748 Project

Finally, the recently formed FTDNA Y-DNA Haplogroup Project for SNP G-Z6748, which is downstream from G-M201 > L89 > P15 >> L497 has provided some interesting results. Through initial research, the G-Z6748 appears to be a largely Welsh haplogroup, though extending into neighboring parts of England and one test kit from Denmark.

The Project Administrator of the group produced an interesting map that shows all known Z6748+ participants (and Y-Matches) who have traced their ancestor to a specific town in Europe. As can be seen below, the majority of the group are tracing their ancestors to coastal southern Wales. Some of the outliers appear to be upstream, so perhaps indicating pre-Wales origins for the group. Further upstream G-L497 is from continental Europe in Bronze Age times, so part of the goal for this group and the L497 work group is to understand the timing of the movement to the UK.

Illustration Twenty Three: Map of Paternal Ancestors of Test Kits in the G-Z6748 Haplgroup Project

Click for Larger View

The following are the locations of the 18 pinpoints on the map:

  1. Wiggenhall St. Germans, England: Wiggenhall St Germans is a village and civil parish in the English county of Norfolk in the East of England. It is 85 miles north of London and 5 miles south-west of King’s Lynn.Little Marlow, England: 
  2. Little Marlow is a village and civil parish in Buckinghamshire, England. Little Marlow is located along the north bank of the River Thames, about a mile east of Marlow.
  3. Broxton, England: Broxton is a village and civil parish in the unitary authority of Cheshire West and Chester and the ceremonial county of Cheshire, England. The village is 11 miles south of Chester, and only 10 miles east of Wrexham in Wales.
  4. Acle, England: Acle is a market town on the River Bure on the Norfolk Broads in Norfolk, located halfway between Norwich and Great Yarmouth. It has the only bridge across the River Bure between Wroxham and Great Yarmouth. 
  5. Pontypool, Wales: Pontypool is a town and the administrative centre of the county borough of Torfaen, within the historic boundaries of Monmouthshire in South Wales 
  6. Llysworney is a small village in the Vale of Glamorgan, South Wales, in the community of Llandow. 
  7. Øbjerg is located in the region of South Denmark. South Denmark’s capital Vejle (Vejle) is approximately 74 km / 46 mi away from Objerg (as the crow flies). 
  8. Rotherfield, England: Rotherfield is a village and civil parish in the Wealden District of East Sussex, England. It is one of the largest parishes in East Sussex. There are three villages in the parish: Rotherfield, Mark Cross and Eridge. Rotherfield was originally a Saxon settlement in an area generally covered with oak forest. 
  9. Haverfordwest, Wales is the county town of Pembrokeshire, Wales
  10. Kent, England is a county in South East England on the coast across from Calais France
  11. Llanelli is a market town and the largest community in Carmarthenshire and the preserved county of Dyfed, Wales. It is located on the Loughor estuary 10.5 miles (16.9 km) north-west of Swansea and 12 miles (19 km) south-east of the county town, Carmarthen. Early recorded place names in the Bristol area include the Roman-era British Celtic Abona (derived from the name of the Avon) and the archaic Welsh Caer Odor.  
  12. Narberth is a town and in Pembrokeshire, Wales. 
  13. Swansea  is a coastal city of southern Wales. the city is located along Swansea Bay in southwest Wales, part of the historic county of Glamorgan 
  14. Glamorgan or sometimes Glamorganshire is one of the thirteen historic counties of Wales.   
  15. Bristol, England Situated on the River Avon, it is bordered by the ceremonial counties of Gloucestershire to the north and Somerset to the south.
  16. Glamorgan or sometimes Glamorganshire is one of the thirteen historic counties of Wales.  
  17. Port Talbot is a town and community in the county borough of Neath Port Talbot, Wales, situated on the east side of Swansea Bay, approximately eight miles from Swansea.
  18. Pencoed (Welsh: Pen-coed) is a town and community in the county borough of Bridgend, Wales. It straddles the M4 motorway north east of Bridgend and is situated on the Ewenny River. 

Conclusion

The overlapping of facts from the various FTDNA Y-DNA research groups are coming up with interesting results that strongly suggest the Griff(is)(es)(ith) paternal genetic line of ancestors came from Wales.

Back to the duck test of abductive reasoning, I believe the Griff(is)(es)(ith) surnames related to the family that started its colonial beginnings in Huntington, New York are indeed of Welsh origin.

Sources

The feature image at the tope of the story is an amalgam of maps and statistics on the distribution and prevalence of the Griff(ith)(ith) surname in Ireland and England.

[1] William Case Griffis was the grandson of William Griffis. His grandfather, William Griffis, who was the son of William Griffis, fought in the revolutionary war, William Case Griffis (Born 14 June 1825 in Chatrham, Ontario, Canada and died 27 July 1902 in Beaver Dam, Wisconsin) wrote the following notes in his father’s journal after his father’s death. His father was Reverend William Griffis.

“My Great Grandfather, on my father’s side came from Wales and settled in Huntington, Long Island. They spelled the name Griffiths. My Grandfather, who died at my Father’s house could never give me any reason why he changed it to Griffis. He moved to Canada and settled at Adolphustown where my father was born, also three brothers of my father, Phillip, Stephen and Gilbert and one sister who married a Mr. Harris. My father’s mother, Content Harris, was born in England. I have my grandfather’s old pension certificate for the services in the Rev. War. He had to go to Albany for his pension.”

The quote is from Mary Martha Ryan Jones and Capitola Griffis Welch, compiled by, Griffis Sr of Huntington Long Island and Fredericksburg, Canada 1763-1847 and William Griffis Jr, (Reverend William Griffis) 1797-1878 and his descendants. A self published genealogical manuscript, 1969. Page 103.

[2] John and Sheila Rowlands, The Use of Surnames, Chapter 4, Patronymic Naming – A Survey in Transition, Llandysul, Ceredigion: Gomer Press, 2013,

The chart below reflects the variations in spelling in the family surname among William’s 12 children. 

Based on my assessment of genealogical evidence, seven of the children used the ‘Griffis’ surname, three used the ‘Griffith’ surname and one used the ‘Griffes’ surname.

The third generation of the family reflects a continuation of various spellings of the surname:

  • The descendants of William’s second child, James Griffis, reverted back to the ‘Griffith’ surname.
  • The descendants of the third son, William Griffis, used both Griffis and Griffith. Three of his four sons used ‘Griffis’ while a fourth son used ‘Griffith’. 
  • The fifth son, Stephen Griffis, appeared to have used or was recorded as a Griffith and Griffis but it is not entirely certain what he actually used as a last name. 
  • Nathaniel Griffes, the sixth son, was the only child that spelled his name as an adult with an ‘es’ on then, Griffes. His descendants continued the tradition.
  • While it is not entirely certain, Joel Griffith probably spelled his name with a ‘th’ on the end. 
  • Little is known of the second daughter of William, Esther Griffis, but she probably spelled her last name with an ‘-is’.
  • Epenetus and John used Griffith and Daniel and Jeremiah used Griffis.

[3] In 1700, 80 percent of the British colonists were English and Welsh, in 1755, the figure was 52 percent and by 1775, it was 49 percent. Thirteen Colonies, Wikipedia, This page was last edited on 3 January 2022, it was accessed on 21 Jan 2022.

Simon Newton Dexter North, A Century of Population Growth from the First Census of the United States to the Twelfth, 1790- 1900, U.S.: Bureau of the Census, 1909

[4] W.T.R.Pryce, Migration: Concepts, Patterns and Processes, in John & Shiela Rolands, Welsh Family History: A Guide to Research, Second Edition, Baltimore: Genealogical Publishing Company, 1998, page 248

[5] R. Hargreaves-Mawdsley, Bristol and America: A Record of the First Settlers in the Colonies of North America 1654- 1685, Clearfield 1929, page 3

[6] David Peate, Emigration , in John & Shiela Rolands, Welsh Family History: A Guide to Research, Second Edition, Baltimore: Genealogical Publishing Company, 1998, page 260-261.

[7] Ibid.

[8] Duck test, Wikipedia, This page was last edited on 13 Feb 2023, https://en.wikipedia.org/wiki/Duck_test

[9] Portrait of William Case Griffis by Pastel artist Deborah Phillips Griffis, sister in law of William Case Griffis. (born 1825 • Liverpool, Nova Scotia, Canada and died 20 Nov 1903 • Chicago, IL). pastel is 13 by 18 inches. The owner of the Pastel is Mrs. John Carlson, North Fargo ND. The information was compiled as part of the Smithsonian American Art Museum’s inventory of American Paintings. Susan Montagne originally shared this image 13 Apr 2013 on Ancestry.com

[10] During the period of transition from the Welsh patronymic system to the use of formal surnames, in addition to the influence of using English based names, native Welsh names also were influenced by different adaptations. 

  • the incorporation of the word ap (‘son of’) into the name, e.g. Thomas ap Howell became Thomas Powell;
  • the dropping of the use of ap, e.g. Thomas ap Howell became Thomas Howell
  • the addition of a possessive ‘s’ to a surname: e.g. Griffith became Griffiths
  • the preference for using Old Testament given names within the older nonconformist denominations;
  • the survival of old Welsh names in specific geographical areas; and 
  • the migration of people into Wales from areas with different surname structures (e.g. Scotland, England and Ireland).

John Rowlands, The Homes of Surnames in Wales, in John and Shiela Rowlands, ed, Stages in Researching Welsh Ancestry. Bury, England: The Federation of Family History Societies Publications Ltd., 1999. Pages 164 – 170.

See also: 

Griffith (name), Wikipedia, Page updated 11 Oct 2021, page accessed 8 Dec 2021

Griffith Family History: Griffith Name Meaning, ancestry.com, page accessed 9 Dec 2021

Morgan, T.J., Welsh Surnames, Cardiff: Qualitex Printing Limited, 1985, The Orthography of Welsh Surnames 5-8Gruffydd pgs 103–105

Griffiths Surname Meaning, History & Origin, Select Surnames Website, page accessed 9 Dec 2021

Surname: Griffith, SurnameDB: The Internet Surname Database, page accessed 9 Dec 2021

[11] John Rowlands, The Homes of Surnames in Wales, in John and Shiela Rowlands, ed, Stages in Researching Welsh Ancestry. Bury, England: The Federation of Family History Societies Publications Ltd., 1999. Pages 172

Griffiths Surname Meaning, History & Origin, Select Surnames Website, page accessed 10 Oct 2021

[12] Rev Patrick Woulfe, Ó Gríobhtha, Irish names and Surnames, Library Ireland, Wexford: John English & Co, 1922, https://archive.org/details/irishnamessurnam00woul/mode/2up

Griffith History, Family Crest & Coats of Arms, House of Names, https://www.houseofnames.com/griffith-family-crest/Irish

Séamus Pender, Ed, A Census of Ireland circa 1659, Dublin: Station Office, Government Publications, 1939 https://www.irishmanuscripts.ie/product/a-census-of-ireland-circa-1659/

Griffith Households in Ireland in mid-nineteenth century: John Grenham, Irish Ancestors, https://www.johngrenham.com/findasurname.php?surname=Griffith

Click for Larger View.

All variants of O Griobhtha in Pender’s ‘Census’ of 1659:

Click for Larger View

[13] Shiela Rowlands, Sources of Surnames in John and Shiela Rowlands, ed, Stages in Researching Welsh Ancestry. Bury, England: The Federation of Family History Societies Publications Ltd., 1999. Pages 153 and 159

[14] W.T.R. Pryce, Migration: Concepts, Patterns, and Processes, in John & Shiela Rolands, Welsh Family History: A Guide to Research, Baltimore: Genealogical Publishing, 1998, Pages 230- 257

[15] The prevalence of the Griffith surname has been documented in Wales in the 1800’s. Based on an analysis of census data in Wales in 1850, the top ten most common names represented approximately 80 percent of the Welsh population. While these names were common, it does not imply they were related. 

The result of using similar names as surnames resulted in the lack of diversity in surnames in Wales, see: John Rowlands, The Homes of Surnames in Wales in John Rowlands and Shiela Rowlands, ed, Stages in Researching Welsh Ancestry. Bury, England: The Federation of Family History Societies Publications Ltd., 1999. Page 162

Durie, Bruce, Welsh Genealogy, Stroud, United Kingdom: The History Press, 2013, Page 27

[16] John Rowlands, The Homes of Surnames in Wales, in John and Shiela Rowlands, ed, Stages in Researching Welsh Ancestry. Bury, England: The Federation of Family History Societies Publications Ltd., 1999. Page 162-164

[17] John and Sheila Rowlands, The Use of Surnames, Chapter 4, Patronymic Naming – A survey in Transition, Llandysul, Ceredigion: Gomer Press, 2013, Pages 50-57

[18] Ibid.

[19] This approach and examples are from Rob Spencer who has produced some very interesting analyses of surname distributions using census data as well as Y-DNA data from FTDNA. In addition, he has created a tool to analyze SNP data with census data in his Britain and Ireland SNP and Surname Mapper. See:

Rob Spencer, Britain and Ireland SNP and Surname Mapper, Tracking Back: a website for genetic genealogy tools, experimentation, and discussion, http://scaledinnovation.com/gg/biMapper.html

Rob Spencer, Surname Diffusion, Tracking Back: a website for genetic genealogy tools, experimentation, and discussion, http://scaledinnovation.com/gg/gg.html?rr=surnameDiffusion

Rob Spencer, County Clustering by Surnames, Tracking Back: a website for genetic genealogy tools, experimentation, and discussion, http://scaledinnovation.com/gg/gg.html?rr=countyClustering

[20] Welsh Counties and Towns in 1800, Map in Wales and the British overseas empire Chapter DOI: https://doi.org/10.7765/9781526117571.00008 Online Publication, 01 Feb 2017 from H.V. Bowen, Wales and the British Overseas Empire: Interactions and Influences, 1650-1830, Manchester: Manchester University Press

[20] Rob Spencer, Britain and Ireland SNP and Surname Mapper, Tracking Back: a website for genetic genealogy tools, experimentation, and discussion, http://scaledinnovation.com/gg/biMapper.html

[21] This example and line of reasoning is from Rob Spencer’s unique analysis of the 1881 British Census data: Rob Spencer, County Clustering by Surnames, Tracking Back: a website for genetic genealogy tools, experimentation, and discussion, http://scaledinnovation.com/gg/gg.html?rr=countyClustering#h6

Rob Spencer, Surname Similarity, Tracking Back: a website for genetic genealogy tools, experimentation, and discussion, http://scaledinnovation.com/gg/gg.html?rr=surnameSimilarity

[22] Rob Spencer, County Clustering by Surnames, Tracking Back: a website for genetic genealogy tools, experimentation, and discussion, http://scaledinnovation.com/gg/gg.html?rr=countyClustering#h6

See also:

County Clustering by surname. Clustering by counties top 5000 surnames finds a number of patterns. 

  1. The Orkneys and Shetland are distinct, yet closer to Lowlands than Highlands names. 
  2. The English southwest and northeast are distinct. 
  3. Highland surnames are distinct; Lowland names are closer to English names. 
  4. Welsh counties, except Pembroke, are quite self-similar. 
  5. Irish counties are more diverse than English or Scottish. 
  6. Northern Irish names are distinct, slightly closer to west-central Ireland. 

Rob Spencer, Case Studies in Macro Genealogy, Presentation for the New York Genealogical and Biographical Society, July 2021, Slide 32,  http://scaledinnovation.com/gg/ext/NYG&B_webinar.pdf

[23] Rob Spencer, County Clustering by Surnames, Tracking Back: a website for genetic genealogy tools, experimentation, and discussion, http://scaledinnovation.com/gg/gg.html?rr=countyClustering#h6

[24] Ibid.

Rob Spencer, Surname Similarity, Tracking Back: a website for genetic genealogy tools, experimentation, and discussion, http://scaledinnovation.com/gg/gg.html?rr=surnameSimilarity

Rob Spencer, A Quantitative Look at Surnames and Patronymy, Tracking Back: a website for genetic genealogy tools, experimentation, and discussion, http://scaledinnovation.com/gg/gg.html?rr=surnames

Rob Spencer, Locating SNPs with Census Data , Tracking Back: a website for genetic genealogy tools, experimentation, and discussion, http://scaledinnovation.com/gg/gg.html?rr=biMapping#h8

[25] Rob Spencer, SNP Tracker, Tracking Back: a website for genetic genealogy tools, experimentation, and discussion, http://scaledinnovation.com/gg/snpTracker.html

[26] Map Options: Once you have entered a SNP and hit go and have a path showing on the map you can open the options panel by clicking on a symbol of three short horizontal lines located in the upperright hand corner. The options include:

  • “Zoom to Europe” toggles between views of Eurasia/Africa and Europe. The camera button sends a JPG file to your Downloads folder. The “Smooth Path” toggle optionally invokes an algorithm that removes much of the scatter of self-reported locations while trying to be consistent about traversal time.
  • “Show ” will drop down a simple animation slider control. Click the play arrow  to start the animation of a walking man who will trace your paternal or maternal ancestry. You can pause the animation and then drag the slider to place the walker anywhere on your path.
  • “Show ” and “Show Events” will show relevant ancient DNA sites and cultural or environmental patterns as the walker passes by. Details of the ancient DNA are shown in the SNP table by clicking any row’s  icon, and Wikipedia summaries of the events are shown at the History tab.
  • “Show Topography” toggles between a minimal coastline background and an topographic map. The topographic map was generously created Tom Patterson; he and his and colleagues at Natural Earth ( and ) produce beautiful maps that show the earth without human labels or influence.
  • “Show Descendants” displays the descendants of the SNPs in your path. Within the path, arrows indicate the distance (by length) and number (by width) of the first-level branches from the SNP. For the last SNP, all SNP descendants are shown. This has no effect if your path ends in a terminal SNP, but it gives dramatic results with major ancestral SNPs such as F-M89 (ancient Mesopotamia), I-M170 (associated with Western Hunter-Gatherer), R-M417 (Eastern Hunter-Gatherer), R-L23 (Yamnaya), and I-M253 (early Scandinavian).

[27] The following SNPs were used to construct the migratory path for my terminal SNP.

Source: SNP Tracker Using BY211678 as SNP | Click for Larger View

“The sketch illustrates the difference between tMRCA (time to most recent common ancestor) and formation dates. A SNP is a mutation that occurs at a certain time and place. At some point afterwards, a person with that SNP will have two or more children each with modern descendants who have done DNA testing. From those DNA tests we can infer the time to that branch-point; this is the SNP’s tMRCA. In a rapidly expanding population with many surviving lineages, tMRCA and formation are very close and may be identical. But for older and leaner lineages, a SNP may appear long before one of the originator’s descendants has two surviving lineages, and additional separate mutations may occur in that time. In the sketch, SNP M2 is one of 21 such equivalents: different mutations but evidently from a long unbranched line, since all DNA testers either have none of these 21 SNPs or they have all of them. The tMRCA for M2 is shown in blue; it’s where branches that have S3 and S4 split away. But the formation time for M2 cannot be directly measured and it could be anywhere between M2’s tMRCA and the previous tMRCA. YFull’s convention is to assign a SNP’s formation date to the previous SNP’S tMRCA (the left-most of the long run of equivalent SNPs). But it is perhaps better to estimate the formation date as halfway between, as shown by the red dot, which is what SNP Tracker does.”

Rob Spencer, SNP Tracker , Discussion Tab, http://scaledinnovation.com/gg/snpTracker.html

[28] See Spencer’s comments on updates to the tracker: Robb Spencer, Highway Maintenance, Tracking Back, a website for genetic genealogy tools, experimentation, and discussion, Page accessed 1 Aug 2022, 

As one individual indicated in his assessment of Spencer’s SNP Tracker tool: 

“Rob Spencer does his best with this tool, but ultimately this is a very tricky subject to get right. Consequently, you should take anything you see on the SNP tracker with a very large pinch of salt. The results are meant to be instructive, but not accurate.”

source:  Comment about the SNP Tracker at R1b-U106@groups.io This is a forum for discussion of Haplogroup R1b-U106 and related genetic genealogy topics.

A lot of the problems come from the fact DNA testing is very biased towards testing people from the British Isles, by factors of up to 12:1 or more compared to other European countries. This is changing as more individuals are completing Y-DNA tests from other regions of the world. This means that the tracker can not work with a homogeneous data set. Rob Spencer has corrected the British / European Continental bias as best he as he can, but as he professes, he does not correct for variations within Europe, and he can not remove the basic fundamental problem that he has to use small numbers of testers from poorly sampled regions to fill in a lot of the gaps. Consequently, the origins he marks for individual haplogroups are usually too far west. He indicates that he has pinned some of them manually to increase historical accuracy.

Many of the haplogroups Spencer claims have originated in the British Isles are simply there because they show up as a handful of cases in Britain or Ireland and we have no evidence of their existence elsewhere due to this bias. Unless a haplogroup has a very unique geographical distribution or is wholly found in continental Europe (a lot of haplogroups do fit these criteria), it takes several hundred testers to accurately place its origin at the level of individual countries.

As stated in a related post on this forum, the ages in the SNP tracker come from YFull.org. 

“YFull only contains a small subset of the overall data that’s available to Family Tree DNA. This means their underlying set of tests is small, and their uncertainties are correspondingly large. Potentially, the most serious consequence of this – and I don’t know how Rob deals with this – is that haplogroups that are on YFull’s tree don’t always match up with those on Family Tree DNA’s tree, even when they have the same name. This is because many of those haplogroups have been split by FTDNA. I also don’t know exactly what Rob does for haplogroups that don’t have ages in YFull – I presume he just counts SNPs down the tree, but he’ll have to do this without knowledge of whether those SNPs come from BigY-500 or -700 tests, which makes a big difference.”  PDF of comment:

See: Original Threaded post: SNP Tracker 19 Jan 2021, https://groups.io/g/R1b-U106

YFull’s uncertainties also remain large because they only take SNP data into account. If you take STR data and any other historical information you can get your hands on (paper trails, surnames, ancient DNA), then you can create much more accurate results… at least, in theory.

Rob Spencer, SNP Tracker , SNP Tab, http://scaledinnovation.com/gg/snpTracker.html

Rob Spencer, SNP Tracker , Discussion Tab, http://scaledinnovation.com/gg/snpTracker.html

[29] Scientific Details for MCRA for Haplogroup G-Z40857, FamilyTreeDNA , https://discover.familytreedna.com/y-dna/G-Z40857/scientific?section=tmrca

Click for Larger View

[30] This individual is associated with a test kit that is part of the FTDNA Y-DNA G-Z6748 Work group project. This is a Y-DNA Haplogroup Project for SNP G-Z6748, which is downstream from G-M201 > L89 > P15 >> L497. All participants who are Z6748+ are welcome to join, including any of its downstream variants. G-Z6748 appears to be a largely Welsh haplogroup, though extending into neighboring parts of England. https://www.familytreedna.com/groups/g-z6748/about

[31] Rob Spencer, Locating SNPs with Census Data , Tracking Back: a website for genetic genealogy tools, experimentation, and discussion, http://scaledinnovation.com/gg/gg.html?rr=biMapping#h8

Rob Spencer, SNP Tracker , Discussion Tab, http://scaledinnovation.com/gg/snpTracker.html

[32] Haplogroup G-P303, Wikipedia, This page was last edited on 30 August 2022, https://en.wikipedia.org/wiki/Haplogroup_G-P303

[33] Rob Spencer, Britain and Ireland SNP and Surname Mapper, Tracking Back: a website for genetic genealogy tools, experimentation, and discussion, http://scaledinnovation.com/gg/biMapper.html

[34] Scientific Details for MCRA for Haplogroup G-Z40857, FamilyTreeDNA , https://discover.familytreedna.com/y-dna/G-Y132505/scientific

Click for Larger View.

[35] Rob Spencer, A Quantitative Look at Surnames and Patronymy, Tracking Back: a website for genetic genealogy tools, experimentation, and discussion, http://scaledinnovation.com/gg/gg.html?rr=surnames

[36] In the 16th century the whole of Wales was annexed by England and incorporated within the English legal system under the Laws in Wales Acts 1535 and 1542. It is at this time I would venture to state that initial erosion of the patrinymic naming system in Wales may have started. Wales initially experienced legal attempts to change from a patrimynic naming system to a surname based system. However, as documented by Rowans, the actual decay of the patrinymic system started from around 1600 to the late 1700’s.

For the sake of argument, let us assume that surnames start to emerge in Wales around 1550 based on the influence of English law and dominance. Then 1955 – 1550 = 405; 405 / 33 = 12.27 or roughly 12 or 13 generations ago – this can be one point on our “Welsh generation range of surname use”. The most recent end point limit for our Welsh surname emergence range can be based on John and Sheila Rowlands’ research on the use of surnames in Wales. It was not until the mid-nineteenth century that the Patronymic system was fully replaced in Wales. However, assuming the Griff(is)(es)(ith) family was from one of the counties in southern Wales, let us use the year of 1750 as the arbitrary other end of the range. Then 1955 – 1750 = 205; and 205 / 33 = 6.21 or roughly 6 generations. Hence we have a range of 13 to 6 generations to anticipate the emergence of surnames for Welsh descendants.

then the use If we assume a generation is 33 years and “Years before Present”is based on the year 1955, then if surnames star to emerge in Wales around 1550,

For Rob Spencer’s assessment of the emergence of surnames based on generational distance, see:

Rob Spencer, A Quantitative Look at Surnames and Patronymy, Tracking Back: a website for genetic genealogy tools, experimentation, and discussion, http://scaledinnovation.com/gg/gg.html?rr=surnames

Rob Spencer, Extending Time Horizons with DNA Part One: Find Ancestors back 300 Years, Slide 16, Roots Tech  2022 Sessions, http://scaledinnovation.com/gg/ext/rt22/rt22slides.pdf

Rob Spencer, Clans and SNPs, Tracking Back: a website for genetic genealogy tools, experimentation, and discussion, http://scaledinnovation.com/gg/gg.html?rr=snpClans

For a specific assessment of the emergence of Welsh surnames and its effect on generational distance, see:

John and Sheila Rowlands, The Use of Surnames, Chapter 4, Patronymic Naming – A Survey in Transition, Llandysul, Ceredigion: Gomer Press, 2013, Figure 4-3: Decay in the use of patronymic naming to the 10% level, Page 56

[37] NPE stands for Non-paternity event. Non-paternity event is a term used in genetic genealogy to describe any event which has caused a break in the link between an hereditary surname and the Y-chromosome resulting in a son using a different surname from that of his biological father

Non-paternity event, International Society for Genetic Genealogy Wiki, This page was last edited on 22 March 2021, https://isogg.org/wiki/Non-paternity_event