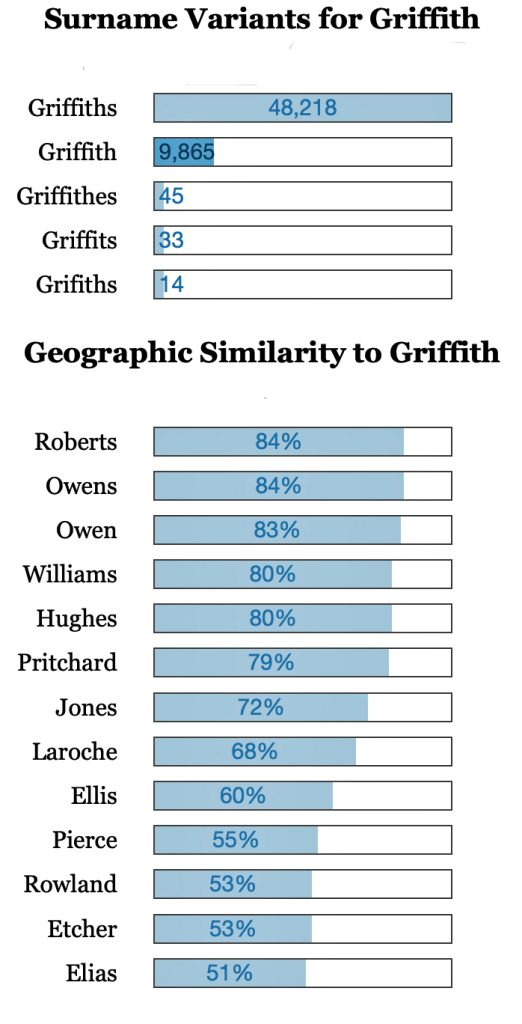
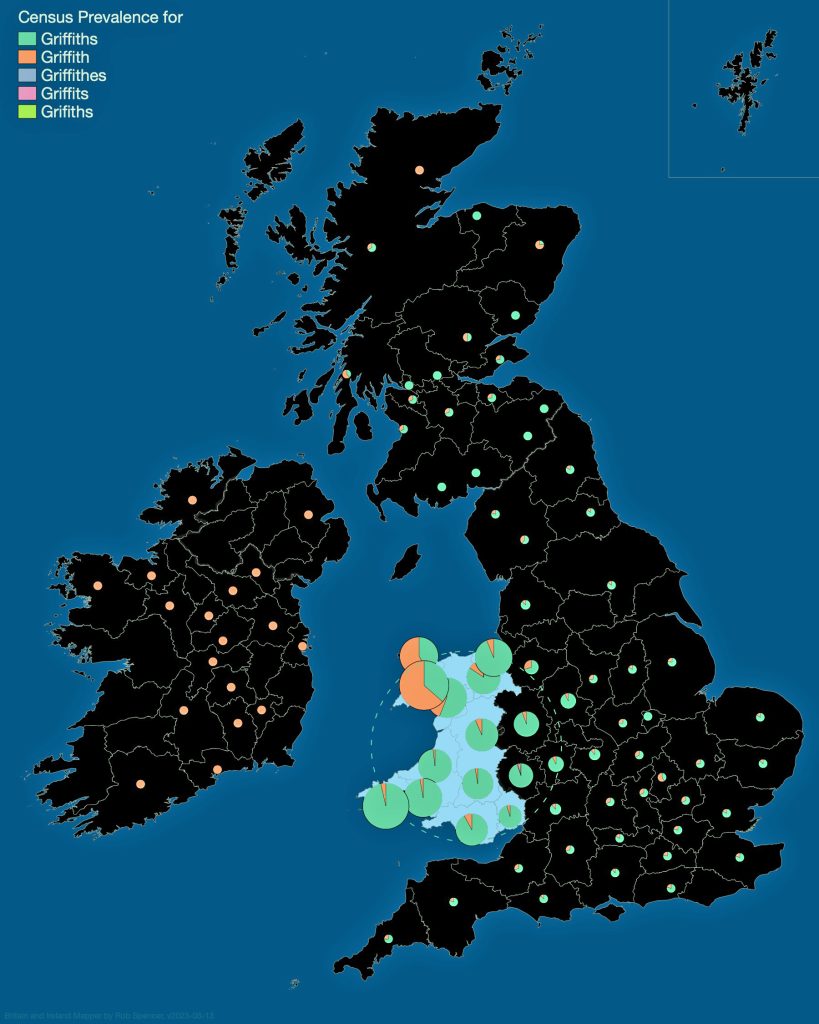
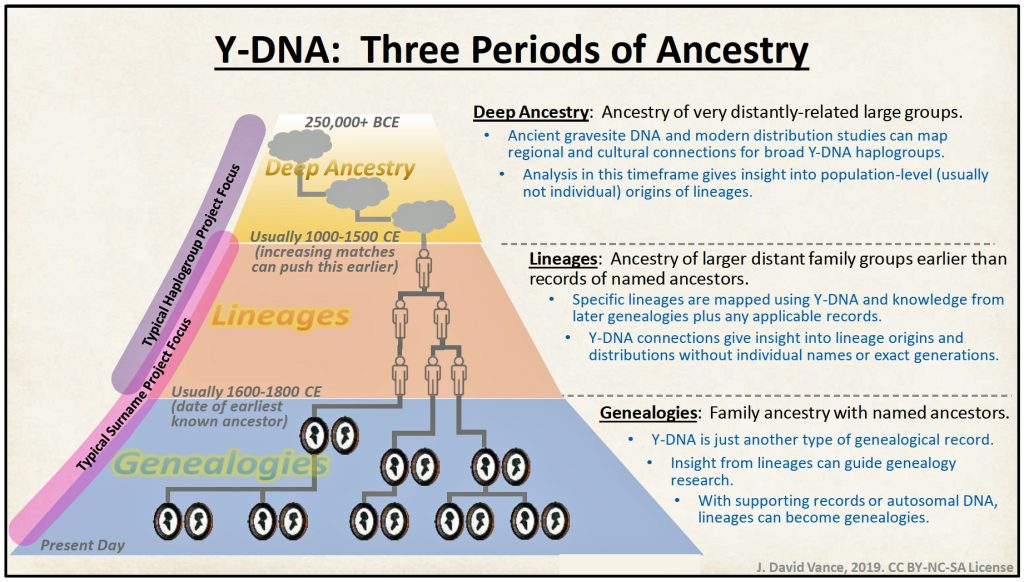
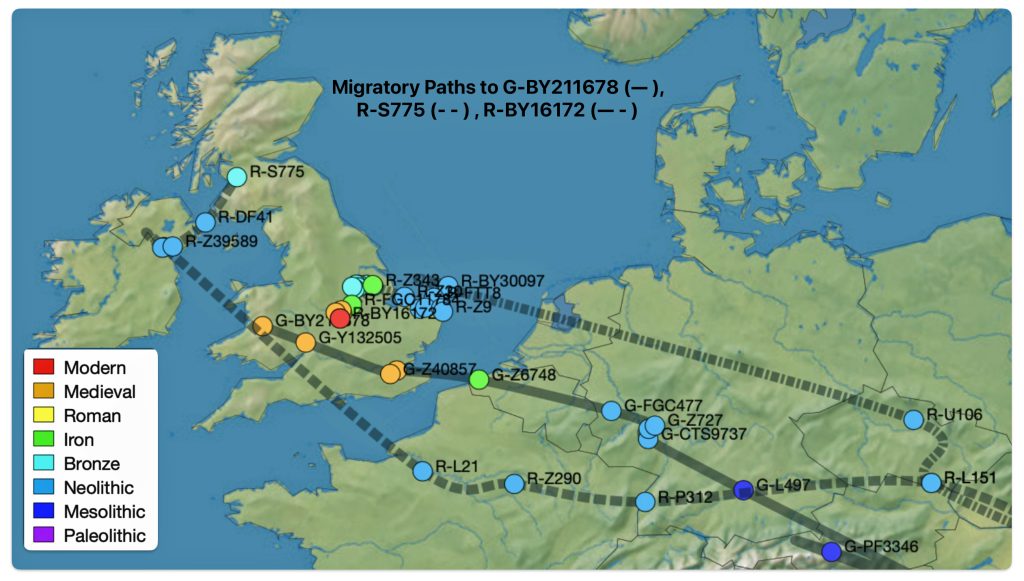
In prior posts, I discussed the utility of Y-DNA tests as a possible avenue to gain insights and possible leads on identifying information about tracing the lineage associated with family surnames for the Griffis(ith)(es) family. [1] I have not discussed my experience of using autosomal DNA tests for genealogical and family research.
There are perhaps two unique things that atDNA tests can provide. They can:
- identify unknown living relatives and their possible relationships; and
- identify a possible relationship of a common ancestor that you share with a living relative.
My experience with atDNA tests have largely resulted in the initial discovery of many living third to fifth generational cousins. However, all of these distant cousins fail to document their respective lines of descent in various DNA company databases. The lack of this additional genealogical information makes it difficult to document where our common distant family connections are located.
A few of the genetic connections from the atDNA tests have provided documentation on common family connections. Based on their information, I have been able to identify a few distant connections. On two other occasions, I have discovered two half brothers.
This three part story focuses on the merits and limitations as well as my personal experience of using autosomal DNA (atDNA) tests for documenting genetic kinship ties in the Griffis family. This part provides general background to make sense of the DNA results. The second part of the story discusses my ongoing DNA discoveries from these tests. As such, the information can change in the future. The third part is devoted to my profound discovery of having two half siblings David and Greg.
General Comparison of DNA Tests
Depending on the DNA test, they tell you how much of their DNA you have inherited from unspecified ancestors on each side of your family or how far back you can trace genetic lineages through a maternal or paternal line. Genetic genealogy or results from DNA tests do not tell you where each member on your family tree lived or provide information on their specific family relationships.
DNA results can identify matches of living individuals and their possible shared kinship relationships. These estimates are based on the amount of shared DNA segments between the match and you. When it comes to identifying specific individuals and verifying kinship relationships, traditional genealogical research is typically required for interpretation of the results. [2]
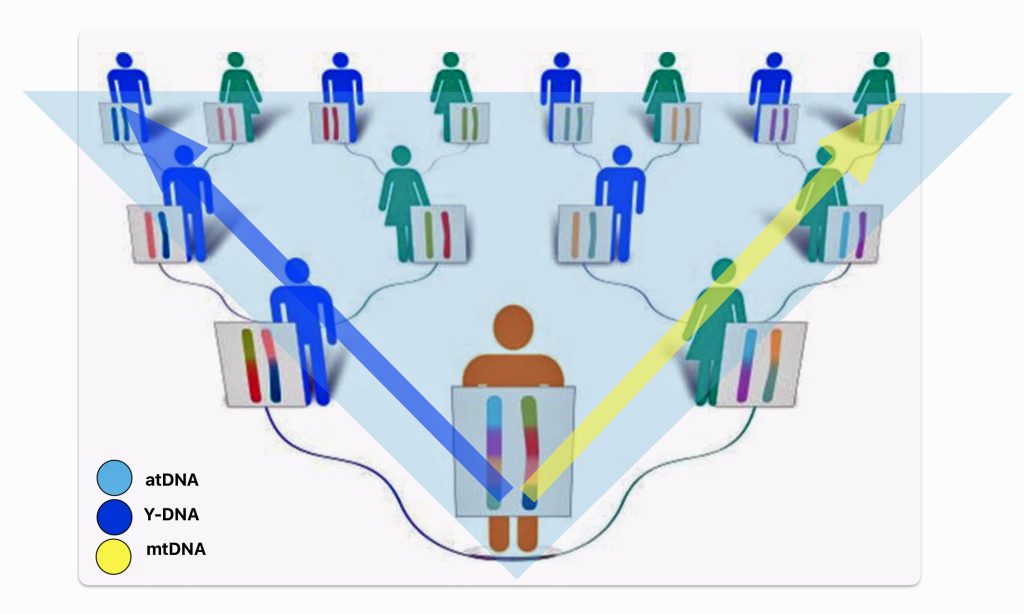
There are basically three types of genetic tests used in genealogical research. Autosomal ancestry (atDNA), Y-DNA, and mitochondrial DNA (mtDNA) tests (see illustration one below). Autosomal tests can analyze a broader range of genetic family network ties than the Y-DNA or mtDNA tests. Y-DNA and mtDNA tests respectively trace the paternal and maternal sides of one’s genetic history. The atDNA tests are broader in their ability to trace genetic relatives on both sides of your family tree. However, their effectiveness of tracing ancestors is limited in terms of how many generations back they can effectively provide results. Another unique characteristic of the atDNA tests is matching living test takers through the amount of shared autosomal DNA.
Illustration One: Three Types of DNA Tests
As indicated in table one, while limited to the paternal line of descent, Y-DNA tests can effectively track male genetic descendants back around 300,000 years. Mitochondrial testing of the matrilineal line can also provide results that go back over 140 thousands of years. The popular atDNA ‘ethnicity’ tests can trace back through a limited number of generations. While women have two X chromosomes, DNA testing of the X-DNA is usually tested along with other chromosomes as part of an atDNA test. [3]
Table 1: Type of DNA Testing
| Characteristic | Autosomal DNA (atDNA) | Y – DNA (YDNA) | Mitochondrial DNA (mtDNA) |
|---|---|---|---|
| What does it test? | All autosomal chromosomes | Y chromosome | Mitochondria |
| Available to | Both males and females | Only males can take test | Both males and females |
| How far back? | 5 – 9 generations | ~155,000 Years | ~200,000+ years |
| Source of Testing | Autosomal Chromosomes | Y Chromosome | X Chromosom found in Mitochondria |
| What genealogical lines tested? | All ancestry lines | Only Paternal (father’s father’s father, etc) | Maternal (mother’s mother’s mother, etc.) |
| Benefits – utility | Finding relatives within a few generations, determining broader ethnicity estimations, identifying potential matches across both sides | Tracing direct paternal lines, surnames, identifying specific paternal lineages and haplogroups, studying deep paternal ancestry | Tracing a direct maternal line, identifying maternal haplogroups, analyzing ancient ancestry patterns |
| Available from the following companies: | – ancestry.com – Family Tree DNA – 23andMe – Myheritage – Living DNA | – Family Tree DNA – 23andME (high level) – YSEQ – Full Genome Corp | – Family Tree DNA – 23andMe – YSEQ – Full Genome Corp |
Autosomal DNA tests are useful for finding relatives, such as unknown relatives, clarifying uncertain family relationships and identifying distant relatives. Typically DNA companies identify matches up to six generations. The Y-DNA and mtDNA tests, while limited to only tracing paternal lines or maternal lines respectively, can trace genetic lineage back over 150,000 years.
Popularity of Autosomal DNA Tests
“For about a hundred dollars, it is now possible to spit into a tube, drop it in the mail, and within a couple of months gain access to a list of likely relatives. If you have any colonial American ancestors, the first thing you realize, taking a DNA test for genealogical purposes, is that potential sixth cousins are a whole lot easier to come by than you ever imagined. Even fifth cousins — people with whom you share a fourth great-grandparent — aren’t a particular scarcity.” [4]
“These tests provide information about an individual’s ancestral roots, and they can help to connect people with their relatives, sometimes as distantly related as fourth or fifth cousins. Such information can be particularly useful when a person does not know their genealogical ancestry (eg. many adoptees and the descendants of forced migrants). “ [5]
The direct-to-consumer genetic testing market has shown significant growth in recent years, but there are indications of a recent slowdown in sales in 2023.
As many people purchased consumer DNA tests in 2018 as in all previous years combined. [6] Combined with prior years of personal consumer testing, more than 26 million consumers had added their DNA to ostensibly four leading commercial ancestry and health databases.
Chart One: atDNA Database Growth
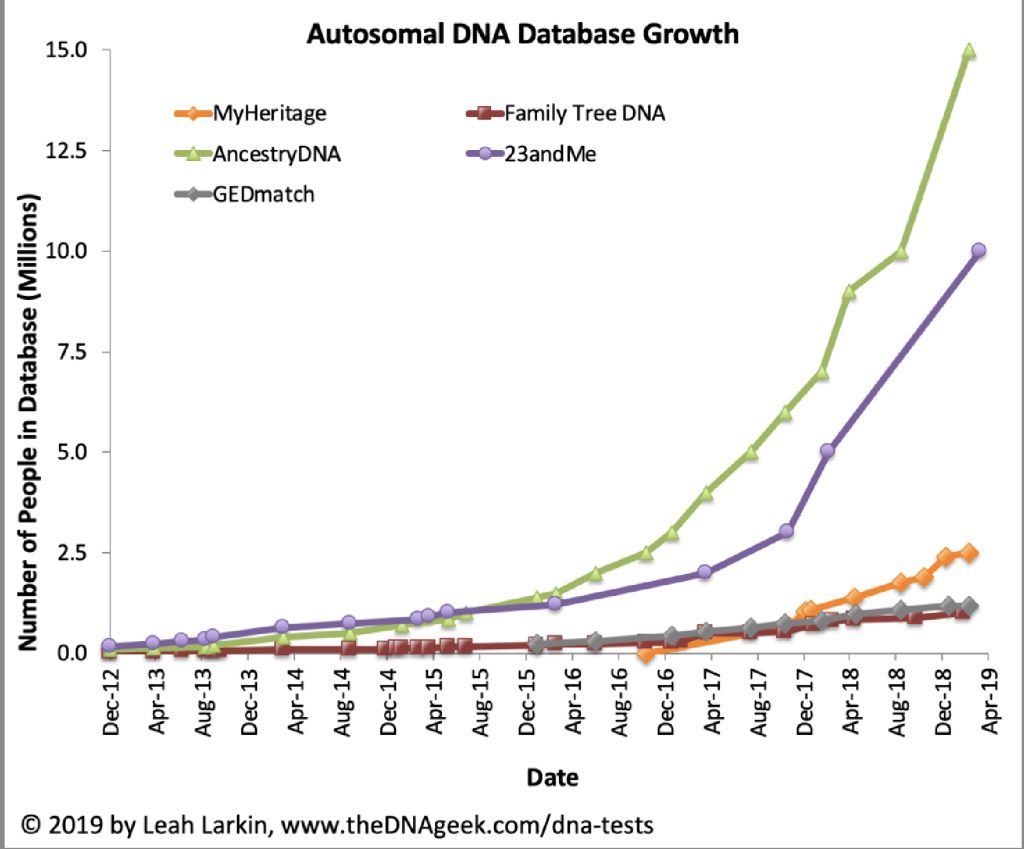
In late 2019, there were signs of declining sales. Ancestry and 23andMe saw drops in direct website sales of 38% and 54% respectively compared to 2018. [7]
“Less than five years ago, consumer DNA tests were being hailed as the innovative technology of the future—but today, declining sales have forced several companies in the field to scale back their workforces and adjust their business strategies.” [8]
Market data from DNA companies suggest that the market continues to grow, albeit at a slower rate than the initial boom years. Projections include all type of DNA tests (e.g. genetic relatedness, ancestry, lifestyle wellness, reproductive health, personalized medicine, sports nutrition, reproductive health, diagnostics and others). Factors like market saturation among early adopters and privacy concerns may be contributing to the moderation in growth rates.
Despite the decade-long rise in sales, in 2020 there was a sudden decline in interest. Two of the leading companies, 23andMe and AncestryDNA, experienced declines in sales of DNA ancestry kits of 54 and 38 percent, respectively. The decline was attributed to market saturation, economic recession related to the COVID-19 pandemic, and privacy concerns. [9]
Since 2021, 23andMe, a prominent direct-to-consumer genetic testing company, has faced significant financial challenges that have raised concerns about its future and the security of customer data. The company’s financial situation has deteriorated rapidly. Its stock price has plummeted, losing over 97% of its value since going public in 2021. 23andMe is reportedly on the verge of bankruptcy and has never turned a profit. In 2023, the company suffered a major data breach affecting nearly 7 million users. The company has had turnover of board members and internal dissension between board members and executive management. [10]
This situation surrounding 23andMe serves as a cautionary tale about the risks associated with entrusting sensitive genetic information to private companies and highlights the need for robust data protection measures in the rapidly evolving field of consumer genomics. It also underscores the need to have back up contingencies of one’s DNA data. [10a]
What do atDNA Tests Measure?
Autosomal DNA tests basically measure five things.
- Genetic Markers: atDNA tests look at hundreds of thousands of genetic markers in a DNA sample called single nucleotide polymorphisms (SNPs) across the 22 autosomal chromosome pairs. More on SNPs later in this story. These sampled SNPs represent DNA sequences that can be used to efficiently identify genetic differences and similarities between individuals.
- Inheritance Patterns: The tests examine the autosomal DNA inherited from both parents, which includes genetic contributions from all recent ancestors. This allows for connections to be made with relatives on all “recent” branches of a family tree, not just direct paternal or maternal lines in the past six or so generations.
- Genetic Relatives: The tests identify shared DNA segments between the test taker and other individuals in the DNA test company’s database, allowing for the discovery of genetic relatives that are living and linking each matched DNA tester to past generations.
- Ethnicity Estimates: By comparing an individual’s genetic markers to reference populations maintained by a DNA test company, autosomal DNA tests can provide estimates of a person’s ancestral origins and ethnic background.
- Health Traits: Many atDNA testing companies also include screening for certain inherited health conditions or physical traits that can play in one’s life to identify certain genetic code that could affect health.
The Genetic Influence of Autosomal DNA
An atDNA test is a measurement of sampled parts of your 22 autosomal chromosomes. Everyone (with rare exceptions) is born with a set of 23 pairs of chromosomes. The twenty-third chromosome is the sex chromosome. In most cases, we inherit an X chromosome from our mother and a Y or X chromossome from our father to determine our sex differentiation. (See illustration two).
Illustration Two: Karyotype of Human Chromosomes [11]
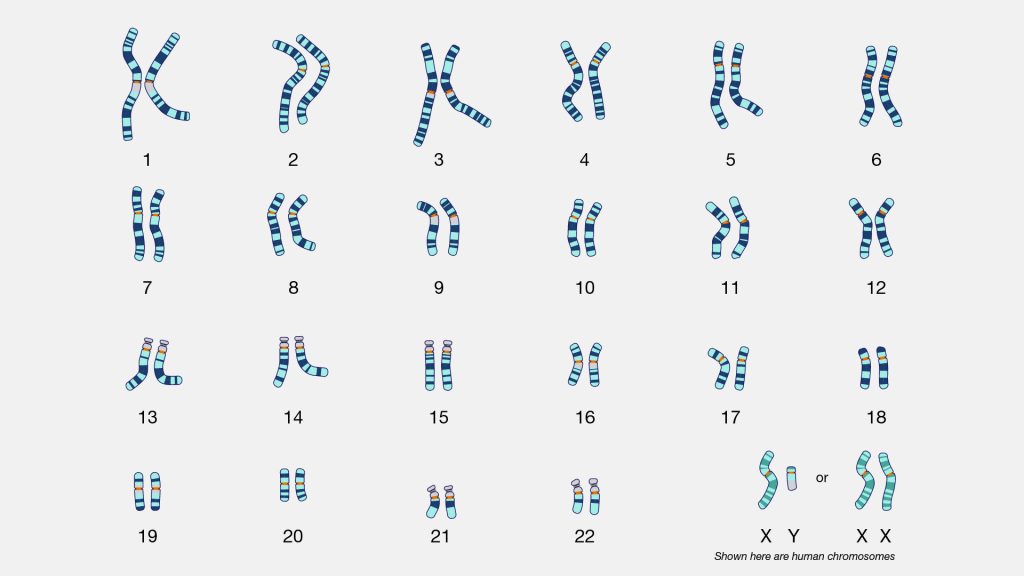
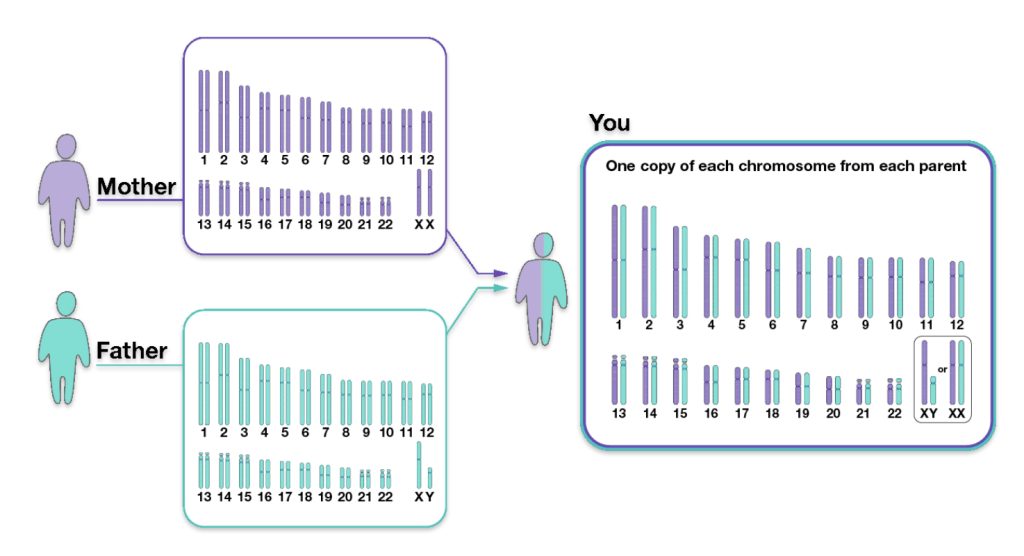
We inherit half of our chromosomes from our mother and the other half from our father. Two of those pairs are usually sex chromosomes (for most cases, XX in females and XY in males). The remaining 22 pairs of chromosomes are autosomal chromosomes or autosomes. For example, as illustrated below, chromosomes from the depicted mother are labeled in purple, and chromosomes from the depicted father are labeled in teal. (See illustration three). [12]
Illustration Three: Inheritance of Parental Chromosomes
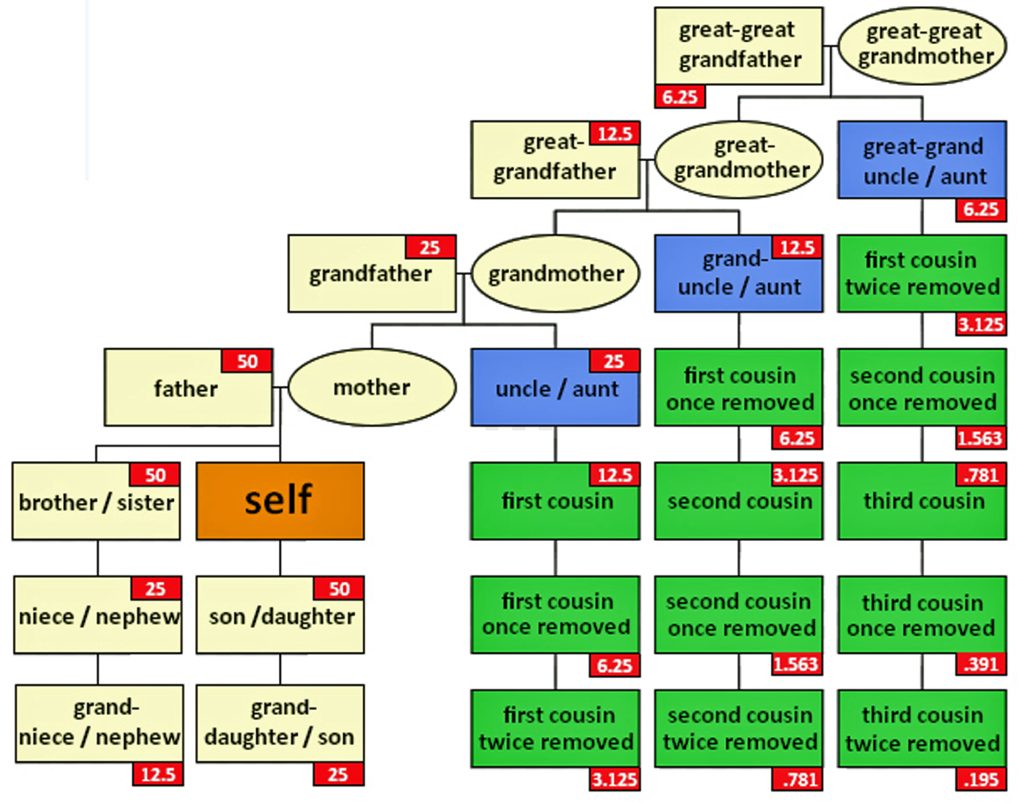
The genetic inheritance patterns associated with autosomal chromosomes become more complex and diluted over generations due to recombination and variable inheritance patterns. [13] Illustration four shows the average amount of atDNA inherited by all close relations up to the third cousin level. The illustration uses the maternal side as a an example. The percentages can be replicated for the paternal side. [14] As reflected in the chart, fifty percent of one’s atDNA is inherited from each parent and roughly equally portions from grandparents to about 3x great-grandparents.
Illustration Four: Percent of Autosomal Genetic Inheritance from Descendants
During meiosis [15], genetic recombination occurs, shuffling segments of DNA from each of the parents. This means that siblings may inherit different combinations of DNA segments from their parents; and with each generation, the specific segments inherited become more randomized. As a result, the amount of shared DNA between relatives decreases exponentially with each generation, making it more challenging to detect distant relationships through autosomal testing.
The random nature of genetic inheritance leads to variability in how much DNA is shared between relatives, especially for more distant relationships. This is known as variable expressivity. [16] For example, as indicated in table two, full siblings may share anywhere from about 35% to 65% of their DNA; and first cousins typically share around 12.5% of their DNA, but the actual range can vary significantly. This variability increases with more distant relationships, making it harder to precisely determine the degree of relatedness based solely on shared DNA percentages (see table two). [17]
Table Two: Average Percent of Autosomal DNA Shared Between Selected Relatives
| Relationship | Average Percent of DNA Shared | Range of DNA Shared |
|---|---|---|
| Identical Twin | 100% | N/A |
| Parent-Child | 50% (but 47.5% for father-son relationships) | N/A |
| Full Sibiling | 50% | 38% – 61% |
| Half Sibling Grandparent / Grandchild Aunt / Uncle Niece / Nephew | 25% | 17% – 34% |
| 1st Cousin Great-grandparent Great-grandchild Great-Uncle / Aunt Great Nephew / Niece | 12.5% | 4% – 23% |
| 1st Cousin once removed Half first cousin | 6.25% | 2% – 11.5% |
| 2nd Cousin | 3.13% | 2% – 6% |
| 2nd Cousin once removed Half second cousin | 1.5% | 0.6% – 2.5% |
| 3rd Cousin | 0.78% | 0% – 2.2% |
| 4th Cousin | 0.20% | 0% – 0.8% |
| 5th Cousin to Distant Cousin | 0.05% |
While autosomal DNA testing has become increasingly accurate, there are still limitations in the context of estimating genetic relations and finding relatives. Current testing methods typically analyze only a subset of genetic markers. In addition, the interpretation of results relies on comparison to reference populations, which may not fully represent all ancestral groups. In the end, as previously stated, traditional genealogical research brings atDNA results into focus.
Genetic Variants: The Genetic Basis of atDNA Testing
A genome is the complete set of DNA instructions found in every cell. [18] As discussed in a prior story, the human cell is a masterpiece of data compression. [19] Its nucleus, just a few microns wide, contains (if you ‘spell’ it out) six feet of genetic code comprised in a double helix called the DNA: deoxyribonucleic acid (see illustration five).
Illustration Five: Structure of Deoxyribonucleaic Acid (DNA)
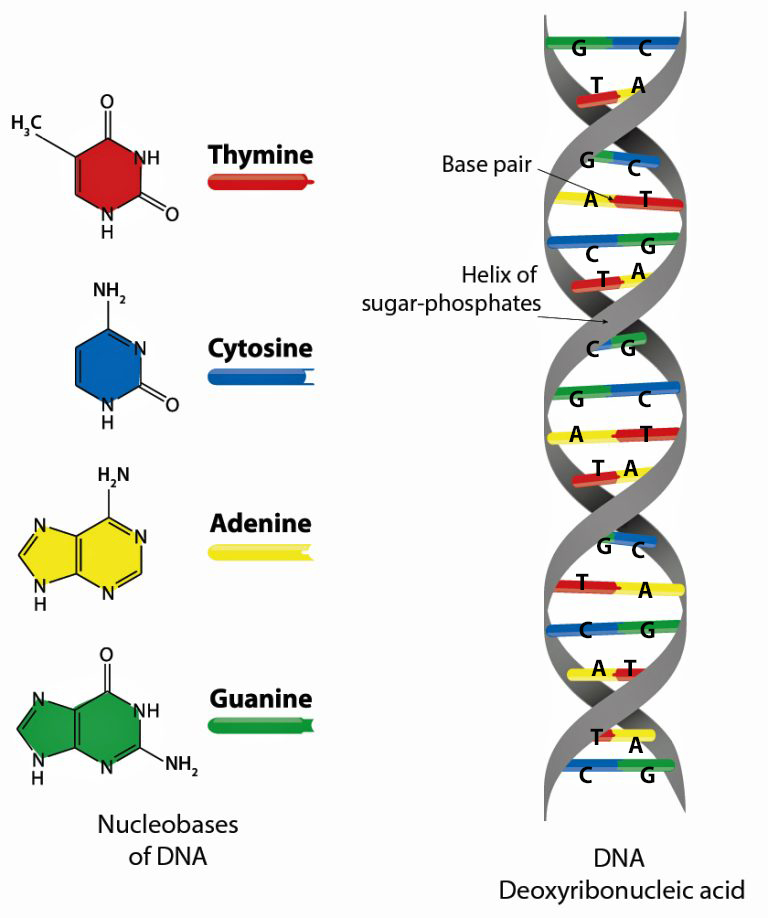
The DNA helical molecules string together some three billion pairs of nucleotides that are comprised of proteins, sugar (deoxyribose), a phosphate and four types of nitrogenous bases which are represented by an initial: A (adenine), C (cytosine), G (guanine), and T (thymine). Nucleotides are the fundamental building blocks that make up the DNA strands. The sequence of nucleotides along the DNA strand encodes genetic information and regulates when codes are activated. [20]
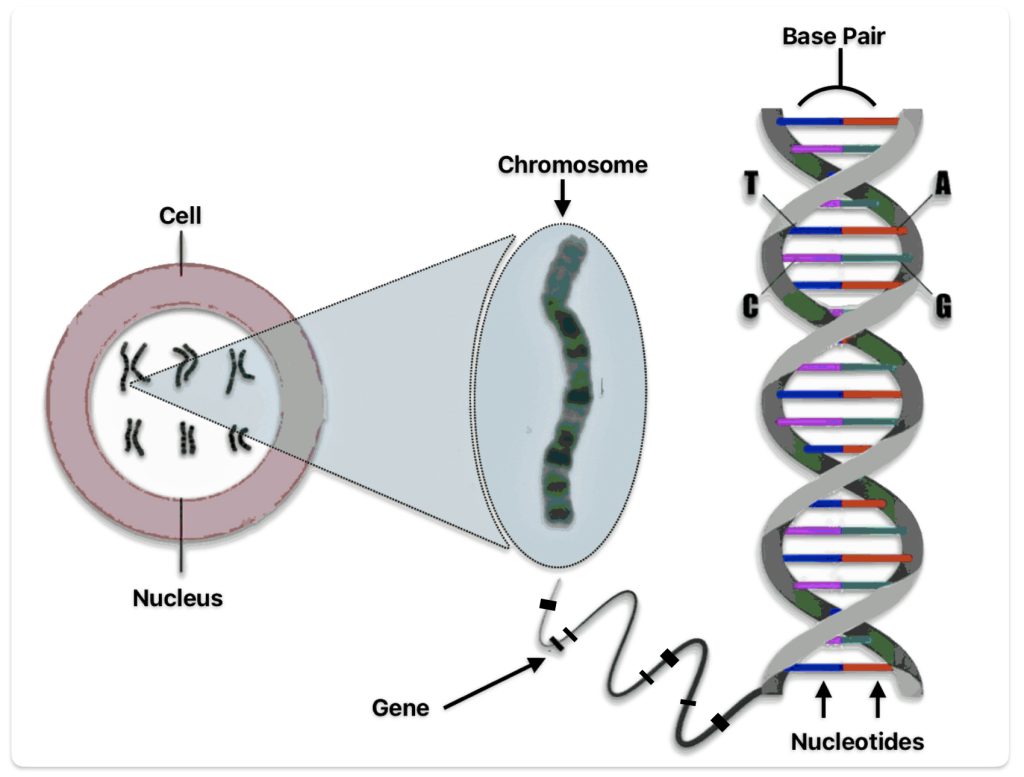
The nucleotides form base pairs and are the cornerstone of genetic testing. (See illustration six.) They are the foundation of the programming language of our genetic code. Whenever a particular base is present on one side of a strand of the DNA, its complementary base is found on the other side. Guanine always pairs with cytosine. Thymine always pairs with adenine. So one can write the DNA sequence by listing the bases along either one of the two sides or strands. When DNA companies perform their tests, they essentially separate the two stands of the helix and use one side of the helix as the template or coding strand when they map out an individual’s DNA results.
Illustration Six: Relationship between Nucleotides, Base Pairs, Chromosomes, Genes, and DNA
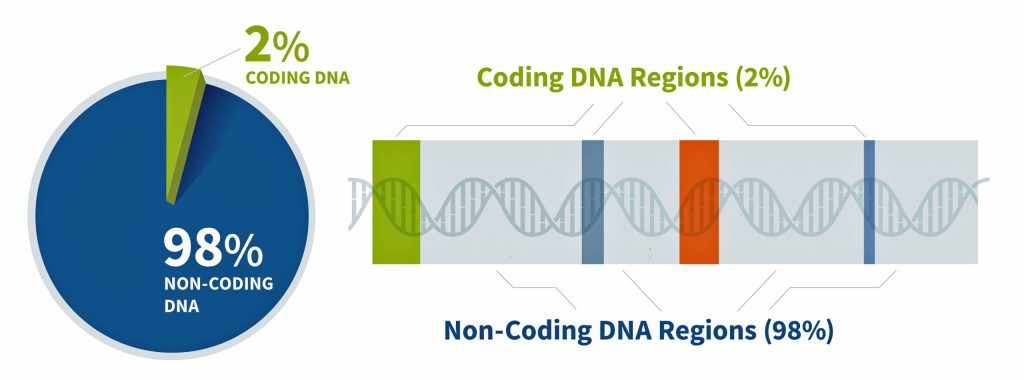
Approximately 2% of our genome encodes proteins – this is where gene strands are located (illustration seven). Coding “gene” DNA makes up only about one to three percent of the human genome, while noncoding DNA comprises approximately 97-99% of our total genetic material. This distribution shows that the vast majority of our genome consists of noncoding sequences. [21]
Genes are the basic unit of inherited DNA and carry information for making proteins, which perform important functions in your body. The coded regions of the genome produce proteins with structural, functional, and regulatory roles in cells and to a larger extent the human body. The remainder of our genome is made of noncoding DNA, sometimes called “junk DNA”, which is a misnomer. It is estimated that between 25% and 80% of non-coding DNA regulates gene expression (e.g. when, where, and for how long a gene is turned on to make a protein). [22] The non-coding DNA that does not regulate gene activity is composed either of deactivated genes that were once useful for our non-human ancestors (like a tail) or parasitic DNA from virus that have entered our genome and replicated themselves hundreds or thousands of times over the generations, or generally serve no purpose in the host organism.
Illustration Seven: Coding and Non-Coding Regions of the Genome
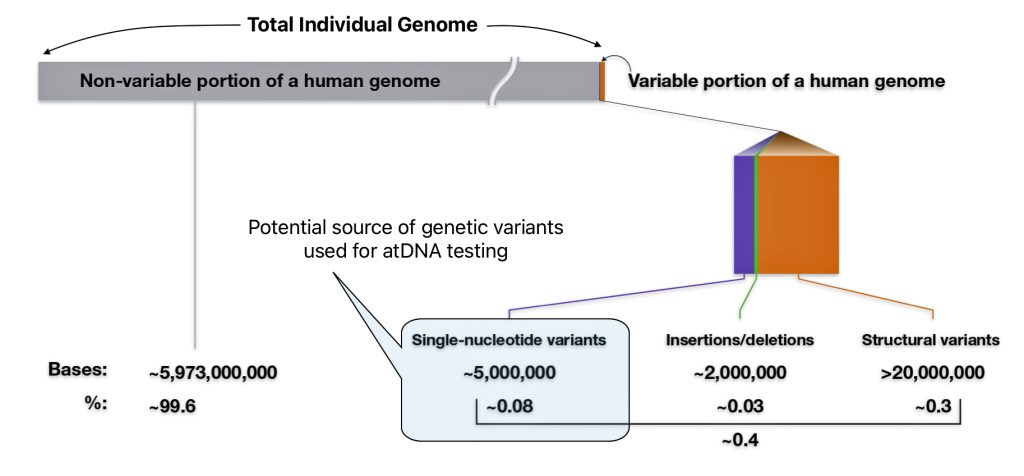
Out of 3.2 billion DNA letters or nucleotides, there are only a ‘handful of places’ on the DNA ribbon that might be different between individuals. Humans share a very high percentage of their DNA. The exact figure is subject to some debate and depends on how it is measured. The commonly cited figure is that humans are 99.9% genetically identical. More recent research suggests a slightly lower, but still very high, level of similarity. Humans share a very high percentage of their DNA – roughly 99.4% to 99.9%. The small differences of 0.1 and 0.6 between individuals are crucial for understanding human diversity and health. [23]
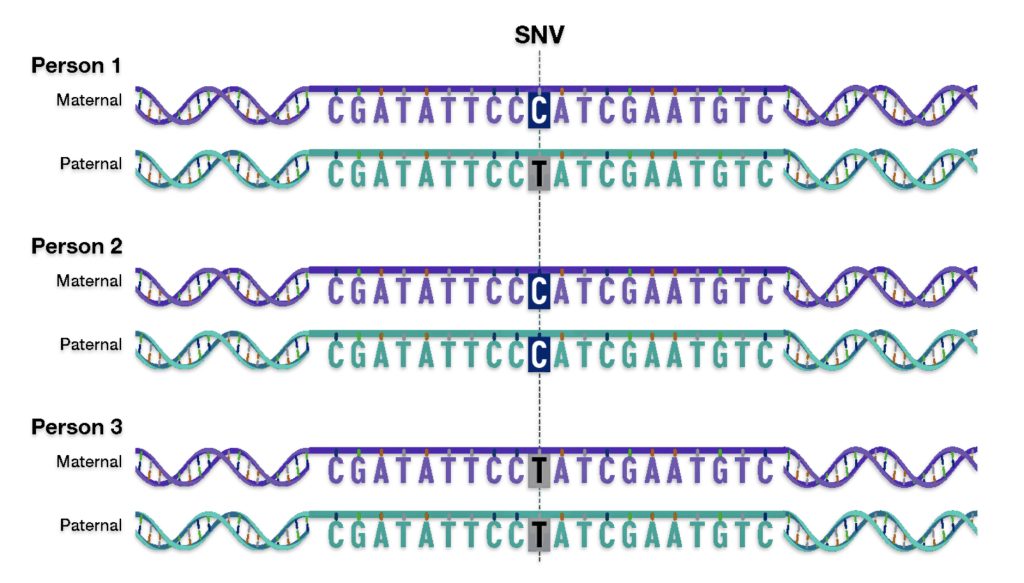
As indicated in illustration eight, there are multiple types of genomic variants that comprise 0.4 percent of the genome.. The smallest genomic variants are known as single-nucleotide variants (SNVs). Each SNV reflects a difference in a single nucleotide (or letter) in the DNA chain. For a given SNV, the DNA letter at that genomic position might be a C in one person but a T in another person as reflected in illustration nine. [24]
Illustration Eight: Potential Sources of Genetic Variants for atDNA Testing
Single-nucleotide variants (SNVs) are differences of one nucleotide at a specific location in the genome. An individual may have different nucleotides at a specific location on each chromosome (getting a different one from each parent), such as with Person 1 in illustration nine. An individual may also have the same nucleotide at such a location on both chromosomes, such as with Person 2 and Person 3 in the illustration.
Illustration Nine: An Example of a single-nucleotide variant (SNV)
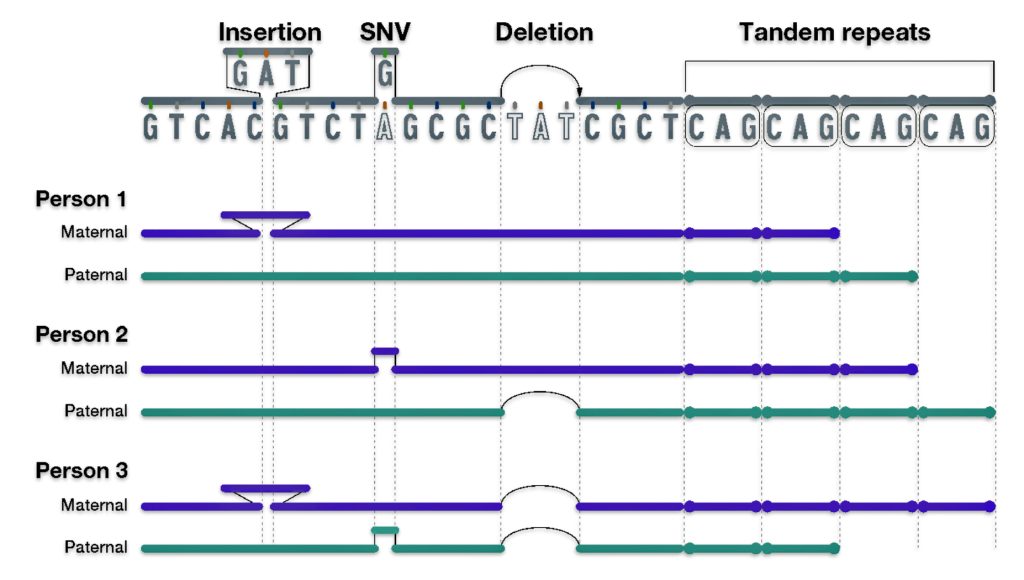
As reflected in illustration ten below, there are also a small group of genetic variants that are called insertions and deletions of nucleotides.
“Insertion/deletion variants reflect extra or missing DNA nucleotides in the genome, respectively, and typically involve fewer than 50 nucleotides. Insertion/deletion variants are less frequent than SNVs but can sometimes have a larger impact on health and disease (e.g., by disrupting the function of a gene that encodes an important protein).” [25]
One of the most common types of insertion/deletion variants are tandem repeats. [26] Tandem Repeats are short stretches of nucleotides that are repeated multiple times and are highly variable among people. Different chromosomes can vary in the number of times such short nucleotide stretches are repeated, ranging from a few times to hundreds of times.
Each person has a collection of different genomic variants. For example, in illustration ten below, Person 1 has an insertion variant; Person 2 has a SNV and deletion variant; and Person 3 has an insertion, SNV, and deletion variant. All three people have different tandem repeats. Different variants can be inherited from different parents as reflected in the illustration.
Illustration Ten: Examples of Other Types of Genetic Variants
As indicated in illustration seven above, the third general type of genomic variations are structural variants (SVs). Structural variants extend beyond small stretches of nucleotides to larger chromosomal regions. These large-scale genomic differences involve at least 50 nucleotides and as many as thousands of nucleotides that have been inserted, deleted, inverted or moved from one part of the genome to another. [27]
Tandem repeats that contain more than 50 nucleotides are considered structural variants. In fact, such large tandem repeats account for nearly half of the structural variants present in human genomes. When a structural variant reflects differences in the total number of nucleotides involved, it is called a copy number variant (CNV). CNVs are distinguished from other structural variants, such as inversions and translocations, because the latter types often do not involve a difference in the total number of nucleotides. [28]
Cornerstone of atDNA Testing: Single Nucleotide Polymorphisms (SNPs)
A subtype of SNVs is the single-nucleotide polymorphism (SNP), pronounced as “snip” for short. To be considered a SNP, a SNV must be present in at least 1% of the human population. As such, a SNP is more common than the rare single-nucleotide differences. [29]
Among the genetic variants, SNPs are relatively common, occurring approximately once every 500-1000 base pairs in the human genome. This translates to about 4 to 5 million SNPs in an individual’s genome. Scientists have found more than 600 million SNPs in populations around the world. The combination of technical feasibility, scientific reliability, and analytical power makes SNPs the optimal choice for autosomal DNA testing in genealogical and ancestry applications. [30]
Ancestry information markers refers to locations in the genome that have varied sequences at that location and the relative abundance of those markers differs based on the continent from which individuals can trace their ancestry. So by using a series of these ancestry information markers, sometimes 20 or 30 more, and genotyping an individual you can determine from the frequency of those markers where their great, great, great, great ancestors may have come from. [31]
SNPs represent natural variations that make individuals unique while being common enough to be reliable DNA test markers. Their high frequency makes them ideal markers for genetic analysis. The vast majority of SNPs have no effect on health or development. SNPs are generally found in the DNA between genes rather than within genes themselves. [32]
While other genetic markers exist, SNPs are preferred ancestry information markers. SNPs are used for genetic testing based on their reliability and accuracy. SNPs are stable genetic markers that are passed down through generations. SNPs offer more detailed information about both recent and ancient ancestry. They also allow for fairly precise ethnic profiling and ancestral location inference.[33]
How atDNA Tests Figure Out Genetic Relationships
In a “Nutshell”: How do DNA companies Figure Out Genetic Relationships

Analyzing SNPs: DNA companies analyze hundreds of thousands of single nucleotide polymorphisms (SNPs) across the 22 autosomal chromosomes. [34]
The results from different atDNA test companies can vary. The variance is based on a number of factors. All major DNA testing companies use equipment that analyze DNA specimens with what are called ‘chips’ that use DNA microarray technology supplied by a company named Illumina. However, different companies use different versions of the Illumina chip and each version tests different sets of SNP (Single Nucleotide Polymorphism) locations.
Illustration Ten: How DNA Microarray Technology Analyzes Autosomal DNA
Source: Bergström, Ann-Louise and Lasse Folkersen , DNA microarray, 15 May 2020, Moving Science, https://movingscience.dk/dna-microarray/
Companies can specify their own “other” locations to be included on their chip. The number of markers tested varies significantly by company. FamilyTreeDNA uses a customized Illumina chip. 23andMe and AncestryDNA use a customized Illumina Global Screening Array (GSA) chip. Living DNA uses an Affymetrix Axiom microarray (Sirius) chip. My Heritage uses an Illumina GSA chip. [35]
Illustration of Illumina Microarray Chips

“Each DNA testing company purchases DNA processing equipment. Illumina is the big dog in this arena. Illumina defines the capacity and structure of each chip. In part, how the testing companies use that capacity, or space on each chip, is up to each company. This means that the different testing companies test many of the same autosomal DNA SNP locations, but not all of the same locations. … This means that each testing company includes and reports many of the same, but also some different SNP locations when they scan your DNA. … In addition to dealing with different file formats and contents from multiple DNA vendors, companies change their own chips and file structure from time to time. In some cases, it’s a forced change by the chip manufacturer. Other times, the vendors want to include different locations or make improvements.” [36]
When DNA companies change DNA chips, a different version of the company’s own file may contain different positions. DNA testing companies have to “fill in the blanks” for compatibility, and they do this using a technique called imputation. Illumina forced their customers to adopt imputation in 2017 when they dropped the capacity of their chip. [37]
Identify Matching Segments: The DNA test software for respective DNA companies compare the SNP data between two individuals to identify segments of DNA that appear to be identical or similar. These matching DNA segments indicate the likelihood of DNA inherited from a common ancestor. [38]
The ability to identify DNA matches between individuals is largely influenced by the size of database tests and the SNPs that were sampled to atDNA tests. As indicated, there are main differences between atDNA tests from various companies (e.g. 23andMe, Ancestry.com, FamilyTree DNA, LivingDNA, MyHeritage) regarding SNPs that are tested and the relative size of their respective database results.
Each company maintains its own proprietary reference databases and matching algorithms. As indicated in table three below, AncestryDNA has a larger customer database (over 20 million) compared to 23andMe (about 12 million). This gives AncestryDNA an advantage for finding genetic relatives.
Table Three: Data Base Size and Number of SNPs Tested by DNA Company in 2024
| DNA Company | Data Base Size of atDNA Test Results | No. of Autosome SNPs Tested |
|---|---|---|
| 23andMe | 14 Million | 630,`132 |
| FamilyTreeDNA | 1.7 million | 612,272 |
| AncestryDNA | 25 million | 637,639 |
| My Heritage | 8.5 million | 576,157 |
| Living DNA | 300,000 | 683,503 |
Measuring Segment Length: The length of matching segments of SNPs is measured in centimorgans (cM). Centimorgans measure the likelihood of genetic recombination between two markers on a chromosome. One centimorgan represents a one percent chance that two genetic markers will be separated by a recombination event in a single generation. This measurement helps geneticists and genealogists estimate how close two individuals are genetically related. [39]
Centimorgans (cM) are a crucial unit of measurement in genetic atDNA testing. It is used to quantify genetic distance and determine relationships between individuals based on shared DNA. The more centimorgans two people share, the more likely they are related. in addition to the number of cMs shared, longer segments generally indicate a closer relationship.
One cM corresponds on the average to about 1 million base pairs in humans. The total human genome is approximately 7400 cM long. A parent-child relationship typically shares about 3400-3700 cM. More distant relatives share fewer cMs. However, there can be overlap in cM ranges for different relationship types, so additional genealogical research is often needed to determine exact relationships.
“(A centiMorgan) is less of a physical distance and more of a measurement of probability. It refers to the DNA segments that you have in common with others and the likelihood of sharing genetic traits. The ends of shared segments are defined by points where DNA swapped between two chromosomes, and the centimorgan is a measure of the probability of getting a segment that large when these swaps occur.” [40]
Chart One: Ranges of Shared centiMorgans with Family
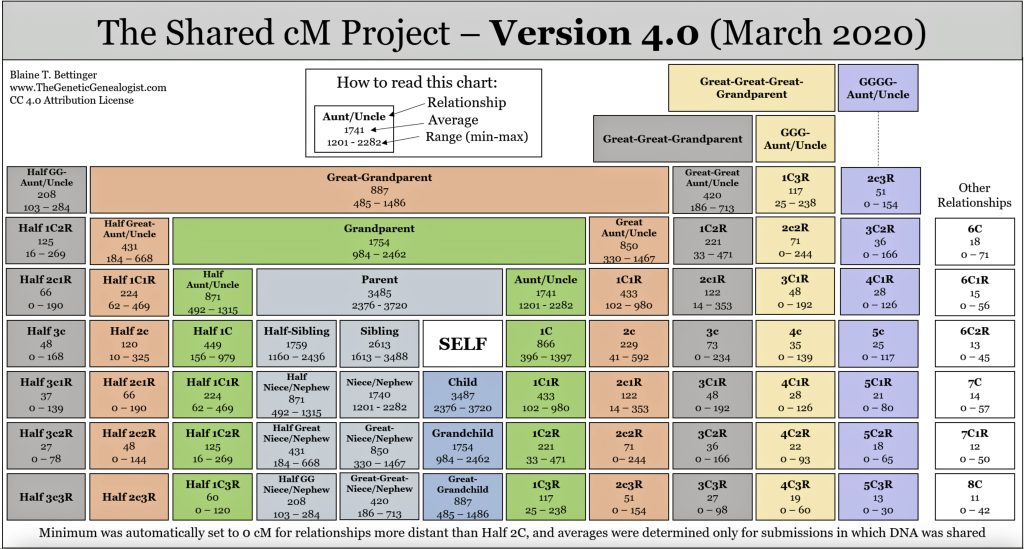
When you take an atDNA test, the testing company compares your DNA to others in their database. The amount of DNA you share with a match is reported in centimorgans. Generally, the more centimorgans you share with someone, the more closely you are related to this other person. Shared centimorgan ranges can often indicate how many generations separate two people. Certain shared cM values can also suggest possible half-sibling or half-first cousin relationships as opposed to full relatives.
Calculating Total Shared DNA: The total amount of shared DNA is calculated by summing up the lengths of all matching segments, typically expressed in cMs or as a percentage of the total amount of shared SNPs sampled. [41]
Applying Thresholds: Each company sets minimum thresholds for segment length and total shared DNA to be considered a match. For example, FamilyTree DNA requires at least one segment of 9 cM or more.
Table Four: Different cM Thresholds for atDNA Matches Across DNA Companies
| DNA Company | Criteria for matching segments |
|---|---|
| 23andMe | 9 cMs and at least 700 SNPs for one half-identical region 5 cMs and 700 SNPs with at least two half-identical regions being shared |
| FamilyTreeDNA | All matching segments must be at least 6 cMs in length. almost all matching segments contain at least 800 SNPs & all matching segments contain at least 600 SNPs. |
| AncestryDNA | 6 cMs per segment before the Timber algorithm is applied and a total of at least 8 cMs after Timber is applied. |
| My Heritage | 8 cM for the first matching segment and at least 6 cMs for the 2nd matching segment; 12 cM for the first matching segment in people whose ancestry is at least 50% Ashkenazi Jewish |
| Living DNA | 9.46 cMs for the first segment |
Relationship Prediction: The amount of shared DNA is compared to expected ranges for different relationships to predict how two people may be related. Close relationships like parent/child or full siblings have very distinct amounts of shared DNA, while more distant relationships have overlapping ranges. [42]
Special Considerations: Some of the DNA companies use phasing algorithms to improve accuracy, especially for analyzing smaller shared segments. Some also apply special algorithms for populations with higher rates of endogamy, like Ashkenazi Jews. [43]
Moving Onward
I imagine all of this makes total sense. I, however, believe, all of this is totally confusing. To walk away with some semblance of understanding, I would focus on the following observations:
- DNA tests can only provide so much information. Traditional genealogical research brings atDNA results into focus. Genetic and traditional research strategies can work hand in hand.
- atDNA tests have the ability to trace living genetic relatives on both sides of your family tree. However, their effectiveness is limited in terms of how many generations back they can effectively provide results.
- While autosomal DNA testing has become increasingly accurate, there are still limitations in the context of estimating genetic relations and finding relatives.
- When looking at atDNA matches, centimorgans (cM) are the key unit of measurement in genetic atDNA testing. It is used to determine relationships between individuals based on shared DNA. The more centimorgans two people share, the more likely they are related. in addition to the number of cMs shared, longer segments generally indicate a closer relationship.
Sources
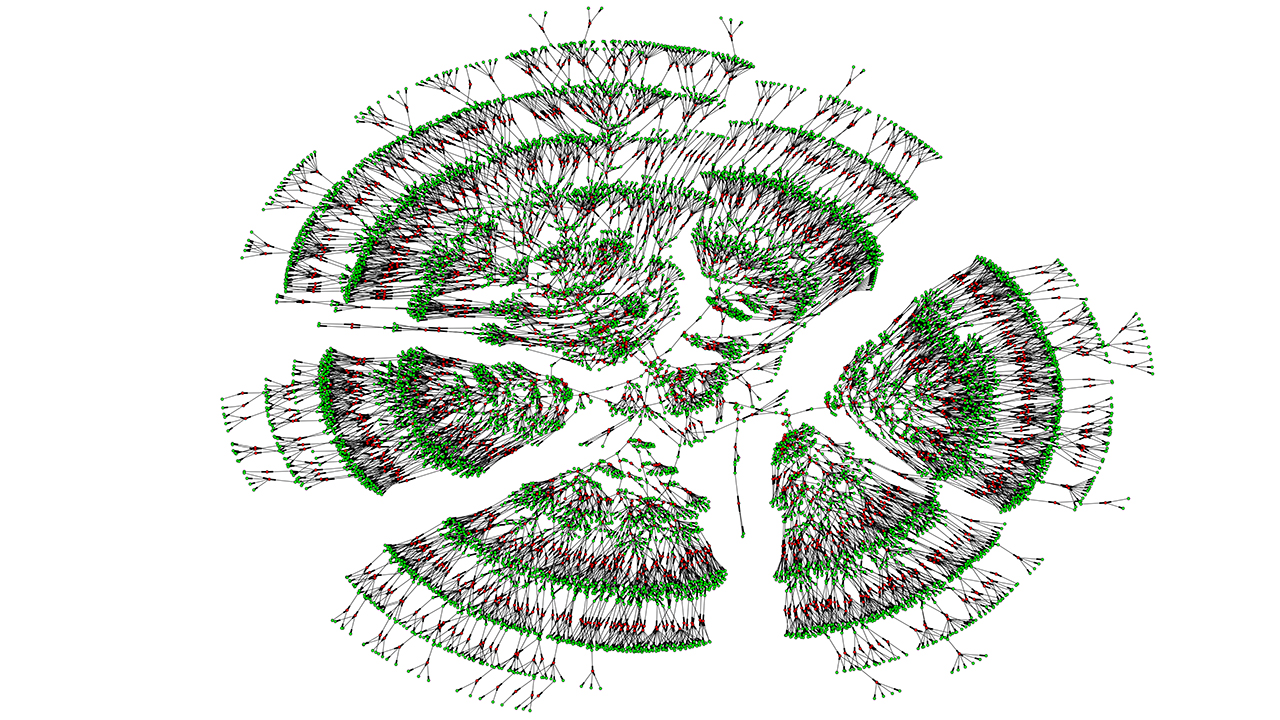
Feature image: The image depicts a branch from a massive family tree that shows 6,000 relatives spanning seven generations. It is part of a study that links 13 million people related by genetics or marriage. Source: Jocelyn Kaiser, Thirteen million degrees of Kevin Bacon: World’s largest family tree shines light on life span, who marries whom, Science, 1 Mar 2018, https://www.science.org/content/article/thirteen-million-degrees-kevin-bacon-world-s-largest-family-tree-shines-light-life-span .
See the original study behind this effort at: Kaplanis J, Gordon A, Shor T, Weissbrod O, Geiger D, Wahl M, Gershovits M, Markus B, Sheikh M, Gymrek M, Bhatia G, MacArthur DG, Price AL, Erlich Y. Quantitative analysis of population-scale family trees with millions of relatives. Science. 2018 Apr 13;360(6385):171-175. doi: 10.1126/science.aam9309. Epub 2018 Mar 1. PMID: 29496957; PMCID: PMC6593158. https://pmc.ncbi.nlm.nih.gov/articles/PMC6593158/
[1] See the following stories:
- Is the Huntington NY Griff(is)(es)(ith) Family Name Welsh? March 17, 2023
- Y-DNA & the Griffis Paternal Line Part Five: Using Y-DNA & Locating a Griff(is)(es)(ith) Relative and Other Leads March 3, 2023
- Y-DNA and the Griffis Paternal Line Part Four: Teasing Out Genetic Distance & Possible Genetic Matches February 24, 2023
- Y-DNA and the Griffis Paternal Line Part Three: The One-Two Punch of Using SNPs and STRs February 23, 2023
- Y-DNA and the Griffis Paternal Line Part Two: Snips and Strings and Other Interesting Things February 6, 2023
- Y-DNA and the Griffis Paternal Line – Part One September 26, 2022
[2] Bettinger, Blaine, Everyone Has Two Family Trees – A Genealogical Tree and a Genetic Tree, 10 Nov 2009, The Genetic Genealogist, https://thegeneticgenealogist.com/2009/11/10/qa-everyone-has-two-family-trees-a-genealogical-tree-and-a-genetic-tree/
Understanding genetic ancestry testing, International Society of Genetic Genealogy Wiki, This page was last edited on on 25 August 2015, https://isogg.org/wiki/Understanding_genetic_ancestry_testing
[3] Human Y-chromosome DNA haplogroup, Wikipedia, This page was last edited on 5 October 2024,, https://en.wikipedia.org/wiki/Human_Y-chromosome_DNA_haplogroup
Human mitochondrial DNA haplogroup, Wikipedia, This page was last edited on 5 October 2024, https://en.wikipedia.org/wiki/Human_mitochondrial_DNA_haplogroup
Rowe, Katy, Genealogy’s Secret Weapon: How Using mtDNA Can Solve Family Mysteries, 10 May 2023, FamilyTreeDNA Blog, https://blog.familytreedna.com/mtdna/
MtDNA testing comparison chart, International Society of Genetic Genealogy Wiki, This page was last edited on 3 September 2023, https://isogg.org/wiki/MtDNA_testing_comparison_chart
Y chromosome DNA tests, International Society of Genetic Genealogy Wiki, This page was last edited on 6 September 2024, https://isogg.org/wiki/Y_chromosome_DNA_tests
Y-DNA STR testing comparison chart, International Society of Genetic Genealogy Wiki, This page was last edited on 11 July 2022, https://isogg.org/wiki/Y-DNA_STR_testing_comparison_chart
Balding, David, Debbie Kennett and Mark Thomas, Understanding genetic ancestry testing, This page was last edited on 25 August 2015, Iternational Society of Genetic Genealogy Wiki, https://isogg.org/wiki/Understanding_genetic_ancestry_testing
Rowe-Schurwanz, Kathy, Using mtDNA for Genealogical Research, Aug 14, 2024, FamilyTreeDNA Blog, https://blog.familytreedna.com/using-mtdna-genealogical-research/
Rowe-Schurwanz, Kathy, How Autosomal DNA Testing Works, June10, 2024, FamilyTreeDNA Blog, https://blog.familytreedna.com/how-autosomal-dna-testing-works/
Unveiling the Power of Big Y-700: Unraveling the Journey and Advantages, Oct 21, 2022, FamilyTreeDNA Blog, https://blog.familytreedna.com/big-y-700/
Mitochondrial Eve, Wikipedia, This page was last edited on 18 September 2024, https://en.wikipedia.org/wiki/Mitochondrial_Eve
Y-chromosomal Adam, Wikipedia, This page was last edited on 19 September 2024, https://en.wikipedia.org/wiki/Y-chromosomal_Adam
[4] Newton, Maud, America’s Ancestry Craze: Making sense of our family-tree obsession, June 2014, Harper’s Magazine, https://harpers.org/archive/2014/06/americas-ancestry-craze/
[5] Jorde LB, Bamshad MJ. Genetic Ancestry Testing: What Is It and Why Is It Important? JAMA. 2020 Mar 17;323(11):1089-1090. doi:10.1001/jama.2020.0517 PMID: 32058561; PMCID: PMC8202415 https://www.ncbi.nlm.nih.gov/pmc/articles/PMC8202415/
[6] Antonio Regalodo, More than 26 million people have taken an at-home ancestry test, MIT Technology Review, 11 Feb 2019, https://www.technologyreview.com/2019/02/11/103446/more-than-26-million-people-have-taken-an-at-home-ancestry-test/
Covering Your Bases: Introduction to Autosomal DNA Coverage, Legacy Tree Genealogists, https://www.legacytree.com/blog/introduction-autosomal-dna-coverage
DNA Geek, Family DNA Tests for Ancestry & Genealogy, Navigating the World of DNA,
[7] Has the consumer DNA test boom gone bust?, Feb 20, 2020, updated Jul 28, 2024, Advisory Board, https://www.advisory.com/daily-briefing/2020/02/20/dna-tests
[8] Ibid
[9] Krimsky Sheldon, The Business of DNA Ancestry, in: Understanding DNA Ancestry. Understanding Life. Cambridge University Press; 2021, Pages 8-16.
Molla, Rami, Why DNA tests are suddenly unpopular, 13 Feb 2020, Vox, https://www.vox.com/recode/2020/2/13/21129177/consumer-dna-tests-23andme-ancestry-sales-decline#
Spiers, Caroline, Keeping It in the Family: Direct-to-Consumer Genetic Testing and the Fourth Amendment, Houston Law Review, Vol 59, Issue 5, May 23 2020, https://houstonlawreview.org/article/36547-keeping-it-in-the-family-direct-to-consumer-genetic-testing-and-the-fourth-amendment
Has the consumer DNA test boom gone bust?, Updated 28 Jul 2023, Advisory Board, https://www.advisory.com/daily-briefing/2020/02/20/dna-tests
Linder, Emmett, As 23andMe Struggles, Concerns Surface About Its Genetic Data, 5 Oct 2024, New York Times, https://www.nytimes.com/2024/10/05/business/23andme-dna-bankrupt.html
Estes, Roberta, DNA Testing Sales Decline: Reason and Reasons, 11 Feb 2020, DNAeXplained – Genetic Genealogy Blog, https://dna-explained.com/2020/02/11/dna-testing-sales-decline-reason-and-reasons/
[10] Fish, Eric, The Sordid Saga of 23andMe, 21 Oct 2024, All Science Great & Small, https://allscience.substack.com/p/the-sordid-saga-of-23andme
Prictor, Megan, Millions of People’s DNA in Doubt as 23andMe Faces Bankruptcy, 21 Oct 2024, Science Alert, https://www.sciencealert.com/millions-of-peoples-dna-in-doubt-as-23andme-faces-bankruptcy
Linder, Emmett, As 23andMe Struggles, Concerns Surface About Its Genetic Data, 5 Oct 2024, New York Times, https://www.nytimes.com/2024/10/05/business/23andme-dna-bankrupt.html
Allyn, Bobby, 23andMe is on the brink. What happens to all its DNA data?, NPR, https://www.npr.org/2024/10/03/g-s1-25795/23andme-data-genetic-dna-privacy
23andMe Facing Bankruptcy, FoxLocal 26, , https://youtu.be/ZfBOCxbWAeY
[10a] Estes, Roberta, 23andMe Trouble – Step-by-Step Instructions to Preserve Your Data and Matches, 19 Sep 2024, DNAeXplained – Genetic Genealogy, https://dna-explained.com/2024/09/19/23andme-trouble-step-by-step-instructions-to-preserve-your-data-and-matches/
[11] A karyotype is a visual representation of an individual’s complete set of chromosomes, displaying their number, size, and structure, typically arranged in pairs and ordered by size.
“A karyotype is the general appearance of the complete set of chromosomes in the cells of a species or in an individual organism, mainly including their sizes, numbers, and shapes. … A karyogram or idiogram is a graphical depiction of a karyotype, wherein chromosomes are generally organized in pairs, ordered by size and position of centromere for chromosomes of the same size.”
Karotype, Wikipedia, This page was last edited on 12 September 2024, https://en.wikipedia.org/wiki/Karyotype
Karyotype, Wikipedia, This page was last edited on 17 October 2024,, https://en.wikipedia.org/wiki/Karyotype
Dutra, Ameria, Karyotype, National Genome Human Genome Research Institute, https://www.genome.gov/genetics-glossary/Karyotype
Karyotype, ScienceDirect, definition and discussion is from from Antonie D. Kline and Ethylin Wang Jabs, eds., Genomics in the Clinic, 2024, Shen Gu, Bo Yuan, Ethylin Wang Jabs, Christine M. Eng , Chapter 2 – Basic Principles of Genetics and Genomics, Pages 5-28 , https://www.sciencedirect.com/topics/biochemistry-genetics-and-molecular-biology/karyotype
Shen Gu, Bo Yuan, Ethylin Wang Jabs, Christine M. Eng, Chapter 2 – Basic Principles of Genetics and Genomics, Editor(s): Antonie D. Kline, Ethylin Wang Jabs, Genomics in the Clinic, Academic Press, 2024, Pages 5-28
[12] Autosomes are the non-sex chromosomes found in the cells of organisms. Autosomes are any chromosomes that are not sex chromosomes (allosomes). In humans, there are 22 pairs of autosomes, numbered from 1 to 22. They come in identical pairs in both males and females. They are numbered based on size, shape, and other properties. They contain genes that control the inheritance of all traits except sex-linked ones.
[13] Recombination is a process by which pieces of DNA are broken and recombined to produce new combinations of nucleotides or alleles. Recombination primarily happens between homologous chromosomes, which are paired chromosomes with similar genetic information, allowing for the exchange of corresponding DNA segments.
During meiosis, when homologous chromosomes pair up, a process called “crossing over” occurs where DNA strands break and rejoin, swapping genetic material between the chromosomes. This recombination process creates genetic diversity at the level of genes that reflects differences in the DNA sequences of different organisms.
Recombination, Scitable by nature Education, Nature, 2014, https://www.nature.com/scitable/definition/recombination-226/
Genetic recombination, Wikipedia, This page was last edited on 5 October 2024, https://en.wikipedia.org/wiki/Genetic_recombination
Alberts B, Johnson A, Lewis J, et al., General Recombination, in The cell, New York: Garland Science; 2002. https://www.ncbi.nlm.nih.gov/books/NBK26898/
[14] Autosomal DNA Statistics, International Society of Genetic Genealogy Wiki, Page was last edited 4 August 2022, Page accessed 14 Aug 2022, https://isogg.org/wiki/Autosomal_DNA_statistics
Nicole Dyer, Charts for Understanding DNA Inheritance, 14 Aug 2019, Family Locket, Page accessed 10 Oct 2021, https://familylocket.com/charts-for-understanding-dna-inheritance/
[15] Meiosis is a type of cell division that reduces the number of chromosomes in the parent cell by half and produces four gamete cells. This process is required to produce egg and sperm cells for sexual reproduction.
Meiosis, 2014, Scitable by Nature Education, Nature, https://www.nature.com/scitable/definition/meiosis-88/
Gilchrist, Daniel, Meiosis, National Human Genome Research Institute, https://www.genome.gov/genetics-glossary/Meiosis
Meiosis, Wikipedia, This page was last edited on 22 August 2024, https://en.wikipedia.org/wiki/Meiosis
[16] What are reduced penetrance and variable expressivity?, MedlinePlus, https://medlineplus.gov/genetics/understanding/inheritance/penetranceexpressivity/
Miko, Iiona, Phenotype variability: penetrance and expressivity. Nature Education 1(1):137 , 2008, https://www.nature.com/scitable/topicpage/phenotype-variability-penetrance-and-expressivity-573/
Expressivity (genetics), Wikipedia, This page was last edited on 9 October 2024, https://en.wikipedia.org/wiki/Expressivity_(genetics)
[17] Average Percent DNA Shared Between Relatives, 23andMe Customer Care, Tools, 23andMe, https://customercare.23andme.com/hc/en-us/articles/212170668-Average-Percent-DNA-Shared-Between-Relatives
Autosomal Statistics, International Society of Genetic Genealogy Wiki, This page was last edited on 17 October 2022, https://isogg.org/wiki/Autosomal_DNA_statistics
[18] “The genome is the entire set of DNA instructions found in a cell. In humans, the genome consists of 23 pairs of chromosomes located in the cell’s nucleus, as well as a small chromosome in the cell’s mitochondria. A genome contains all the information needed for an individual to develop and function.“
Human Genomic Variation, Fact Sheet, National Human Genome Research Institute, 1 Feb 2023, https://www.genome.gov/about-genomics/educational-resources/fact-sheets/human-genomic-variation
[19] Fundamental Concepts of Genetics and about the Human Genome, Eupedia, page accessed 3 Feb 2021, https://www.eupedia.com/genetics/human_genome_and_genetics.shtml
Sheldon Krimsky, Understanding DNA Ancestry, Cambridge: Cambridge University , 2022, Page 18
Human Genomic Variation, Fact Sheet, National Human Genome Research Institute, 1 Feb 2023, https://www.genome.gov/about-genomics/educational-resources/fact-sheets/human-genomic-variation
[20] Nucleotide, National Cancer Institute, https://www.cancer.gov/publications/dictionaries/genetics-dictionary/def/nucleotide
Nucleotide, Wikipedia, This page was last edited on 3 September 2024, https://en.wikipedia.org/wiki/Nucleotide
Brody, Lawrence, Nucleotide, National Human Genome Research Institute, 1 Nov 2024, https://www.genome.gov/genetics-glossary/Nucleotide
[21] Non-Coding DNA, AncestryDNA Learning Hub, 16 Aug 2016, https://www.ancestry.com/c/dna-learning-hub/non-coding-dna
What is Noncoding DNA?, MedlinePlus, https://medlineplus.gov/genetics/understanding/basics/noncodingdna/
[22] Non-Coding DNA, AncestryDNA Learning Hub, https://www.ancestry.com/c/dna-learning-hub/junk-dna
Ohno, Susumu. “So Much ‘Junk’ DNA in Our Genome.” Brookhaven Symposium on Biology, Volume 23, 1972: 366-370.
Zhang F, Lupski JR. Non-coding genetic variants in human disease. Hum Mol Genet. 2015 Oct 15;24(R1):R102-10. doi: 10.1093/hmg/ddv259. Epub 2015 Jul 7. PMID: 26152199; PMCID: PMC4572001 https://pmc.ncbi.nlm.nih.gov/articles/PMC4572001/
Peña-Martínez EG, Rodríguez-Martínez JA. Decoding Non-coding Variants: Recent Approaches to Studying Their Role in Gene Regulation and Human Diseases. Front Biosci (Schol Ed). 2024 Mar 1;16(1):4. doi: 10.31083/j.fbs1601004. PMID: 38538340; PMCID: PMC11044903 https://pmc.ncbi.nlm.nih.gov/articles/PMC11044903/
Malte Spielmann, Stefan Mundlos, Looking beyond the genes: the role of non-coding variants in human disease, Human Molecular Genetics, Volume 25, Issue R2, 1 October 2016, Pages R157–R165, https://doi.org/10.1093/hmg/ddw205
Vitsios, D., Dhindsa, R.S., Middleton, L. et al. Prioritizing non-coding regions based on human genomic constraint and sequence context with deep learning. Nat Commun 12, 1504 (2021). https://doi.org/10.1038/s41467-021-21790-4
Ellingford, J.M., Ahn, J.W., Bagnall, R.D. et al. Recommendations for clinical interpretation of variants found in non-coding regions of the genome. Genome Med 14, 73 (2022). https://doi.org/10.1186/s13073-022-01073-3
[23] The 1000 Genomes Project Consortium. A global reference for human genetic variation. Nature 526, 68–74 (2015). https://doi.org/10.1038/nature15393, https://www.nature.com/articles/nature15393#citeas
Human Genomic Variation, National Human Genome Research Institute, https://www.genome.gov/about-genomics/educational-resources/fact-sheets/human-genomic-variation
For the 99.9 percent figure, see for example: Krimsky, Sheldon, Understanding DNA Ancestry, Cambridge, Cambridge University Press, 2022, Page 18
[22] Zou H, Wu LX, Tan L, Shang FF, Zhou HH. Significance of Single-Nucleotide Variants in Long Intergenic Non-protein Coding RNAs. Front Cell Dev Biol. 2020 May 25;8:347. doi: 10.3389/fcell.2020.00347. PMID: 32523949; PMCID: PMC7261909
The Order of Nucleotides in a Gene Is Revealed by DNA Sequencing, Scitable, Nature Education, https://www.nature.com/scitable/topicpage/the-order-of-nucleotides-in-a-gene-6525806/
single nucleotide variant, National Cancer Institute, https://www.cancer.gov/publications/dictionaries/genetics-dictionary/def/single-nucleotide-variant
Wright, A.F. (2005). Genetic Variation: Polymorphisms and Mutations. In eLS, (Ed.). https://doi.org/10.1038/npg.els.0005005
Single-nucleotide polymorphism, Wikipedia, This page was last edited on 29 September 2024, https://en.wikipedia.org/wiki/Single-nucleotide_polymorphism
SNVs vs. SNPs, CD Genomics, https://www.cd-genomics.com/resource-snvs-vs-snps.html
[23] Human Genomic Variation, Fact Sheet, National Human Genome Research Institute, 1 Feb 2023, https://www.genome.gov/about-genomics/educational-resources/fact-sheets/human-genomic-variation
[24] Ichikawa, K., Kawahara, R., Asano, T. et al. A landscape of complex tandem repeats within individual human genomes. Nat Commun 14, 5530 (2023). https://doi.org/10.1038/s41467-023-41262-1
Tandem Repeat, Wikipedia, This page was last edited on 12 July 2024, https://en.wikipedia.org/wiki/Tandem_repeat
Myers, P., Tandem repeats and morphological variation. Nature Education 1(1):1, 2007, http://scienceblogs.com/pharyngula/2007/10/tandem_repeats_and_morphologic.php
Usdin K. The biological effects of simple tandem repeats: lessons from the repeat expansion diseases. Genome Res. 2008 Jul;18(7):1011-9. doi: 10.1101/gr.070409.107. PMID: 18593815; PMCID: PMC3960014. https://pmc.ncbi.nlm.nih.gov/articles/PMC3960014/
Ichikawa, K., Kawahara, R., Asano, T. et al. A landscape of complex tandem repeats within individual human genomes. Nat Commun 14, 5530 (2023). https://doi.org/10.1038/s41467-023-41262-1
Mitsuhashi, S., Frith, M.C., Mizuguchi, T. et al. Tandem-genotypes: robust detection of tandem repeat expansions from long DNA reads. Genome Biol 20, 58 (2019). https://doi.org/10.1186/s13059-019-1667-6
Sequencing 101: Tandem repeats, 22 Nov 2023, PacBio, https://www.pacb.com/blog/sequencing-101-tandem-repeats/
Kai Zhou, Abram Aertsen, Chris W. Michiels, The role of variable DNA tandem repeats in bacterial adaptation, FEMS Microbiology Reviews, Volume 38, Issue 1, January 2014, Pages 119–141, https://doi.org/10.1111/1574-6976.12036
Fan H, Chu JY. A brief review of short tandem repeat mutation. Genomics Proteomics Bioinformatics. 2007 Feb;5(1):7-14. doi: 10.1016/S1672-0229(07)60009-6. PMID: 17572359; PMCID: PMC5054066. https://pmc.ncbi.nlm.nih.gov/articles/PMC5054066/
[25] Structural variation, Wikipedia, This page was last edited on 30 August 2024, https://en.wikipedia.org/wiki/Structural_variation
Scott AJ, Chiang C, Hall IM. Structural variants are a major source of gene expression differences in humans and often affect multiple nearby genes. Genome Res. 2021 Dec;31(12):2249-2257. doi: 10.1101/gr.275488.121. Epub 2021 Sep 20. PMID: 34544830; PMCID: PMC8647827 https://pmc.ncbi.nlm.nih.gov/articles/PMC8647827/
Feuk, L., Carson, A. & Scherer, S. Structural variation in the human genome. Nat Rev Genet 7, 85–97 (2006). https://doi.org/10.1038/nrg1767
[26] CNVs are typically defined as DNA segments that are: larger than 1,000 base pairs (1 kilobase); usually less than 5 megabases in length; and can include both duplications (additional copies) and deletions (losses) of genetic material.
CNVs are remarkably common in human genomes. They account for approximately 5 to 9.5% of the human genome. They affect more base pairs than other forms of mutation when comparing two human genomes. They play crucial roles in evolution, population diversity, and disease development.
Copy number variation, Wikipedia, This page was last edited on 24 September 2024, https://en.wikipedia.org/wiki/Copy_number_variation
Pös O, Radvanszky J, Buglyó G, Pös Z, Rusnakova D, Nagy B, Szemes T. DNA copy number variation: Main characteristics, evolutionary significance, and pathological aspects. Biomed J. 2021 Oct;44(5):548-559. doi: 10.1016/j.bj.2021.02.003. Epub 2021 Feb 13. PMID: 34649833; PMCID: PMC8640565 https://pmc.ncbi.nlm.nih.gov/articles/PMC8640565/
Eichler, E. E. Copy Number Variation and Human Disease. Nature Education 1(3):1, 2008, https://www.nature.com/scitable/topicpage/copy-number-variation-and-human-disease-741737/
What are copy number variants?, 12 Aug 2020, Genomics Education Programme, https://www.genomicseducation.hee.nhs.uk/blog/what-are-copy-number-variants/
Clancy, S. Copy number variation. Nature Education 1(1):95, 2008, https://www.nature.com/scitable/topicpage/copy-number-variation-445/
Copy number variant, National Cancer Institute, https://www.cancer.gov/publications/dictionaries/genetics-dictionary/def/copy-number-variant
Copy Number Variation (CNV), 3 Nov 2024, National Human Genome Research Institute, https://www.genome.gov/genetics-glossary/Copy-Number-Variation
[29] Several approaches are used to determine if an SNV meets the one percent population frequency threshold:
- Large-Scale Population Studies: Projects like the 1000 Genomes Project have sequenced thousands of individuals across multiple populations to identify and validate SNPs
- A number of detection technologies are used such as real-time PCR, the use of microarrays, and Next-generation sequencing (NGS).
See for example:
The 1000 Genomes Project Consortium. A global reference for human genetic variation. Nature 526, 68–74 (2015). https://doi.org/10.1038/nature15393
Patricia M Schnepp, Mengjie Chen, Evan T Keller, Xiang Zhou, SNV identification from single-cell RNA sequencing data, Human Molecular Genetics, Volume 28, Issue 21, 1 November 2019, Pages 3569–3583, https://doi.org/10.1093/hmg/ddz207
Telenti A, Pierce LC, Biggs WH, di Iulio J, Wong EH, Fabani MM, Kirkness EF, Moustafa A, Shah N, Xie C, Brewerton SC, Bulsara N, Garner C, Metzker G, Sandoval E, Perkins BA, Och FJ, Turpaz Y, Venter JC. Deep sequencing of 10,000 human genomes. Proc Natl Acad Sci U S A. 2016 Oct 18;113(42):11901-11906. doi: 10.1073/pnas.1613365113. Epub 2016 Oct 4. PMID: 27702888; PMCID: PMC5081584. https://pmc.ncbi.nlm.nih.gov/articles/PMC5081584/
SNVs vs. SNPs, CD Genomics, https://www.cd-genomics.com/resource-snvs-vs-snps.html
Efficiently detect single nucleotide polymorphisms and variants, Illumina, https://www.illumina.com/techniques/popular-applications/genotyping/snp-snv-genotyping.html
[30] What are single nucleotide polymorphisms (SNPs)?, MedlinePlus, https://medlineplus.gov/genetics/understanding/genomicresearch/snp/
SNP, IMS Riken Center for Integrative Medical Sciences, https://www.ims.riken.jp/english/glossary/genome.php
The 1000 Genomes Project Consortium. A global reference for human genetic variation.Nature 526, 68–74 (2015). https://doi.org/10.1038/nature15393
[31] Ancestry Information Markers, National Human Genome Research Institute, https://www.genome.gov/genetics-glossary/Ancestry-informative-Markers
Joon-Ho You, Janelle S. Taylor, Karen L. Edwards, Stephanie M. Fullerton, What are our AIMs? Interdisciplinary Perspectives on the Use of Ancestry Estimation in Disease Research, National Library of Medicine, 2012 Nov 5. doi: 10.1080/21507716.2012.717339
Huckins, L., Boraska, V., Franklin, C. et al. Using ancestry-informative markers to identify fine structure across 15 populations of European origin. Eur J Hum Genet 22, 1190–1200 (2014). https://doi.org/10.1038/ejhg.2014.1
[32] What are single nucleotide polymorphisms (SNPs)?, MedlinePlus, https://medlineplus.gov/genetics/understanding/genomicresearch/snp/
[33] AIMs are single-nucleotide polymorphisms (SNPs) that show substantially different frequencies between populations from different geographical regions15. These genetic variations can be used to estimate the geographical origins of a person’s ancestors, typically by continent of origin.
AIMs are found within the approximately 15 million SNP sites in human DNA (about 0.4% of total base pairs). They are often traced to the Y chromosome, Mitochondrial DNA, and Autosomal regions.
AIMs can distinguish between major continental populations (Africa, Asia, Europe). They require multiple markers working together (typically 20-30 or more) for accurate ancestry determination. They can identify fine population structure within continents using larger marker sets.
The effectiveness of AIMs depends on the number of markers used:
- 40-80 markers can identify five broad continental clusters;
- 128 markers can characterize samples into 8 broad continental groups; and
- Larger sets (>46,000 markers) can identify detailed subpopulation structure
Hinkley, Ellen, DNA Testing Choice, 16 Dec 2016, https://dnatestingchoice.com/en-us/news/what-is-an-autosomal-dna-test
Lamiaa Mekhfi, Bouchra El Khalfi, Rachid Saile, Hakima Yahia, and Abdelaziz Soukri, The interest of informative ancestry markers (AIM) and their fields of application, , BIO Web of Conferences 115, 07003 (2024),https://doi.org/10.1051/bioconf/202411507003
Huckins, L., Boraska, V., Franklin, C. et al. Using ancestry-informative markers to identify fine structure across 15 populations of European origin. Eur J Hum Genet 22, 1190–1200 (2014). https://doi.org/10.1038/ejhg.2014.1
Ancestry Information Markers, National Human Genome Research Institute, https://www.genome.gov/genetics-glossary/Ancestry-informative-Markers
Ancestry-informative marker, Wikipedia, This page was last edited on 14 August 2024, https://en.wikipedia.org/wiki/Ancestry-informative_marker
[34] Autosomal DNA Statistics, International Society of Genetic Genealogy Wiki, This page was last edited on 17 October 2022, https://isogg.org/wiki/Autosomal_DNA_statistics
Autosomal SNP comparison chart, International Society of Genetic Genealogy Wiki, This page was last edited on 29 January 2024, https://isogg.org/wiki/Autosomal_SNP_comparison_chart
DNA Structure and the Testing Process, FamilyTreeDNA Help Center, https://help.familytreedna.com/hc/en-us/articles/6189190247311-DNA-Structure-and-the-Testing-Process
Catherine A. Ball, Mathew J Barber, Jake Byrnes, Peter Carbonetto, Kenneth G. Chahine, Ross E. Curtis, Julie M. Granka, Eunjung Han, Eurie L. Hong, Amir R. Kermany, Natalie M. Myres, Keith Noto, Jianlong Qi, Kristin Rand, Yong Wang and Lindsay Willmore, AncestryDNA Matching White Paper, 31 Mar 2016, AncestryDNA, https://www.ancestry.com/cs/dna-help/matches/whitepaper; PDF: https://www.ancestry.com/dna/resource/whitePaper/AncestryDNA-Matching-White-Paper.pdf
Autosomal DNA match thresholds, International Society of Genetic Genealogy Wiki, This page was last edited on 31 August 2024, https://isogg.org/wiki/Autosomal_DNA_match_thresholds
Daniel Kling, Christopher Phillips, Debbie Kennett, Andreas Tillmar,
Investigative genetic genealogy: Current methods, knowledge and practice, Forensic Science International: Genetics, Volume 52, 2021, https://doi.org/10.1016/j.fsigen.2021.102474
Davis DJ, Challis JH. Automatic segment filtering procedure for processing non-stationary signals. J Biomech. 2020 Mar 5;101:109619. doi: 10.1016/j.jbiomech.2020.109619. Epub 2020 Jan 9. PMID: 31952818.
The Order of Nucleotides in a Gene Is Revealed by DNA Sequencing, Scitable, Nature Education, https://www.nature.com/scitable/topicpage/the-order-of-nucleotides-in-a-gene-6525806/
[35] The Illumina Global Screening Array (GSA) is a customizable genotyping microarray platform. Its base configuration
- Contains approximately 654,000 fixed markers spanning the human genome;
- Supports 24 samples per array in standard format;
- Requires 200 ng DNA input;
- Achieves call rates greater than 99% and reproducibility greater than 99.9%; and
- Allows addition of up to 100,000 custom markers
Illumina microarray solutions, Illumina, https://www.illumina.com/techniques/microarrays.html
Efficiently detect single nucleotide polymorphisms and variants, Illumina, https://www.illumina.com/techniques/popular-applications/genotyping/snp-snv-genotyping.html
Custom design tools for genotyping any variant, in any species, Illumina, https://www.illumina.com/techniques/popular-applications/genotyping/custom-genotyping.html
Infinium™ Global Screening Array-24 v3.0 BeadChip, Illumina , https://www.illumina.com/content/dam/illumina-marketing/documents/products/datasheets/infinium-global-screening-array-data-sheet-370-2016-016.pdf
Infinium Global Screening Array-24 Kit, Illumina, https://www.illumina.com/products/by-type/microarray-kits/infinium-global-screening.html
Efficiently detect single nucleotide polymorphisms and variants, Illumina, https://www.illumina.com/techniques/popular-applications/genotyping/snp-snv-genotyping.html
Custom design tools for genotyping any variant, in any species, Illumina, https://www.illumina.com/techniques/popular-applications/genotyping/custom-genotyping.html
[36] Estes, Roberta, Comparing DNA Results – Different Tests at the Same Testing Company, 5 Sep 2017, DNAeXplained – Genetic Genealogy, https://dna-explained.com/2023/05/18/comparing-dna-results-different-tests-at-the-same-testing-company/
[37] Estes, Roberta, Concepts -Imputation, 5 Sep 2017, DNAeXplained – Genetic Genealogy, https://dna-explained.com/2017/09/05/concepts-imputation/
Illumina microarray solutions, Illumina, https://www.illumina.com/techniques/microarrays.html
Efficiently detect single nucleotide polymorphisms and variants, Illumina, https://www.illumina.com/techniques/popular-applications/genotyping/snp-snv-genotyping.html
[38] See for example: Our Autosomal DNA Test (Family Finder™), FamilyTreeDNA HelpCenter, https://help.familytreedna.com/hc/en-us/articles/4411203169679-Our-Autosomal-DNA-Test-Family-Finder
[39] Different DNA testing companies use centimorgans (cM) in slightly different ways when reporting matches and relationships:
- Matching thresholds: Companies set different minimum thresholds for reporting matches. For example: AncestryDNA currently uses a threshold of 8 cM; 23andMe uses 7 cM and at least 700 SNPs for the first matching segment; and MyHeritage uses 8 cM.
- Algorithms and filtering: Companies use proprietary algorithms to filter and process the raw DNA data. AncestryDNA uses algorithms called Timber and Underdog to phase data and filter out high-frequency segments. Other companies may use different methods, leading to variations in reported shared cM.
- Total cM calculations: The total amount of cM a person has can vary between companies. 23andMe reports about 7,440 cM total and AncestryDNA seems to use around 6,800-7,000 cM total.
- Reporting of segments: Some companies like 23andMe and FamilyTreeDNA provide detailed segment data. AncestryDNA does not show specific segment information.
- Confidence levels: Companies may assign different confidence levels or relationship probabilities based on shared cM. For example, AncestryDNA previously used confidence scores like “Extremely High” for cMs greater than 60.
- Handling of small segments: Companies differ in how they handle very small matching segments, with some including segments as small as one cM and others excluding anything below their threshold.
These differences in methodologies can result in variations in reported shared cM and relationship estimates between companies for the same pair of individuals. This is why matches and relationship predictions may not be identical across different testing companies.
Centimorgan, Wikipedia, This page was last edited on 1 May 2024, https://en.wikipedia.org/wiki/Centimorgan
What’s the difference between shared centimorgans and shared segments?, 11 Nov 2019, The Tech Initiative, https://www.thetech.org/ask-a-geneticist/articles/2019/centimorgans-vs-shared-segments/
centiMorgan, Internatioal Society of Genetic Genealogy, This page was last edited on 15 August 2024, https://isogg.org/wiki/CentiMorgan
[40] Hansen, Annelie, Untangling the Centimorgans on Your DNA Test, FamilySearch Blog, https://www.familysearch.org/en/blog/centimorgan-chart-understanding-dna
Green Dragon Genealogy, Yes, but what EXACTLY is a centiMorgan?, 19 Sep 2021, Green Dragon Genealogy,https://greendragongenealogy.co.uk/dna/yes-but-what-exactly-is-a-centimorgan/
[41] Autosomal DNA match thresholds, International Society of Genetic Genealogy Wiki, This page was last edited on 31 August 2024, https://isogg.org/wiki/Autosomal_DNA_match_thresholds
[42] Autosomal DNA Statistics, International Society of Genetic Genealogy Wiki, This page was last edited on 17 October 2022, https://isogg.org/wiki/Autosomal_DNA_statistics
Autosomal DNA match thresholds, International Society of Genetic Genealogy Wiki, This page was last edited on 31 August 2024, https://isogg.org/wiki/Autosomal_DNA_match_thresholds
Estes, Roberta , Comparing DNA Results – Different Tests at the Same Testing Company, DNAeXplained – Genetic Genealogy Blog, 18 May 2023, https://dna-explained.com/2023/05/18/comparing-dna-results-different-tests-at-the-same-testing-company/
Autosomal DNA testing comparison chart, International Society of Genetic Genealogy Wiki, This page was last edited on 8 October 2024, https://isogg.org/wiki/Autosomal_DNA_testing_comparison_chart
[43] Phasing, International Society of Genetic Genealogy Wiki, This page was last edited on 24 May 2024, https://isogg.org/wiki/Phasing
A Guide to Phasing from Illumina: https://youtu.be/15NPZCGP_e4
Autosomal DNA match thresholds, International Society of Genetic Genealogy Wiki, This page was last edited on 31 August 2024, https://isogg.org/wiki/Autosomal_DNA_match_thresholds
Davis DJ, Challis JH. Automatic segment filtering procedure for processing non-stationary signals. J Biomech. 2020 Mar 5;101:109619. doi: 10.1016/j.jbiomech.2020.109619. Epub 2020 Jan 9. PMID: 31952818.
