You can only go so far with Y-DNA test results. As stated in prior parts of this story, the ability to combine information from a wide variety of sources will ultimately lead to validated results, promising leads and stories. Oftentimes, in my limited experience I find that many individuals who have completed Y-DNA tests do not do much once they get the results. This is perhaps due to their unrealistic expectations of what the tests will provide. Or given the nature of the field, DNA testers do not know what to do with the results. I have found getting the test results is just the start of the process. They point you in a certain direction. The next steps are then in your hands in terms of trying to make sense of the results.
I can attest that I have not pushed the envelope in terms of analyzing Y-DNA results as much as possible. It takes a fair amount of time, energy and imagination. It also requires the ability to learn and understand how to interpret the results and use various mathmetical tools to analyze genetic data. DNA companies such as Family Tree DNA (FTDNA) provide access to a wealth of data, some of which is analyzed and packaged in innovative ways. FTDNA also provides working groups to assist in locating genetic matches and providing forums for assistance. However, there are other instances where one is on their own and required to personally gather FTDNA results from fellow testers in order to create “genetic trees” or uncover genealogical discoveries.
G-Haplogroup is a Modern Day Y-DNA Genetic Minority Group
In addition to the challenges of grappling with analyzing genetic data, despite the explosive growth of DNA testing, there is a dearth of data for testers of certain Y-DNA haplogroups. The Griff(is)(es)(ith) patrilineal line is part of the G-haplogroup. The G-haplogroup is a modern day genetic minority group at least in terms of potential testers and actual test kits in the FTDNA database.
The testing of Neolithic remains in various parts of Europe has confirmed that a major sub-branch of G, haplogroup G2a, was one of the dominant lineages of Neolithic farmers and herders who migrated from Anatolia to Europe between 9,000 and 6,000 years ago. They were part of a second massive wave of humans to migrate into Europe. However a third wave, coming from the Steppes, brought an additional Y-DNA genetic mix and eventually overtook the dominance of the G-haplogroup genetic presence. This third wave was predominately composed of the Y-DNA R-Haplogroup. [1]
By the Iron Age, the G2a subclade population in most of Europe had been genetically replaced as one of the predominate genetic paternal lines by the Indo-European migration of the R-Haplogroup. This was also followed by Celtic warfare in northwest Europe.. The net result was the diminished presence of G haplogroup men in Europe.
The ‘third wave’ of migration patterns into Western Europe belonged primarily to haplogroup R1b-U152. But as with any large scale migration pattern, the historic waves of migratory patterns often contain a mixture of genetic groups. Going back to our discussion in part two of this story about the differences between cultural and genetic genealogy, the macroscopic movements of genetic groups are logically separate and invisible from the cultural trappings of the actual migratory human groups. It appears that this third wave also carried a substantial minority of G2a-L140 lineages (of which the Griff(is)(es)(ith) line is part of) along their migration route. The net result of all of this is the G-haplogroup descendants in modern day Europe are a minority Haplogroup.
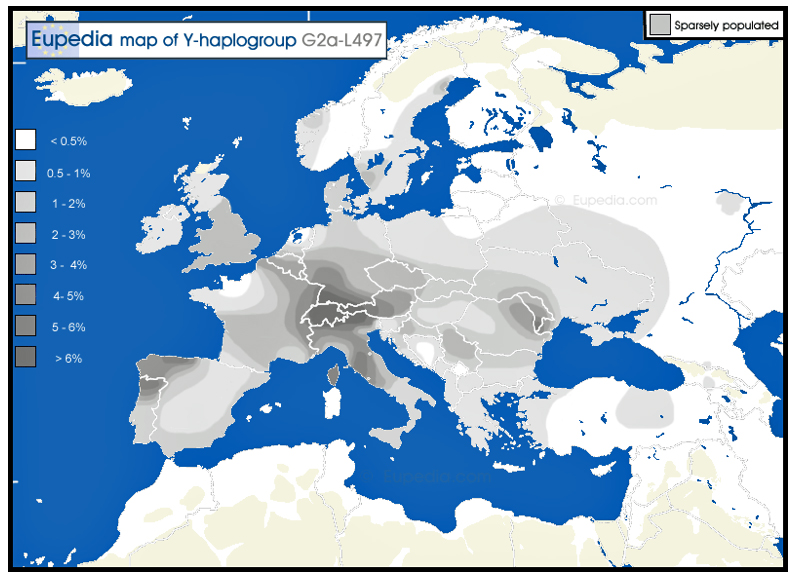
G2a makes up 5 to 10% of the population of Mediterranean Europe, but is relatively rare in northern Europe. The only regions where haplogroup G2 exceeds 10% of the population in Europe are in Cantabria in northern Spain, in northern Portugal, in central and southern Italy (especially in the Apennines), in Sardinia, in northern Greece (Thessaly), in Crete, and among the Gagauzes of Moldova – all mountainous and relatively isolated regions. Other regions with frequencies approaching the 10% include Asturias in northern Spain, Auvergne in central France, Switzerland, Sicily, the Aegean Islands, and Cyprus.
“. . . (T)he frequency of haplogroup G decreases with the distance from the boundaries of the empire. Haplogroup G is much rarer in Nordic and Baltic countries nowadays than in Great Britain, despite the fact that agriculture reached those regions around the same time. It is therefore not inconceivable that a part of the G2a in Great Britain, and especially in Wales (where G2a is the highest) should be of Roman origin. “ [2]
Illustration One: Distribution Map of Haplogroup G2a-L497 in Contemporary Europe
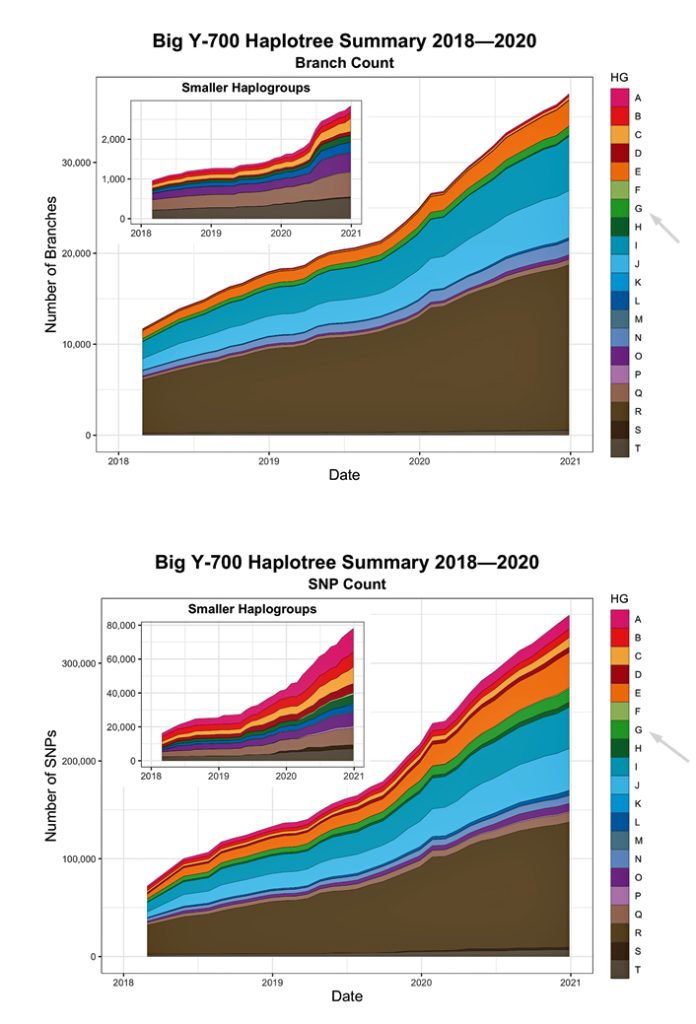
This means, by inference, there is a smaller pool of available males in Europe to obtain Y-DNA comparative test results. This is reflected in the current distribution of Y-DNA tests results maintained by FTDNA. [3] Test results associated haplogroups of testers residing in in modern Europe and the United States have increased dramatically (for example Haplogroups R, J, and I).
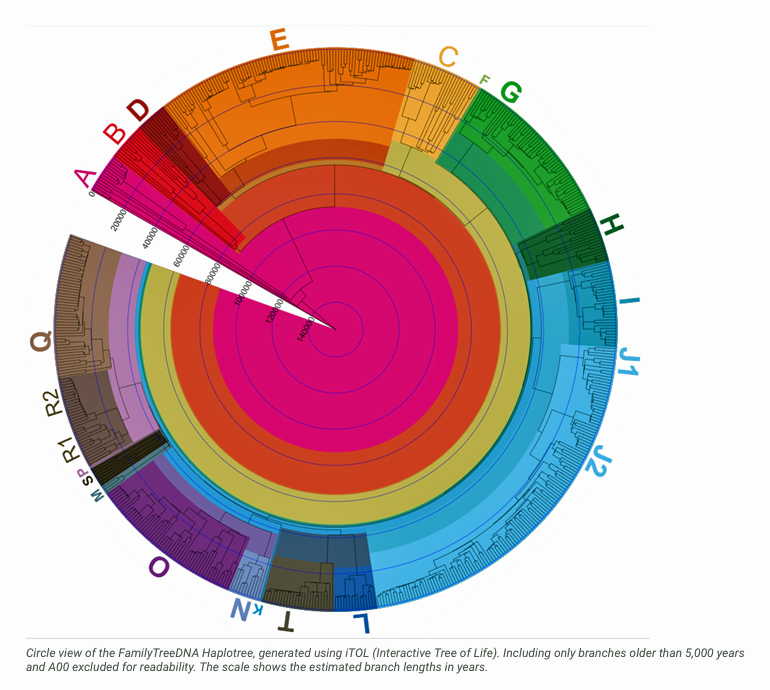
Illustration Two provides a time tree view of the FamilyTreeDNA Haplotree, showing branch lengths in thousands of years. The timeline is oldest (left) to more recent (right). Numbers adjacent to each clade are counts of downstream branches a given haplogroup.. Younger branches are collapsed for readability: 5,000 years ago is depicted in the main tree. 2,000 years ago is depicted in the much larger Haplogroup R tree. While not the smallest Haplogroup in terms of the number of branches documented, the G-Haplogroup is nonetheless smaller than many of the other haplogroups found in Europe. [3]
Illustration Two: Family Tree DNA Haplotree Summary Dec 2020 of the Number of Haplogroup Branches Documented.
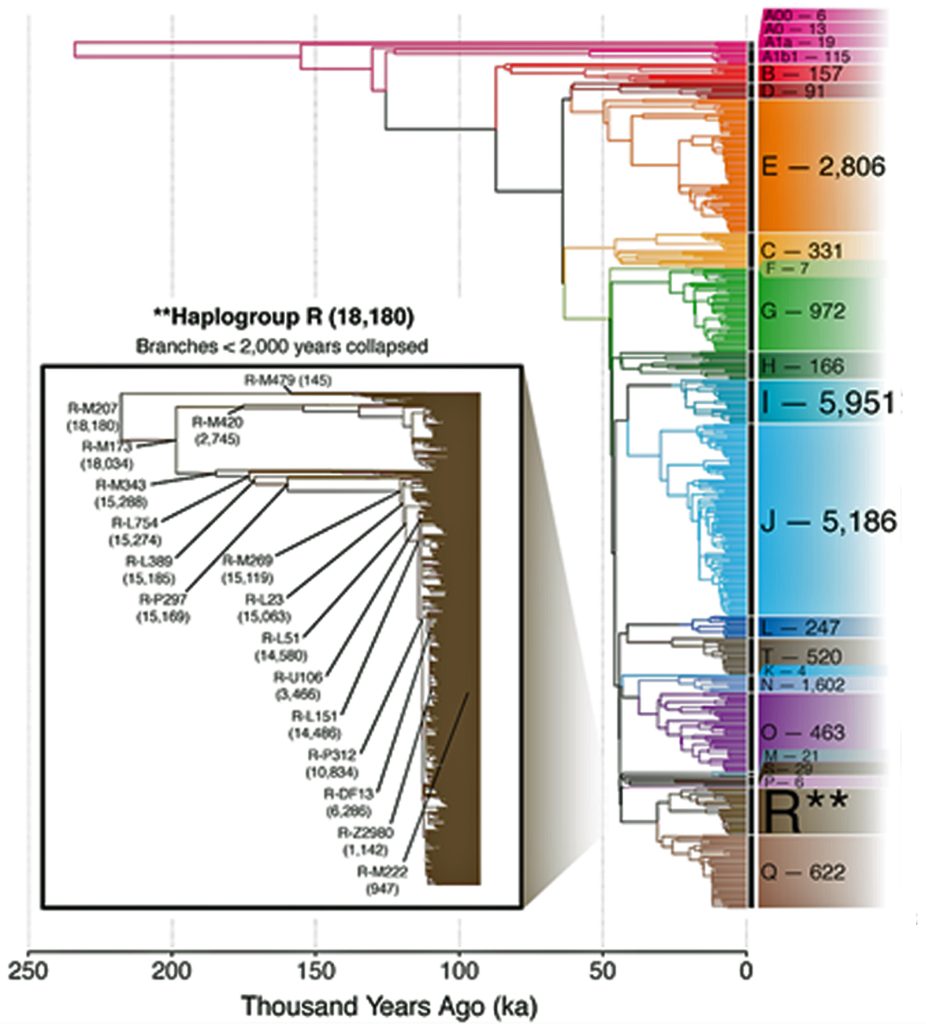
Coupled with the present day small population size of G-Haplogroup men in Europe, there are the genetic repercussions of “Brick Wall” challenges that were the result of colonial immigration to the Americas.
The Brick Wall: Colonial Immigration
Many amateur American genealogists lament about the Atlantic Ocean as the ‘brick wall’ in the uncovering ancestors who immigrated to the Colonies. There are historical and social structural parameters that shape and influence the probability of successfully finding descendants through genetic analysis and traditional genealogical research.
It is inherently easier to document ancestry on the American side of the Atlantic. It is objectively more difficult to discover genetic leads and traditional paper documentation to link our immigrant descendants with European descendants.
For many Americans, notably those who can trace their last known ancestor to colonial times, the last known connection will be the son of or the original immigrant son from Europe. In our case, it is William Griffis born in 1736 in Huntington, New York.
The original immigrant or the descendant of the original immigrant is in genetic genealogy the founder, a DNA bottleneck who “resets the odometer” on DNA mutations; and descendants start with zero diversity. This is a common pattern with profound effects on mtDNA or Y-DNA research. Bottlenecks on the European side (due to war, natural disaster, disease, etc) can further compound the problem of finding genetic matches
From an historical demographic and economic perspective, there are fewer descendants to trace back in Europe compared to the United States. Colonial America also had a higher literacy rate and great interest in record keeping which greatly aids efforts in locating documentation associated traditional genealogical research. Families that remained in Europe faced socio-economic hardships that resulted in lower fertility rates, smaller families, and higher mortality rates. [4]
The life experiences for family member who immigrated to the colonies were substantially different from their respective family members who stayed behind in Europe. While the first 17th century settlers had fearsome mortality rates, poor diets, and their settlements were dependent on the net import of foodstuffs, their life conditions comparatively improved over time and generations compared to their European relatives.
From a demographic, social, and economic standpoint, individuals who immigrated to the colonies experienced a set of different life experiences. European counterparts in western Europe had smaller families, higher mortality rates, limited economic capabilities and resources, and lived in urban areas. This contrasts with the life experiences of a family member who immigrated to the colonies. Abundant natural resources, higher wages, and cheap land contributed greatly to American colonialists’ standards of living. The period during which Americans most clearly led Britain in purchasing power per capita was in the colonial era. American colonists also had much more equal incomes than did West Europeans at that time. [5]
It does not seem difficult to find out the reasons why the people multiply faster here than in Europe. As soon as a person is old enough he may marry in these provinces without any fear of poverty. There is such an amount of good land yet uncultivated that a newly married man can, without difficulty, get a spot of ground where he may comfortably subsist with his wife and children. The taxes are very low, and he need not be under any concern on their account. The liberties he enjoys are so great that he considers himself as a prince in his possessions. [6]
The colonies had some of world history’s highest population growth rates, not only in the initial settlement phases, but all the way up to the Revolution. Between 1700 and 1780, population grew at 2.9 per cent per annum for New England and also for the Middle Colonies, and at 2.4 for the Southern colonies. Furthermore, these rates were well above those in the rest of the world. The net fertility in early America was more than double that of Europe. American families from 1650 to 1850 averaged 4.8 children to adulthood.
Two sources of population growth (high fertility rates and higher life expectancy rates) with their opposing implications for the level of income per capita, were at play in the colonial era. The American colonists had extraordinary rates of natural increase, fed by early marriage and high fertility, and by low mortality (outside of the South – excluding the unfortunate effects of slavery). As early as 1751 Benjamin Franklin attributed all of these features to the abundance of land, and half a century later Robert Malthus agreed. [7]
A 1650 emigrant will have 200-fold more descendants than a sibling who stayed in Europe. This, plus DNA testing bias, is why an American DNA tester will seldom find a European connection. [8]
Illustration Three: Example of Two Brothers’ Descendants
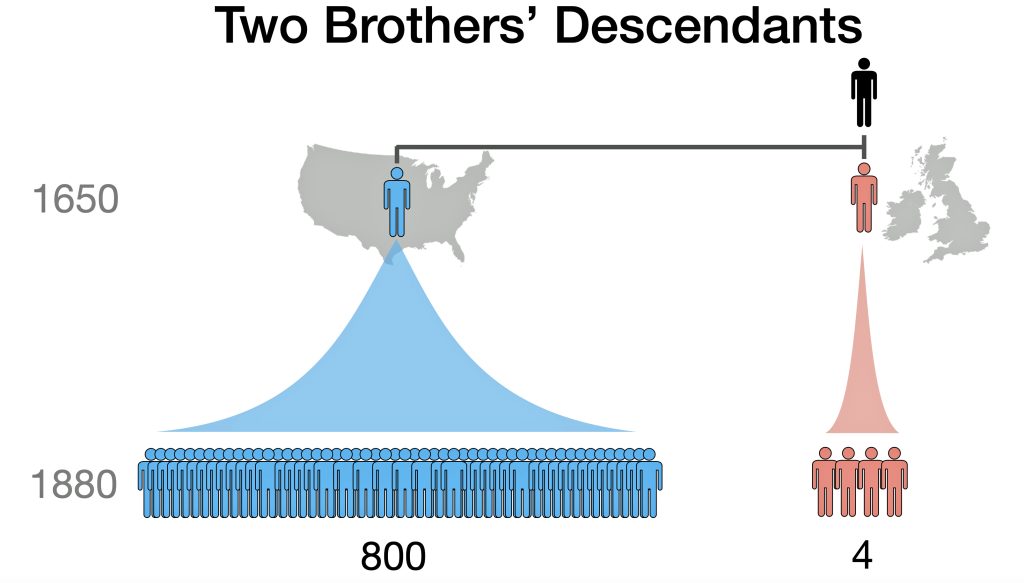
The explosive growth of DNA testing in the United States and Americans’ interest in DNA testing has led to a current situation where DNA databases are heavily slanted to American stories. That explosion coupled with the historical, socio-economic, and demographic patterns on each of the Atlantic during colonial times leads to large scale patterns that have essentially created a steep uphill path for individuals in the United State finding colonial descendants in Europe..
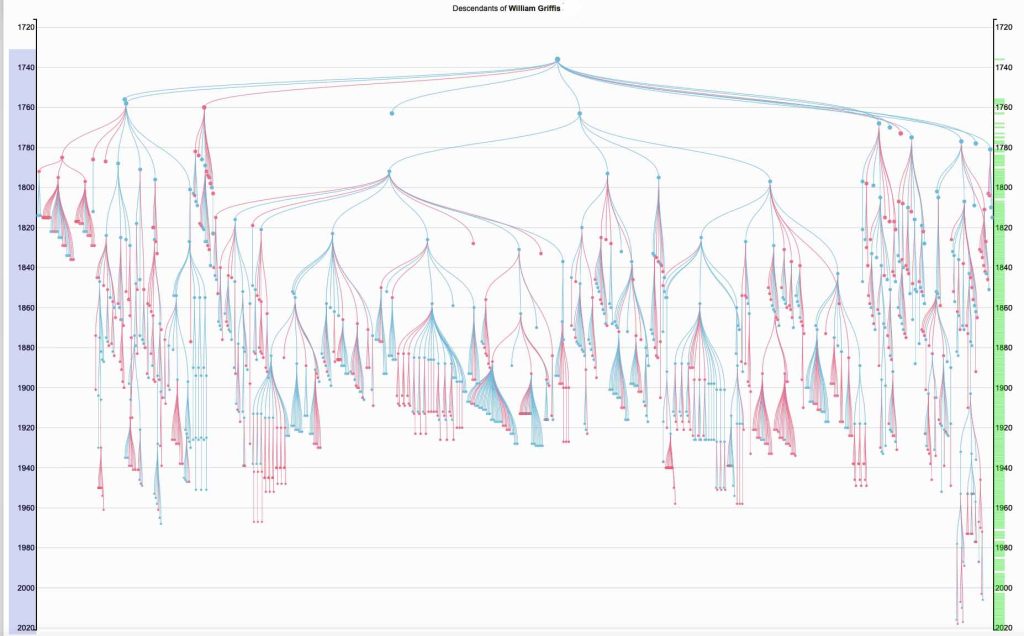
The Griff(is)(es)(ith) family that started from William Griffis certainly fits this argument about tracing colonial immigrant families and their subsequent growth in the new world. William had 12 children, ten of which were males: a good start for the continuation of the Y-DNA line. There are over 1,100 descendants (including family members by marriage) of William Griffis between his life and present day.
The following Illustration Four depicts a visual depiction of the founder effect for the Griff(is)(es)(ith) family through a novel rendering of a family tree. [9] The top of the tree is William Griffis. In addition to the various branches in the family tree, it also illustrates the number of descendant lines of extinction for various generations (the ‘fanning’ of branches in the tree diminishes) as well as the diminishing size of families through time (the width of th ‘fans’ of branches). The visualization also portrays the age longevity of individuals in the tree.
Illustration Four: Descendants of William Griffis – 1773 to the Present
Being part of a present day minority haplogroup, facing the challenges associated with the genetic brick wall of colonial immigration, and the American bias of Y-DNA testing certainly does not raise the expectations of finding Y-DNA genetic discoveries in Europe, regardless of the advancements made in DNA testing.
As will become evident as the story unfolds, the results are not entirely earth shattering but there are surprises nonetheless.
Review of Y-DNA Results
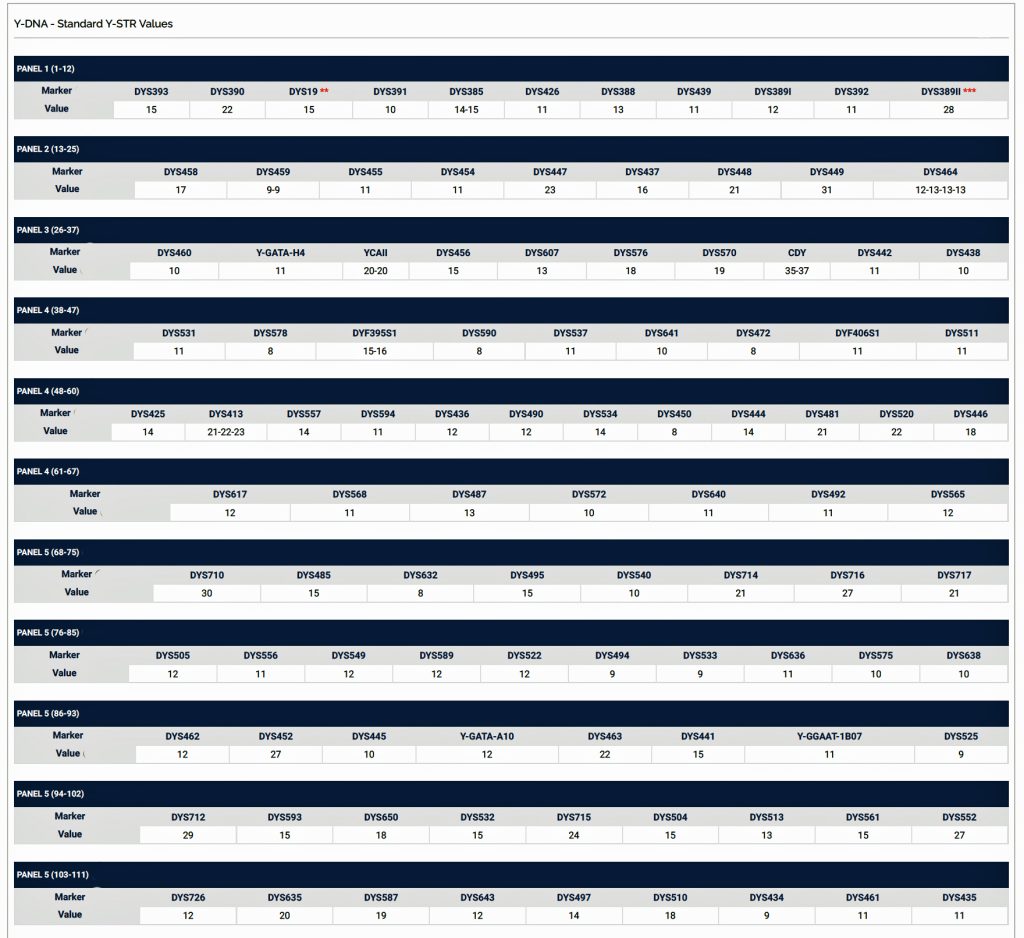
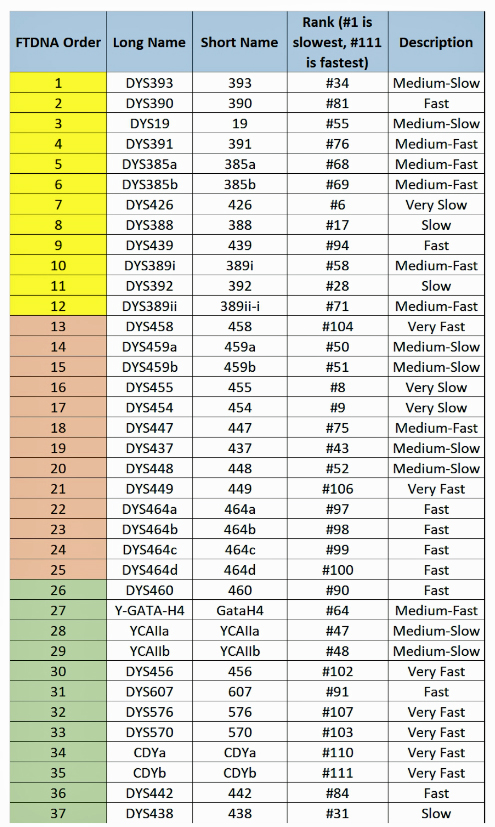
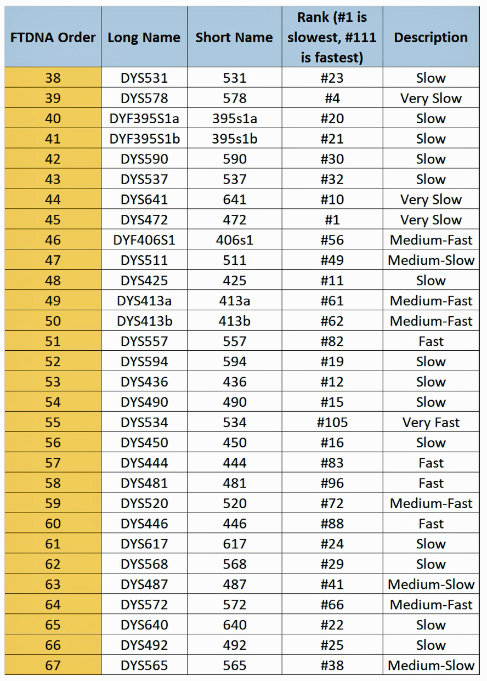
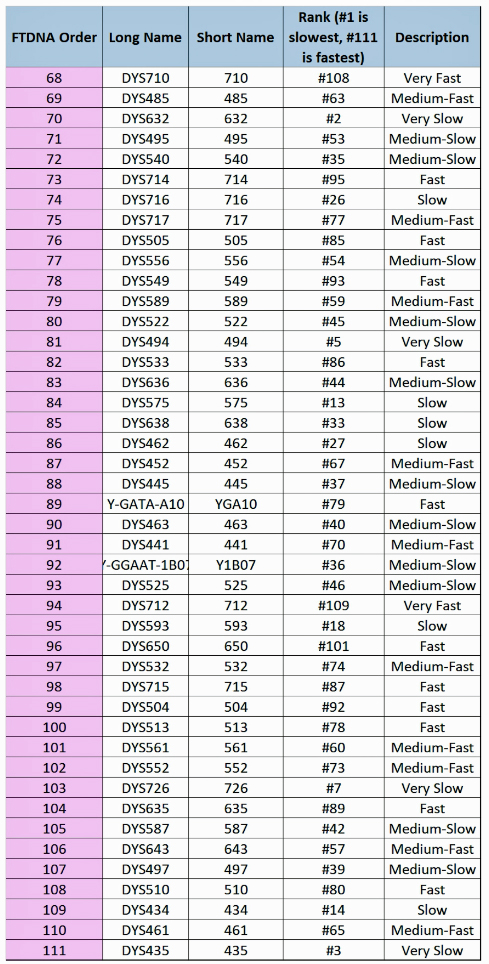
Based on the results of my Big Y 700 test from Family Tree DNA (FTDNA), I was able to compare similar test results from other males who completed the Y- 12, Y- 25, Y-37, Y-67, Y-111 or Big Y 700 Y-DNA tests. Short tandem repeats (STR) matches are limited to results for only the 111 identified STRs. The STRs beyond the 111 are used for predicting a more refined assignment of a Haplogroup or documenting a new branch in the haplotree.
I originally started my examination of potential Y-DNA STR matches with the Y-37 and Y- 67 test results. The more STRs used for comparison will provide more reliable results. It is like comparing two digital photographs of the same subject but one has more pixels and the other. The photograph with more pixels will provide more detail. Without additional traditional genealogical information or knowledge of surnames, using the results from the Y-111 test is the most reliable strategy for analyzing STR results. However, if another Y-DNA tester had taken a test with fewer STRs and had a similar surname or self reported common ancestor, then it is prudent to compare their Y-DNA results. This became apparent as I progressed with my research.
As indicated in earlier parts of this story, my Big Y 700 Y-DNa test confirmed my affiliation with the G haplogroup and documented that the Griff(is)(es)(ith) patrilineal line was also part of the L-497 subbranch of the haplogroup. Reviewing their work was a good start for my research.
The overwhelming majority of northern and western Europeans who belong to the G2a subclade fall specifically within G2a-L140 subclade. [10] The following ‘breadcrumb’ line traces back from my terminal SNP haplogroup:
G-L140 > G-PF3346 > G-PF3345 > G-L497 > CTS9737 > Z1817 > Z727 > FGC477 > Z6748 > Y38335 > Z40857 > Y132505 > BY211678.
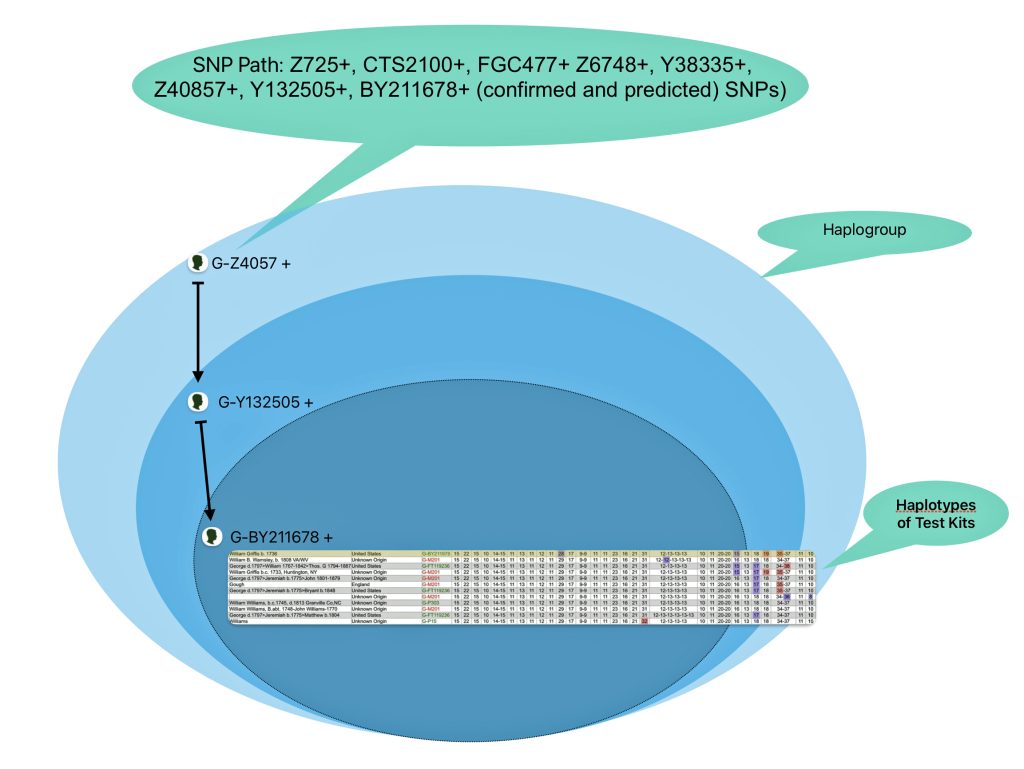
Illustration Five provides a graphic view of the breadcrumb line of haplotree branches to my terminal point on the G-haplotree. It also indicates the approximate date when the MRCA of the branch was born. My strategy for looking for possibleY-DNA matches among the Y-DNA test kits, involved going down the breadcrumb branches of the haplotree to a branch that was created closer to the present. The G-40857 branch started around the time of the Norman invasion of the British Isles 91000 CE). It made sense to start there for possible matches.
Illustration Five: SNP Breadcrumbs to My Terminal SNP
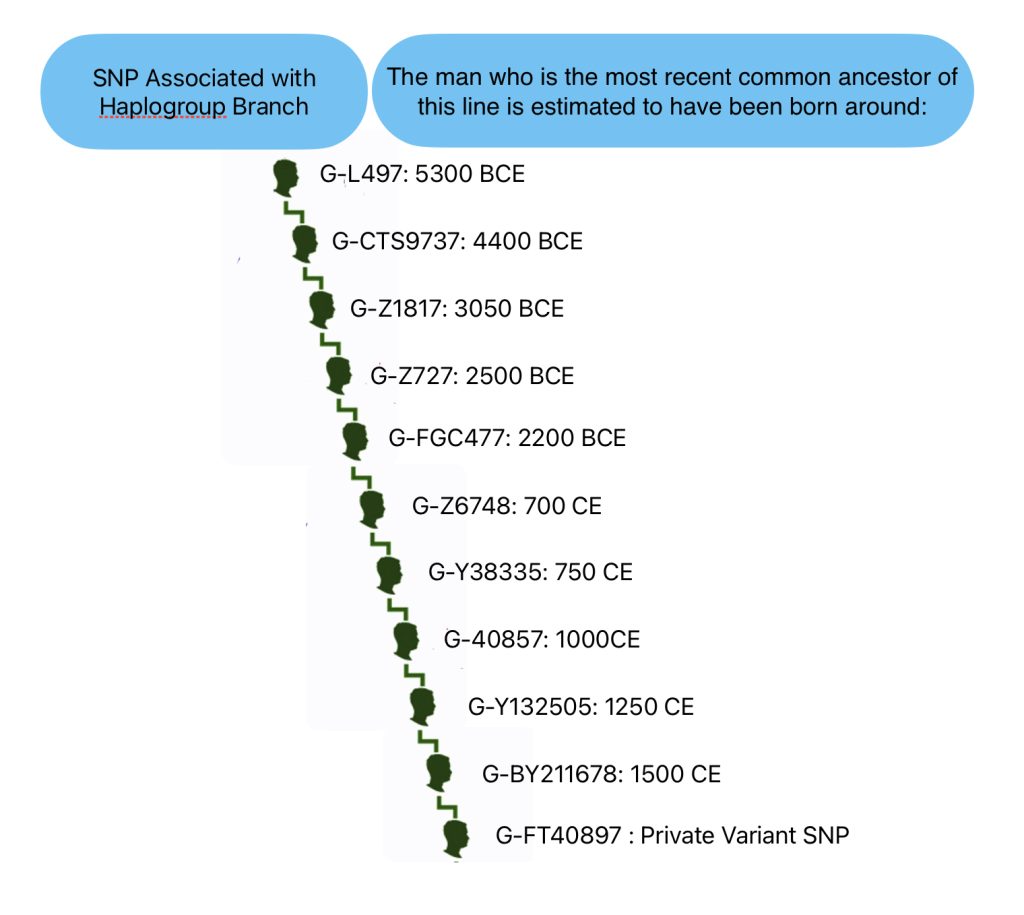
From the L-497 branch (which represented the initial stages of the second wave of modern human migration into Europe) I could narrow my search by going down the haplotree branches. Moving through ‘genetic history’ and following the westward migration of the haplogroup in Europe to the most recent branch: G-BY211678. The most common recent ancestor (tMRCA) for this branch was estimated to have been born around 1500 CE. This would represent a “recent” group of descendants that conceivably had descendants in a geographic area where William Griffis had descendants.
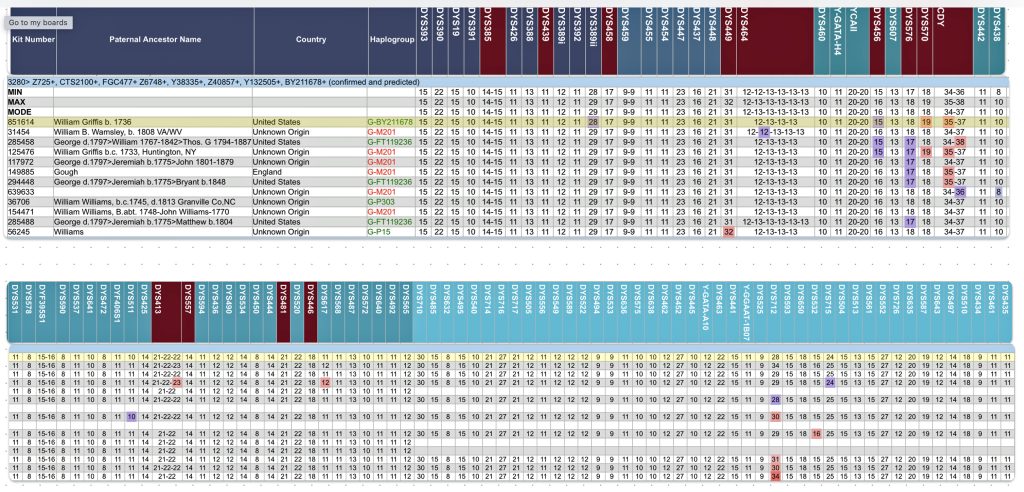
Based on the current population of FTDNA testers who completed one of the six types of Y-DNA tests, eleven individuals that were members of the L-497 project were the closest genetic matches within my haplotype. Table One, which has been mentioned in the prior story, provides the STR results of arranging test kits based on haplogroup affiliation. Twelve test kits (including mine) were grouped in the G-BY211678 haplogroup.
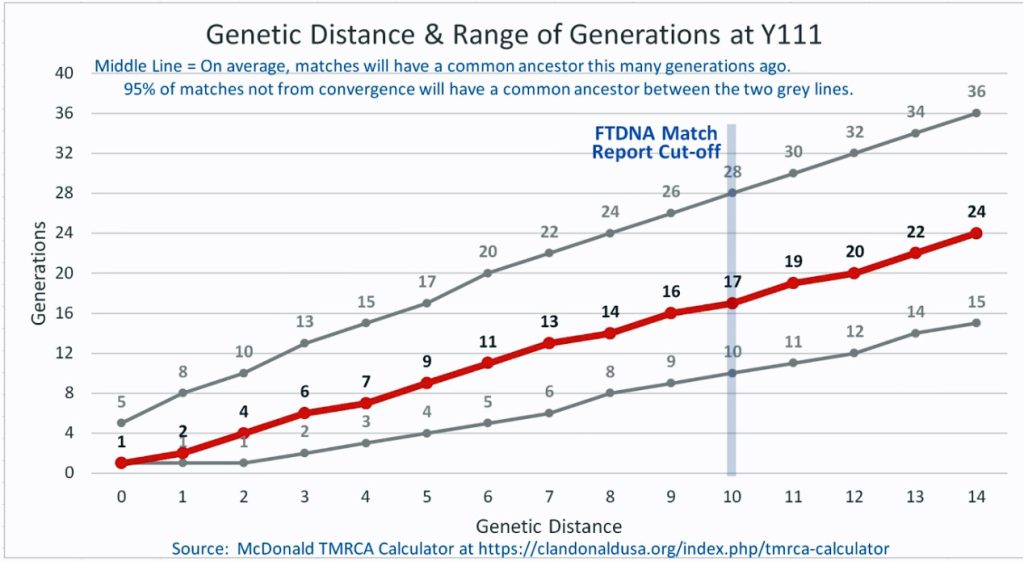
For genealogy within the most recent fifteen generations, STR markers help define paternal lineages. Y-DNA STR markers change (mutate) often enough that most men who share the same STR results also share a recent paternal lineage. Table One displays Y-Chromosome DNA (Y-DNA) STR results for individuals that either tested or were predicted positive for Y132505+ and BY211678+ for the SNPs associated with these haplogroups.
The table uses a colorized format to display the results. [11] The columns display each project member’s kit number, paternal ancestry information according to project settings, the paternal tree branch (haplogroup), and actual STR marker results (up to 111 markers in this table). In the haplogroups column, haplogroups in green are confirmed by SNP testing. Haplogroups in red are predicted. Above each subgroup, the table displays the minimum, maximum and mode values for each STR marker in the subgroup. STR marker values that differ from the mode values are color-coded.
Table One: Haplogroup G-L497 Y-DNA Project – Y-DNA Colorized Chart
Using various FTDNA based analytical tools and other novel applications from amateur genealogists, eight of the eleven test kits were found to be ‘relatively’ close as genetic Y-DNA matches.
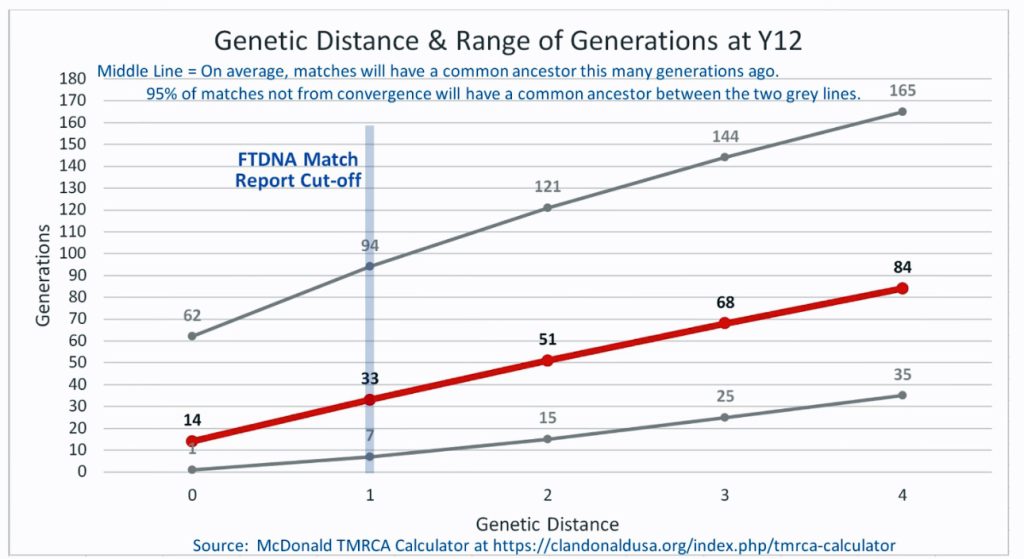
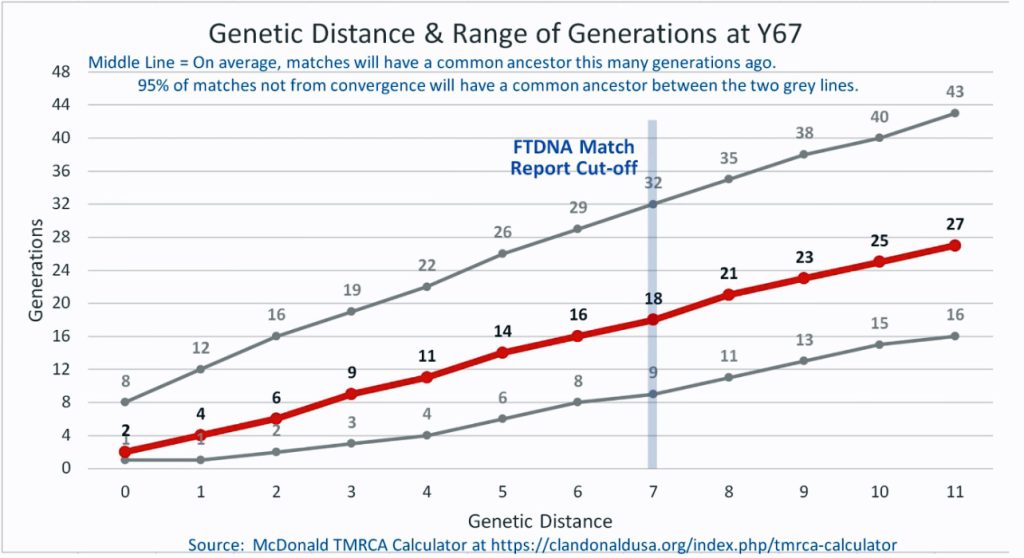
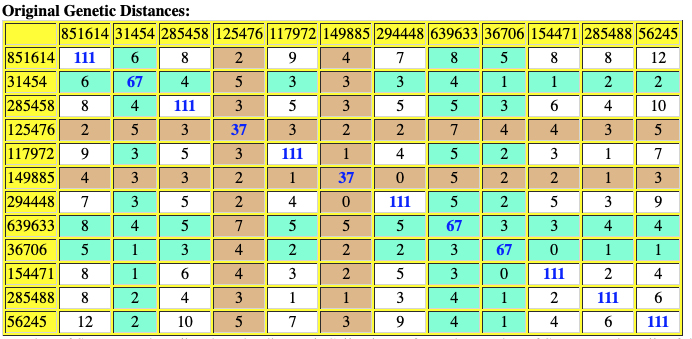
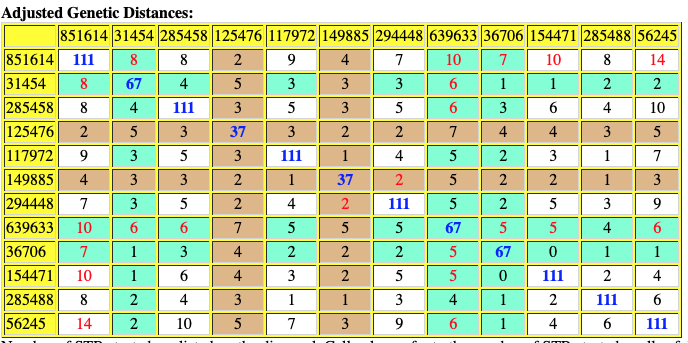
Table Two provides information on ‘how close’ the eight test kits are in terms of genetic distance. All but one of the test kits are associated with individuals in the United States. Kit number 149885, the surname of the tester is Gough, is from England. Two of. the eight are ‘two genetic steps’ from me while the remaining six tests kits are four genetic steps. The number of steps from our respective MCRA are not necessarily the same. As stated in the prior story, the number of STRs compared has an impact on how to interpret genetic steps.
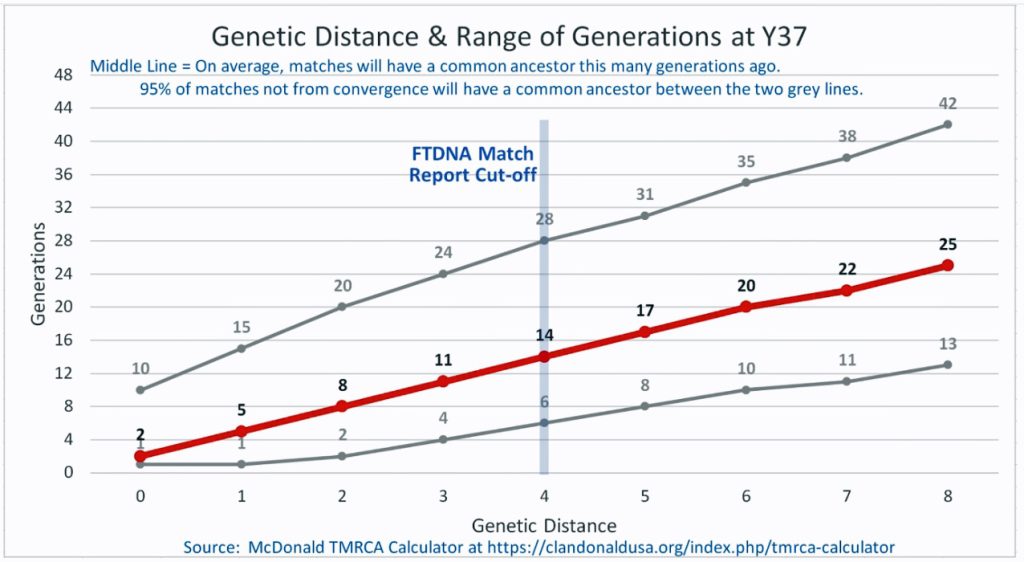
Although the test kit 125476, whose tester’s last name is Griffith (first row of the table), only tested for the Y-37 test, his test results are 2 ‘genetic steps’ different from my test results. This means, based on a Y-37 test comparison, Mr. Griffith and I share a common ancestor around 8 generations ago or ‘give or take’ between 2 to 20 generations..
Based on a Genetic Distance of 2 at the Y-37 test level, I and Henry Vieth Griffith are estimated to share a common paternal line ancestor who was, with a 95% probability, born between 1250 and 1850 CE. The most likely year is rounded to 1650 CE. This date is an estimate based on genetic information only. Eight generations would be around the revolutionary war period in America and around the time that William Griffis was born! [13]
Table Two: STR Haplotype Matches with James Griffis Based Minimally on Y-37 Test
| Kit No. | Surname of Tester | STR Markers Tested | Genetic Distance (GD) | Likely Common Ancestor (Genera- tons) | MRCA Based on GD [12] | Earlest Known Ancester |
|---|---|---|---|---|---|---|
| 125476 | Griffith | 37 | 2 Steps | 8 (2-20) | 1650 CE | William Griffis |
| 39633 | Compton | 37 | 2 Steps | 8 (2-20) | 1650 CE | Unknown |
| 154471 | Williams | 111 | 4 Steps | 3(7-15) | 1700 CE | William Williams |
| 285488 | Williams | 700** | 4 Steps | 3(7-15) | 1700 E | George Williams |
| 294448 | Williams | 111 | 4 Steps | 3(7-15) | 1700 CE | George Williams |
| 285458 | Williams | 111 | 4 Steps | 3(7-15) | 1700 CE | George Williams |
| 36706 | Williams | 67 | 4 Steps | 11(4-22) | 1500 CE | William Williams |
| 149885 | Gough | 37 | 4 Steps | 14(6-28) | 1300 CE | Gough |
Source: FTDNA myFTDNA Y-DNA Match Results for James Griffis
The following provides an explanation of the information found in Table Two
Surname is the actual surname of the tester.
Markers Tested indicates the total number of STR markers tested. Only markers from those tests were used for the match.
Genetic Distance (GD) refers to the number of mutational differences in tested STRs between my results and the individual tester. Fewer differences can indicate a closer relationship to a shared paternal line ancestor. This is used to rank order possible genetic matches among Y-DNA test kits. [12]
Common Ancestor refers to the estimated number of past generations that I and the tester possibly share a common ancestor based on a 90+ percent confidence interval. Since each STR marker has a different mutation rate, identical Genetic Distances will not necessarily yield the same probabilities. Someone else with the same Genetic Distance may have different probabilities, because the distance was prompted by mutations in different markers, with different mutation rates. The numbers in the parentheses represent the confidence level range of generations.
MRCA is based on an estimate time when the common ancestor was born.
Earliest Known Ancestor is self reported by the owner of the test kit.
Another Y-DNA tester is purportedly 2 genetic steps from me as well. The surname associated with the test kit is “Compton” and no earliest known ancestor was reported with the test results. I have not found any relatives through tradition genealogical research with the surname of Compton.
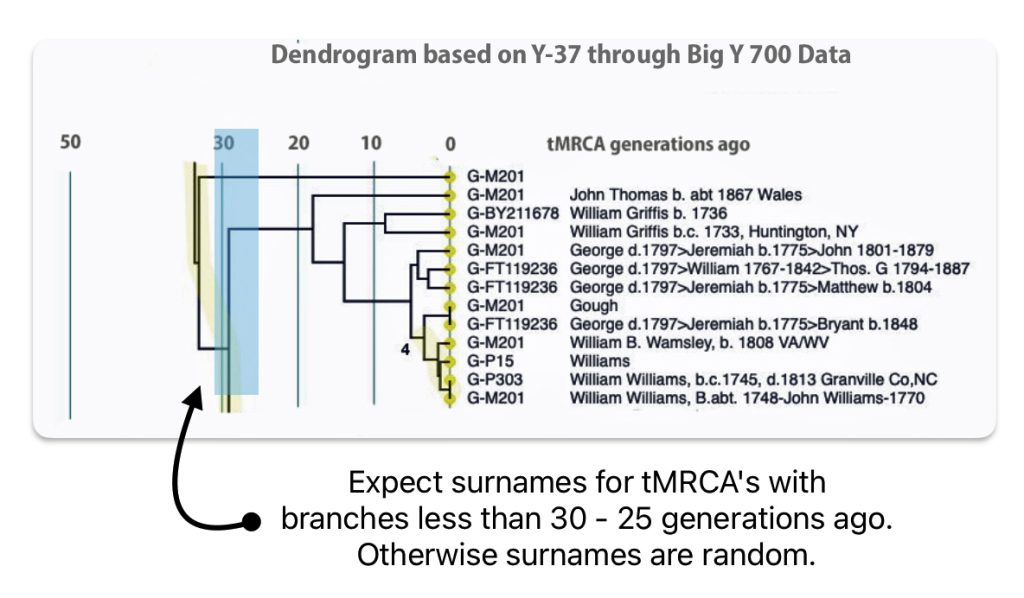
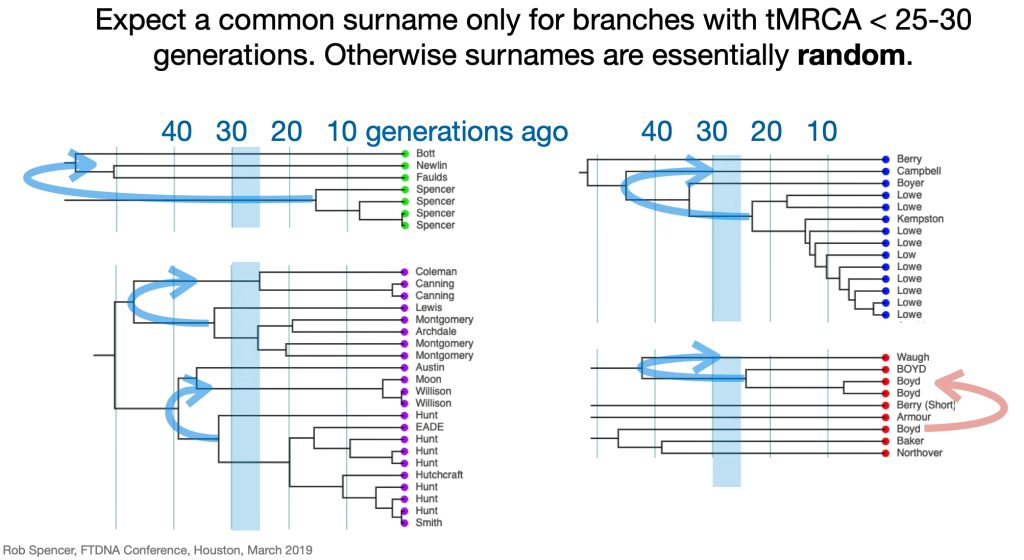
Given the nature of the late adoption of surnames among the Welsh, being related to this gentleman is not necessarily ruled out. While it has been stated that one should expect the presence of surnames for tMRCA’s with branches that are less than 25 – 30 generations ago, I am assuming that range is more like 20-25 generations ago for Welsh surnames. [14] The statistical deviation of 2 genetic generations based on a Y-37 STR test is relatively wide. Similar to my test result comparison with Henry Griffith, based on a Genetic Distance of 2 at the Y-37 test level, I and Mr. Clinton K Compton are estimated to share a common paternal line ancestor who was, with a 95% probability, born between 1250 and 1850 CE. The most likely year is rounded to 1650 CE.
The remaining six testers listed in Table Two are four genetic steps different from my test results. One of the test kits is based on Y-37 results, one on Y-67 results, three on Y111 results and one on the Big Y 700 test kit result.
What is interesting among these six test kits, the common surname is Williams. While I do have any traditional genealogical documentation which connects the Griffis family with other individuals with the Williams surname, perhaps 15 to 22 generations back there might be a common ancestor with the Williams surname.
Illustration Six: Emergence of Surnames in Genealogical Research Depicted in a Genealological Dendrogram
As discussed in earlier stories, the use of surnames in Wales was not widespread until the sixteenth and seventeenth centuries. In the greater part of Wales, the ancient patronymic naming system continued: having children identified in relation to their father. This meant that surnames in the 1600’s and and 1700’s did not take on the weight of significance that they have for present generations. Using a surname was similar to using a first name, they changed based on what was conferred by prior generations and also what one wanted to use as a surname. There was a wide time variation when surnames were adopted in various parts of Wales. Surnames became the norm by 1750 across the coastal plain of south Wales and along the eastern border with England. [15]
The ten most common surnames in Wales in 1856 were Jones (13.84%), Williams (8.91%), Davies (7.09%), Thomas (5.70%), Evans (5.46%), Roberts (3.69%), Hughes (2.98%), Lewis (2.97%), Morgan (2.63%) and Griffiths (2.58%). [16]
The STR Results Using Dendrograms
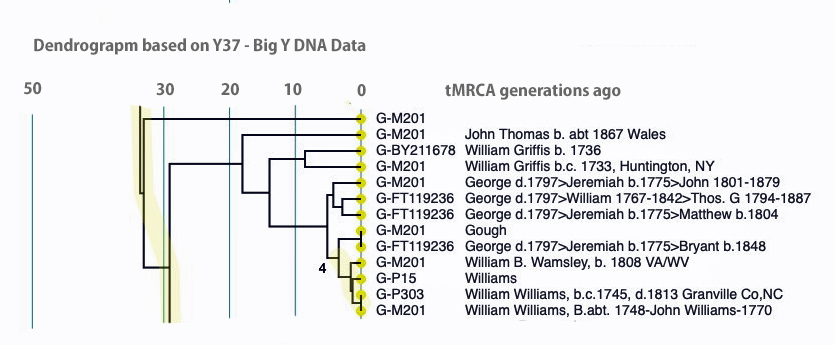
I used the FTDNA data from the L-497 project as data input into Rob Spencer’s Y STR Clustering and Dendrogram Drawing program [17] and filtered the data to only include test kits within the G-BY211678 haplotree branch (re: Illustration Six above). The dendrogram provides a sense of genetic distance between the test kits and approximate generations from the most recent common ancestors.
The dendrogram provides a genetic tree diagram of test kits that are listed as rows in the dendrogram. The nodes to the branches in the tree represent a most recent common ancestor. Time, as measured in the number of generations from the present, starts from the right and proceeds to the left. The haplogroup for each test kit is listed. Some of the haplogroups associated with test kits are very basic or reflect major ‘trunk branches’ in the G-haplotree. This is due to the type of Y-STR test that was used for a particular kit. If someone completed a Y-37 test, given the limited number of STR markers tested, haplogroup prediction would also be limited. The paternal ancestor, reported by the tester, is also listed in the dendrogram.
Illustration Six: Y-STR Dendrogram of FTDNA Test Kits in the G-BY211678 Haplogroup

The genetic relationships between the test kits are fairly apparent. What is evident is the close genetic distance between Mr. Griffith and my test kits. His test kit is listed as G-M201 “William Griffis b.c. 1733, Huntington, NY and my test kit is listed as G-BY211678 “William Griffis b. 1736”. Consistent with the FTDNA’s results from FTDNATiP™ genetic steps analysis, my test kit and Mr. Griffith’s test kit suggest we share a common ancestor approximately 8 generations ago who was born in the mid 1600’s to early 1700’s.
The dendrogram also suggests that a common ancestor is shared with eight test kits that identify their respective paternal ancestors as having the Williams and Gough surnames. Our most recent common ancestor may have been born about 14 generations ago. Using 33 years for a generation [18], this would be around 1560 CE. The approximate date of our MRCA is prior to the time when surnames were prevalent in Wales.
STR Results Portrayed in a Phylogenetic Tree
I also used the FTDNA data from the L-497 project as data input into Dave Vance’s SAPP program to develop a phylogenetic tree that graphically outlined the genetic distance between the test kits within the haplogroup. The program is relatively easy to use and graphically provides an intuitive approach to visualize the possible genetic relationships between various DNA test results. The program is referred to as the SAPP analysis (Still Another Phylogeny Program). The current version that was used in my analysis was SAPP Tree Generator V4.25. [19]
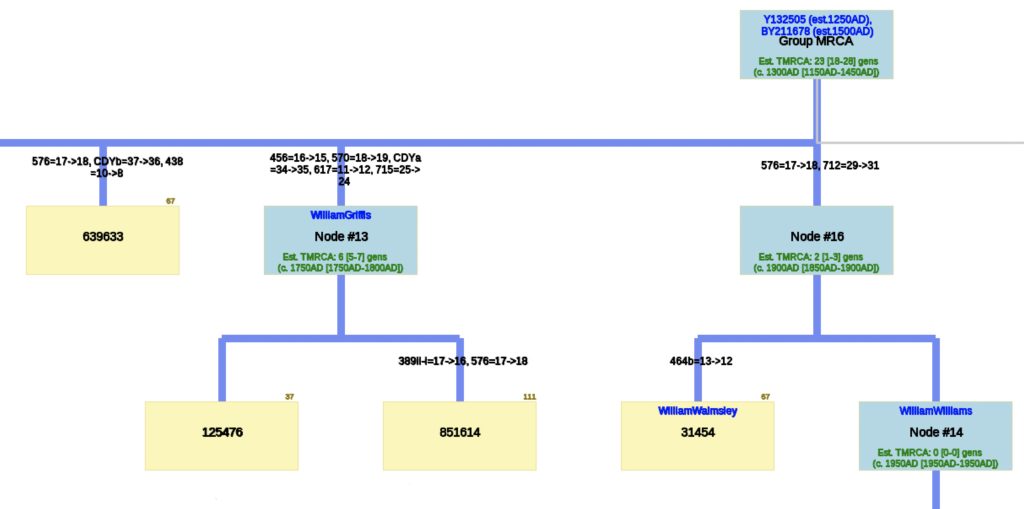
The resultant phylogenetic tree created nodes that represent tMRCA based on key differences between specific STR markers based on the allele values for the respective STR markers. Basically the program creates a genetic tree of test kits based on the comparison of differences between the allele values for the STR markers. It transforms the information in Table One into a tree.
The following phylogenetic tree in Illustration Seven was created (click on the image of the thumbnail of the tree to be able to actually see the table) or see the PDF file – you can increase the size of the PDF file to better viewing.
Illustration Seven: Phylogenetic Tree Results for FTDNA STR Test Results for Individuals within the G-BY211678 Haplogroup (Click for Larger View)
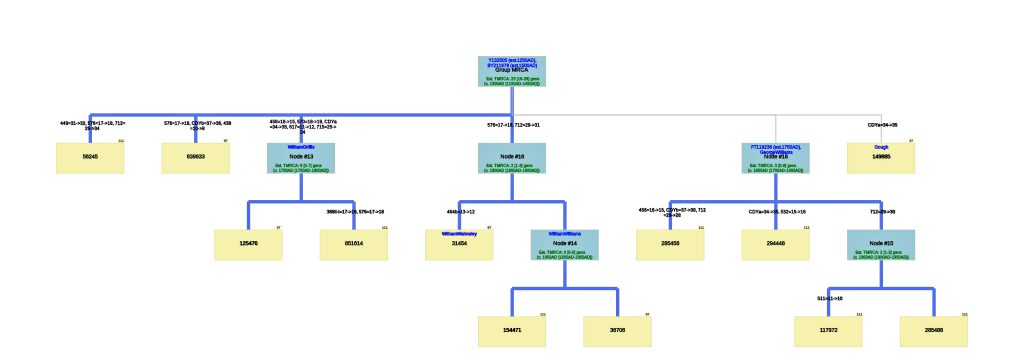
The analysis of STR differences between the 12 test kits resulted in a phylogenic tree with three major nodes. The most recent common ancestor that started the G-Y132505 haplogroup branch is estimated to have been born around 1250 CE and the birth date of tMRCA for the subsequent G-BY211678 haplogroup is 1500 CE. It is estimated the MRCA for all of the 12 test kits is 23 generations or 1300 CE.
There are three major nodes in the phylogenetic tree. Descending from the MCRA, three individual test kits are listed directly from the MCRA. One of the three major nodes, Node #13, lists descendants of William Griffis. Node #13 is based on key STR differences in five STR markers: DYS456, DYS570, CDYa, DYS617 and DYS 715. Both my kit and Henry Griffith’s test kits are part of this node. Another major node, Node #16, groups test kits that have a paternal ancestor listed as William Walmsley and William Williams. Another major node, Node #18, lists test kits that had more recent STR mutations (an estimated TMRCA of 3 generations – around 1800 CE). The test kit with the paternal ancestor named Gough is listed directly off the major node.
The Results: The Big Picture
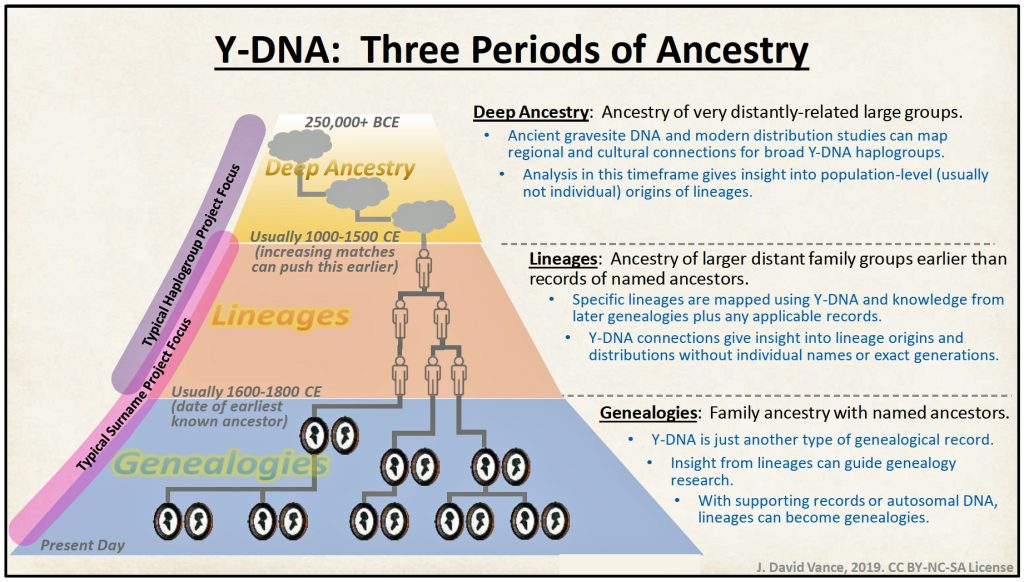
In general, while the results from analyzing STR Y-DNA data are sparce, the analysis underscored the value of genetic genealogical analysis for unearthing discoveries associated with each of the three periods of genealogy, particularly for potential lineages and genealogies. [20]
Illustration Eight: The Three Periods of Genealology
Finding genealogical matches are slim. The size of the current database of Y-DNA testers within my specific G-haplogroup is relatively small. The probability of finding matches is obviously related to the size of the population that has completed a Y-DNA test with the particular company that you are utilizing. While DNA testing has appreciably increased over the past 10 years, Y-DNA testing has specifically increased at a lower rate than the popular ‘ethnic heritage’ tests. Like fly fishing, I knew my ability to snag a ‘lead’ through Y-DNA analysis might be slim but a catch is always delightful.
It came as no surprise that the available test results for comparison for potential genetic matches are presently small. There were only a dozen or so test kits for comparison in one of the FTDNA working projects. There may be additional test kits to compare but it involves a more active search on my part to search the FTDNA complete database.
Matches with different surnames were found in the lineages period of genealogy. Since the Griff(is)(es)(ith) surname is purportedly a Welsh surname, the use of surnames did not become firmly established in certain parts of Wales until the late 1700’s to mid 1800’s. Based on my traditional genealogical research I knew the Griffis family line had three spellings of the surname (Griffis, Griffith, and Griffes) in America. Y-DNA tests have corroborated that finding genetically related ancestors with different surnames in Europe is evident. The next step is to see if any of the Williams clan are part of our genetic lineage.
Finding genealogical matches currently confirmed through traditional research. The Y-DNA test did indeed find a match with an individual that I have already documented in my family tree. I might be able to find additional clues to male family members that are descendants of William Griffis in the future.
Finding genealogical matches that point to Wales. It appears Y-DNA test results point to ancestors in the area we currently call ‘Wales”. Obviously, one’s ancestors could be Welsh and have lived in London or other parts of the British Isles. This is investigated in the next story.
Identify unknown ancestors and lineages in timelines where no records exist. The Y-DNA test results have narrowed the search of male ancestors of the Griff(is)(es)(ith) paternal line to specific genetic Y-DNA lines in the G-haplogroup in the British Isles.
Identify ancient groups and migration patterns associated with the genetic paternal line. I certainly have obtained information about ‘deep ancestry’. Viewing the patrilineal line at a higher, macroscopic anthropological level provides a novel perceptive on the origins of the lineage. More on that in subsequent stories.
Further research into the possible background of the remaining test kits may produce worthwhile results! WHO KNOWS, we might be related to a few Williams and a Gough and a Compton a few centuries ago!
Corroboration of a Family Tie: Henry Vieth Griffith
The results of the Y-DNA testing thus far have confirmed one distant Griffith relative: Henry Vieth Griffith.
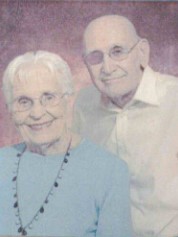
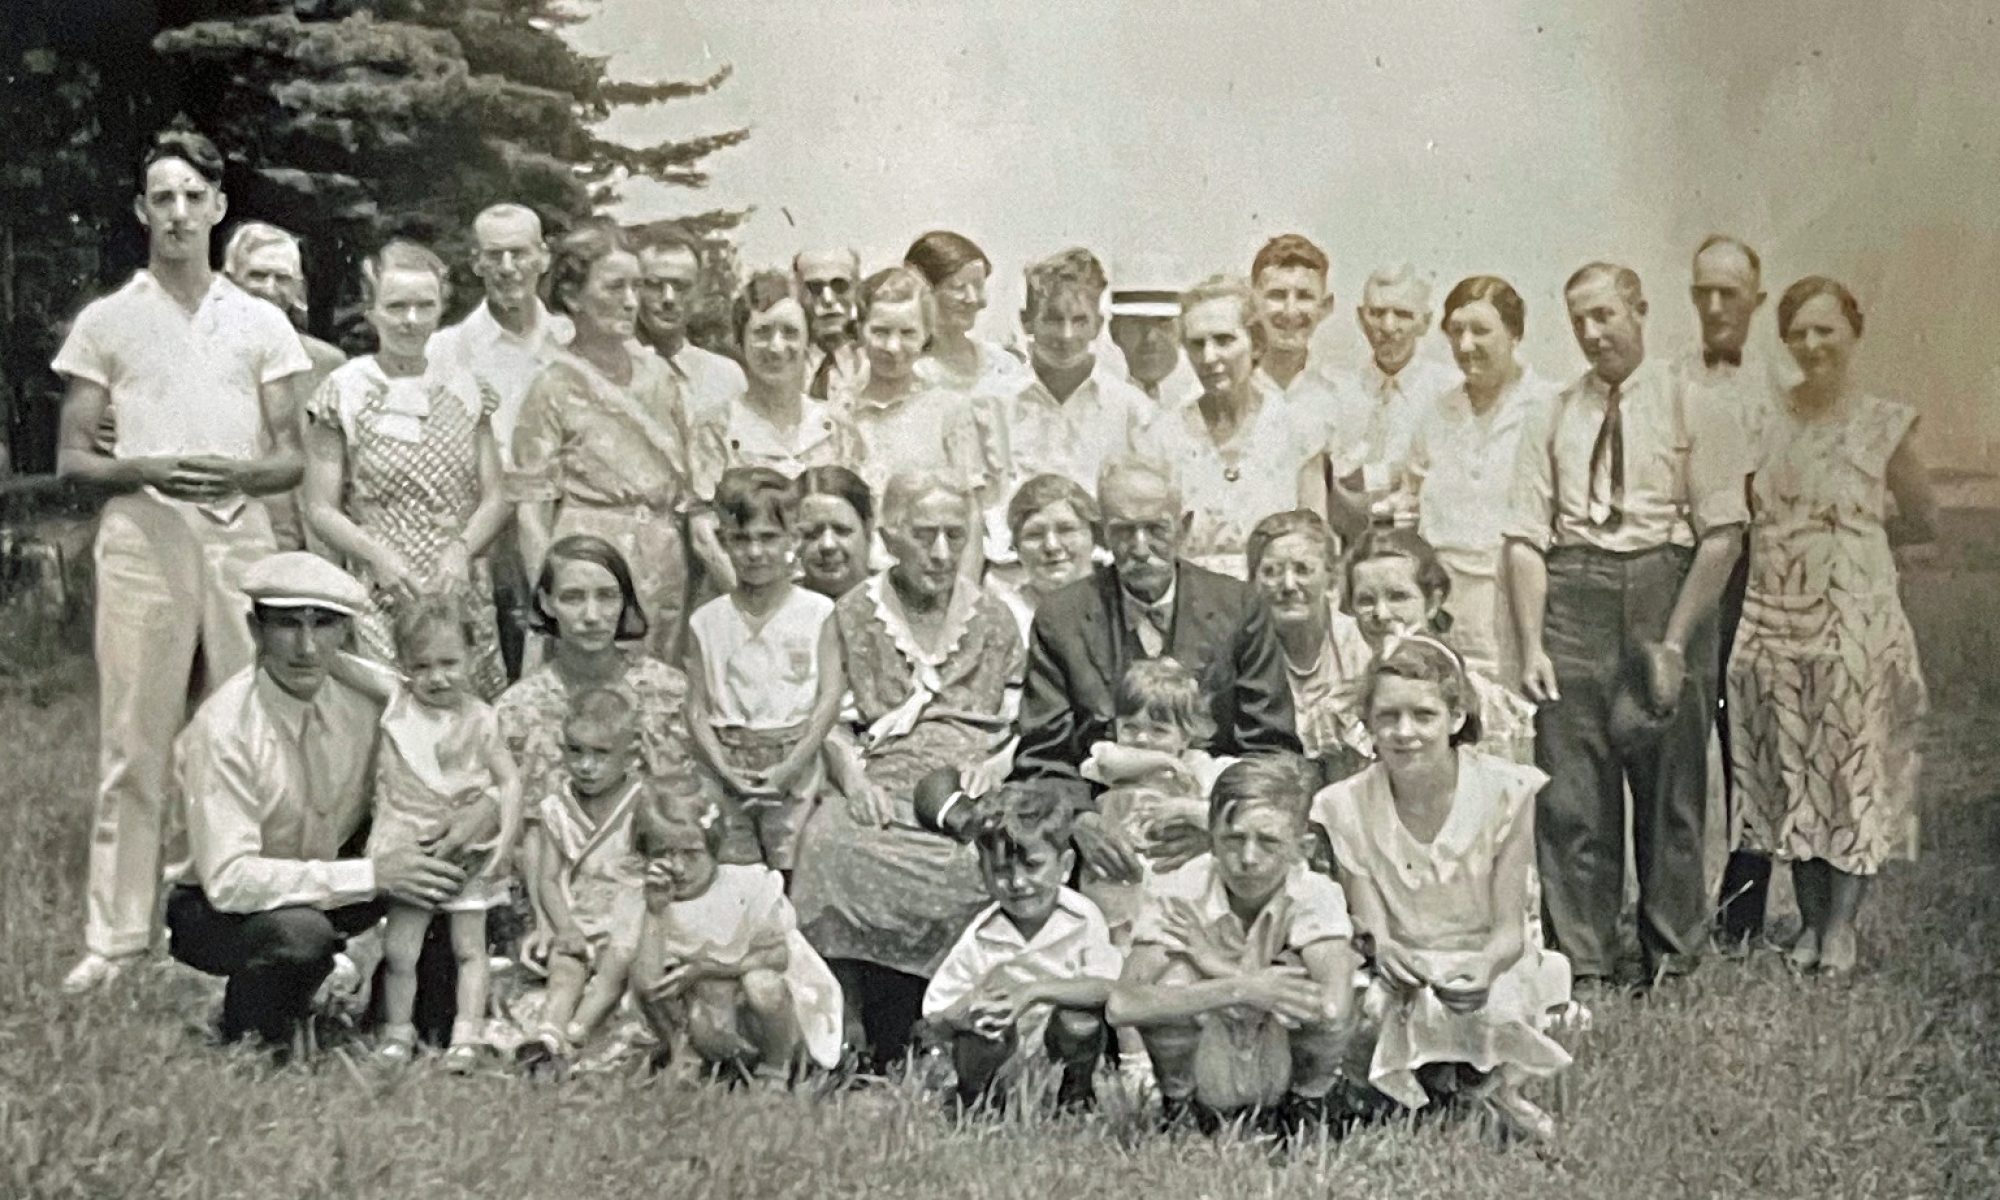
Dave Sickler originally shared this photograph on an ancestry.com family tree on 13 Jan 2021
Henry Vieth Griffith was originally discovered through traditional research. Y-DNA analysis confirmed the results of traditional genealogical research. Through the course of researching various on-line family trees, coupled with access to personal family histories surrounding the descendants of James Griffis, William Griffis’ second son, I was able to document Henry Griffith’s family ties.
In the course of conducting my on-line research prior to completing Y-DNA tests, I discovered a defunct website “Gruffydd Genealogies: Griffi(th)(n)(s)(ng)Surname DNA Project“.
The website had a link entitled “Pedigrees” which listed family trees with Kit Numbers, brief information on the paternal ancestor and email contacts. At that time I had no idea what a ‘Kit Number’ was nor was it immediately apparent that the website represented the results managed by FTDNA. [21]
On a Pedigree link on the website it listed a number of Family Pedigrees found in this Y-DNA surname research project. One of the pedigree’s got my attention: “ #49, Kit Number 125476, William Griffith, born 1773 of New York, married Abiah Gates ” and provided a contact email address”.
“Eureka! I found a relative! “
Unfortunately, my repeated attempts to send emails provided no responses. The email address appeared to be a dead-end. Moreover, the link to the family tree for this Kit number returned with a ‘404’ web error, meaning the link no longer linked to an existing web page. I did not realize until later on in my research that the email address on the website was Henry’s wife’s email address. Sadly, Arvilla Griffith passed away in 2014.
While the website was no longer being actively managed, I did not realize that the website was the early precursor of the current FTDNA Griffi(th)(n)(s)(ng) Surname project of which I am now a member. The project administrator listed on the website is no longer involved with the project but some of the links on the old site still direct the reader to current information on DNA results for another current FTDNA project: the L-497 haplogroup project!
At the time of this discovery of the defunct website, it merely provided, for my research, another confirmation that “William Griffith(is)” married Abiah Gates.
Through my continued research of genealogy material posted on various family trees, I found a number of sources that ultimately provided bits and pieces of the James Griffis (b. 1758) family line of descendants – sufficient information to progressively put puzzle pieces together to develop ties between Henry Vieth Griffith and the descendants of William Griffis.
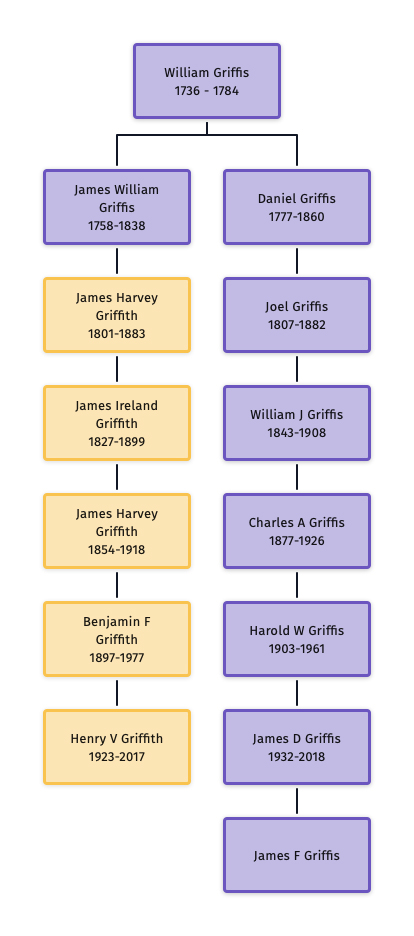
All said and done, tracing Henry’s line of descent up to William Griffis and back down the tree to me indicates that Henry is my 5th cousin once removed.
Illustration Eight: Most Recent Common Ancestor for Henry Griffith and James Griffis
Henry Vieth Griffith, was a descendent of James Griffis, William’s second son. Here is Henry’s surname line:
- William Griffis, born 1736 Huntington ,NY;
- James William Griffis, born 04 June 1758 Suffolk, Co, NY, died 21 November 1838, Suffolk, County, NY;
- James Harvey Griffith, born 19 August 1801 Huntington, NY, died 11 April 1883 Rockaway, Queens NY;
- James Harvey Griffith, born 23 April 1854, died 26 Sep 1918 Barrington, Bristol, Rhode Island;
- Benjamin Fessenden Griffith, born 8 March 1897 East Rockaway Nassau NY, died 27 May 1977 Suffolk County, NY; and
- Henry Vieth Griffith (17 October 1923 Barrington RI – 20 May 2017 Weslaco, TX)
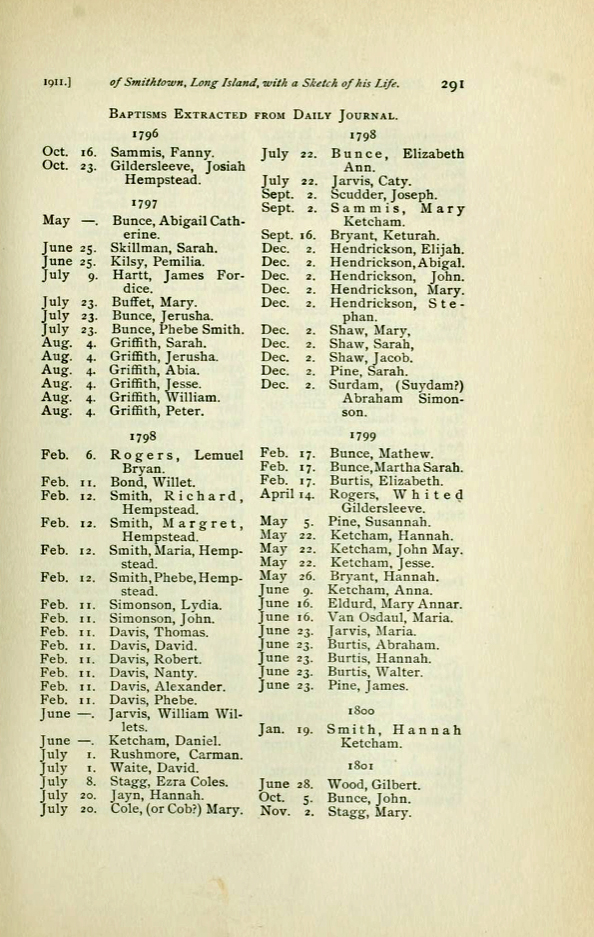
It is interesting to note that James Griffis’ descendants reverted to the Griffith spelling of the surname. With one exception, all the descendants of James Griffis spelled their surname as ‘Griffith‘. the reason for the reversion to the Griffith spelling is not known. One of the daughters, Abiah, possibly spelled her maiden name as Griffis or Griffiths. [22] Many of his descendants continue to live in Long Island and New England area.
James Griffis and Sarah Totten had seven children. All of his children were baptized under the name of Griffith and other records associated with his children indicate the use of Griffith as a last name. It is interesting to note that church records indicate that the first six children were baptized in a group ceremony on the same day on August 4 in 1797. [23]
Table Three: Children of James William Griffis
| Second Generation of Griffis Family | Third Generation |
|---|---|
| James William Griffis 1758 – 1838 Suffolk Co. NY | Jerusha Griffith (female) 1785 – 1859 Suffolk Co. NY |
| Abiah Griffis (female) 1786 – 1871 Suffolk Co., NY | |
| Sarah Griffith (female) 1787 – 1847 Suffolk Co, NY | |
| Jesse Griffith (male) 1788 – 1855 Suffolk Co., NY | |
| William Griffith (male) 1791 – 1879 Suffolk Co., NY | |
| Peter Griffith (male) 1796 – 1874 Suffolk Co., NY | |
| James Harvey Griffith (male) 1801 – 1883 Suffolk Co., NY |
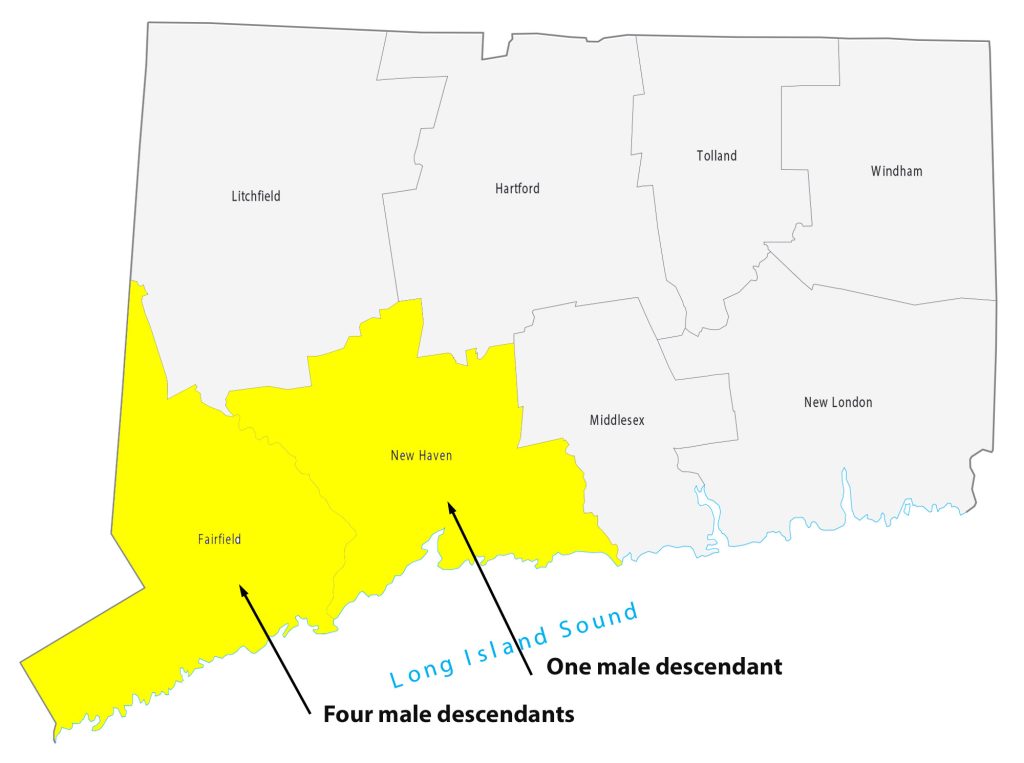
For about 8 generations, there were 53 male descendants of James Griffis. All used the ‘Griffith’ surname. Thirty-seven of the descendants lived in the counties contiguous to or part of the New York City area. Eight lived in Connecticut and four lived in Rhode Island. One descendant lived in Rensselaer county, NY and one lived in Union county, NJ. Four lived in Jefferson county, KY; one is Hidalgo county, TX, Chester County, PA, and Broomfield county, CO.
I have not looked closely at the range of geographical mobility for each of the male descendants. The geographic mobility for most of descendants was limited within the area noted in the table and maps. Henry Vieth Griffith was one notable descendant living outside of the New England area. Military life took him to many places and he appears to have had the most extensive mobility of his descendants over his lifetime.
Illustration Nine: Locations of Descendants of James Griffis in New York State
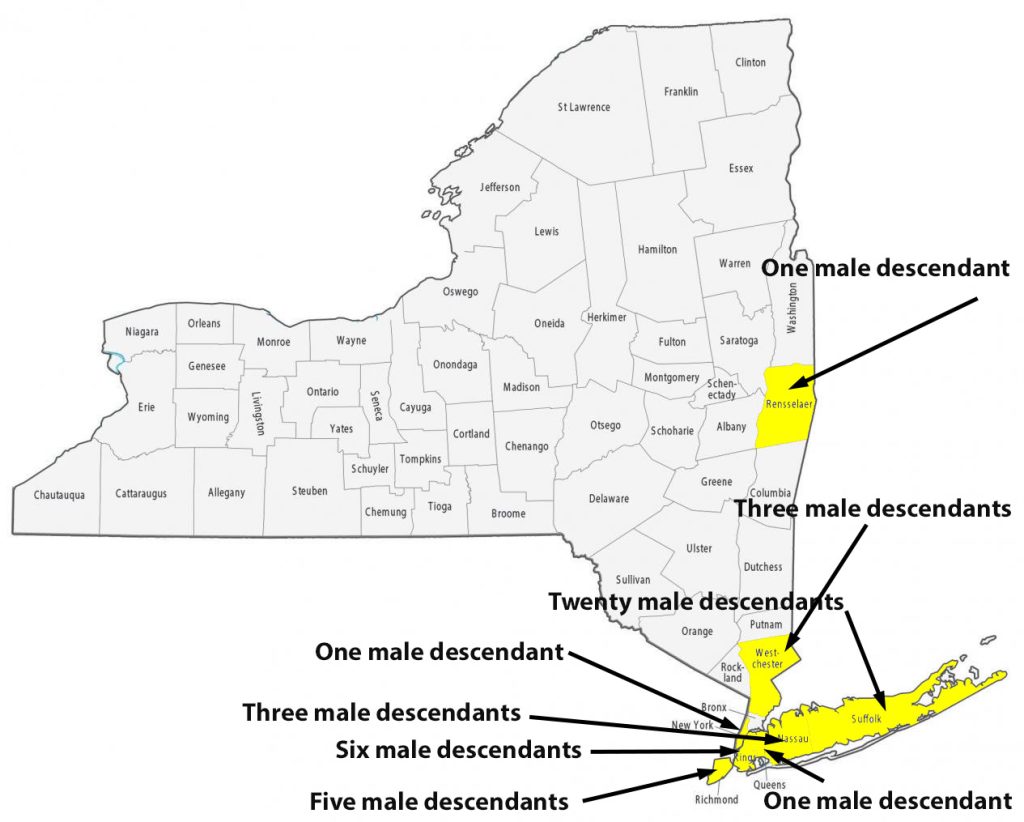
Illustration Ten: Locations of Descendants of James Griffis in Connecticut and Rhode Island
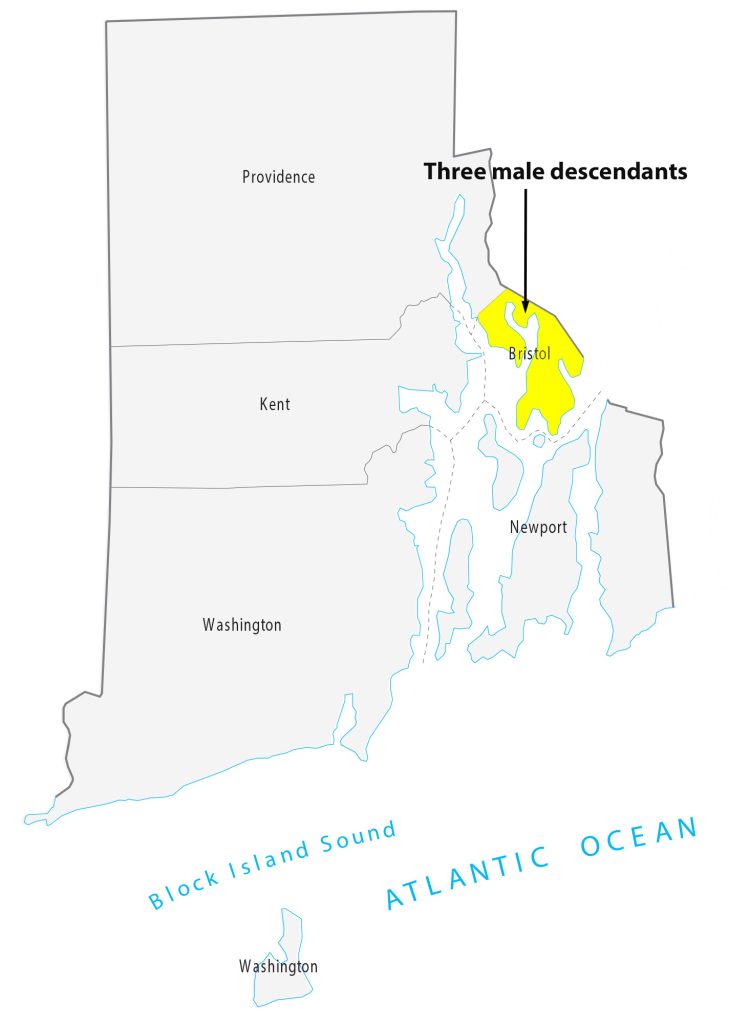
Henry Vieth Griffith’s father, Benjamin Fessenden Griffith, lived in Rhode Island where Henry and his siblings were born. When Henry Vieth Griffith was born on October 17, 1923, in Barrington, Rhode Island, his father, Benjamin, was 26 and his mother, Sara, was 26.
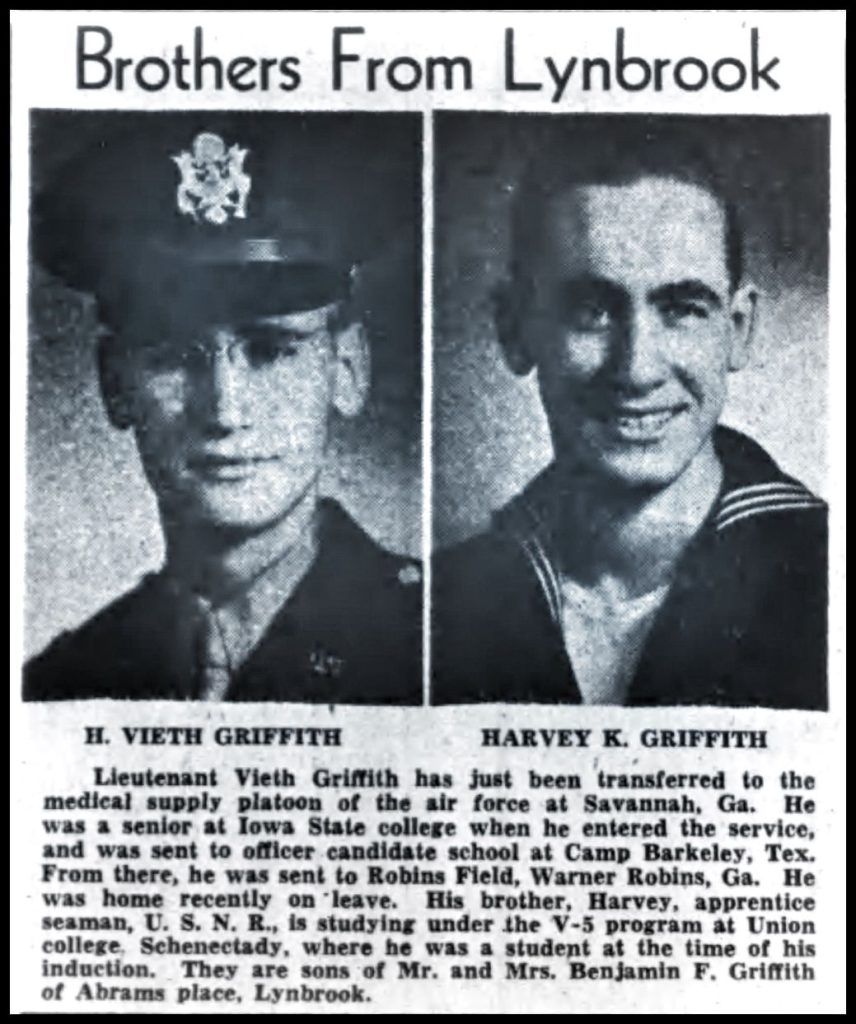
The following is an undated newspaper article about Henry and one of his brothers, Harvey K. Griffith, when they both were in military service during World War II.
Illustration Eleven: Newspaper Article About the Two Griffith Brothers
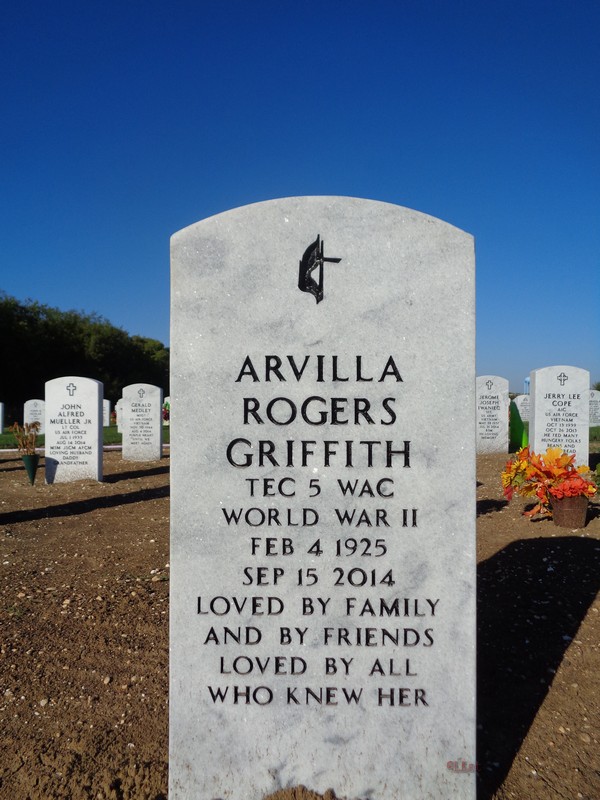
Henry and Arvilla met in Oklahoma City, OK during World War II. They were married on August 17, 1944, in Oklahoma City, Oklahoma. They had a long and event filled life together. Shortly before Arvilla’s death in 2014, they celebrated their 70th wedding anniversary.
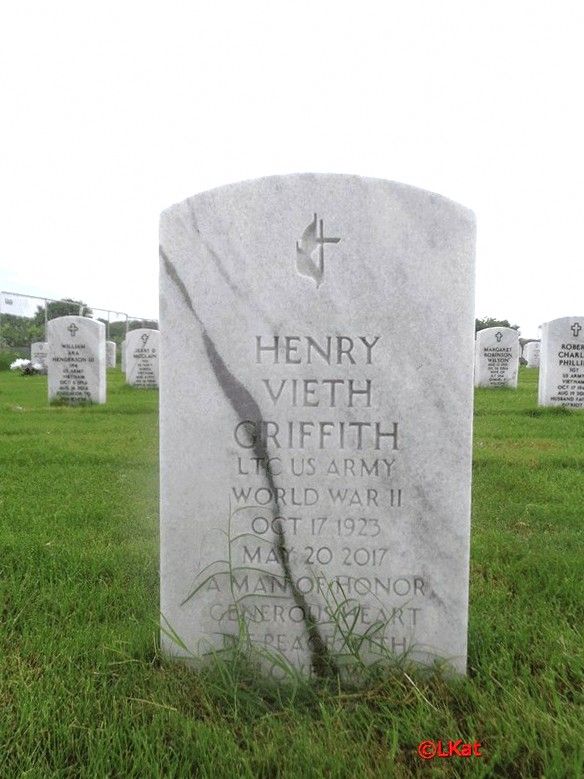
They both were in military service during World War II. Henry made a career out of his military service to the country. While rising their family and following her husband around the world in his military career, Arvilla earned credits at 11 different universities, received her Bachelor’s degree and then went on to obtain her Doctorate in Education. They had five children during their marriage. Their retirement years were spent in southern Texas, Henry passed away on May 20, 2017, in Weslaco, Texas, at the age of 93, and was buried along with Arvilla, in Fort Sam Houston National Cemetery, San Antonio, TX. [24]
Henry or Arvilla or both were evidently were interested in genealogy. This was reflected in Henry completing a Y-DNA test. I only wish I was able to have met Henry and Arvilla before they passed away.
Illustration Twelve: Headstones for Henry Vieth Griffith and Arvilla Rogers Griffith
Sources
The Featured Image at the top of the story is a section of a spreadsheet of Y-DNA test kit results managed by the Haplogroup G-L497 Y-DNA Project. Highlighted rows point to my test kit and Henry Vieth Griffith’s test kit. The chart page displays Y-Chromosome DNA (Y-DNA) STR results that are grouped on the baiss of their similarity on SNP haplogroup results. The columns display each project member’s kit number, paternal ancestry information according to project settings, the paternal tree branch (haplogroup), and actual STR marker results. Above each subgroup, the minimum, maximum and mode values for each STR marker in the subgroup are displayed. STR marker values that differ from the mode values are color-coded.
[1] Andrew Curry, The first Europeans weren’t who you might think, National Geographic, Sept 2019, https://www.nationalgeographic.com/culture/article/first-europeans-immigrants-genetic-testing-feature?loggedin=true&rnd=1676757061299
Early European Farmers, Wikipedia, This page was last edited on 5 February 2023, https://en.wikipedia.org/wiki/Early_European_Farmers
Reich, David Who We are and how We Got Here: Ancient DNA and the New Science of the Human Past. Oxford University Press. 2018
Lazaridis, Iosif; et al. (July 25, 2016). “Genomic insights into the origin of farming in the ancient Near East”. Nature. Nature Research. 536(7617): 419–424. Bibcode:2016Natur.536..419L. doi:10.1038/nature19310. PMC 5003663. PMID 27459054 https://www.ncbi.nlm.nih.gov/pmc/articles/PMC5003663/
González-Fortes, Gloria; et al. (June 19, 2017). “Paleogenomic Evidence for Multi-generational Mixing between Neolithic Farmers and Mesolithic Hunter-Gatherers in the Lower Danube Basin”. Current Biology. Cell Press. 27 (12): 1801–1810. doi:10.1016/j.cub.2017.05.023. https://www.ncbi.nlm.nih.gov/pmc/articles/PMC5483232/
Lazaridis, Iosif (December 2018). “The evolutionary history of human populations in Europe”. Current Opinion in Genetics & Development. Elsevier. 53: 21–27. arXiv:1805.01579. doi:10.1016/j.gde.2018.06.007https://www.sciencedirect.com/science/article/abs/pii/S0959437X18300583
Shennan, Stephen (2018). The First Farmers of Europe: An Evolutionary Perspective. Cambridge World Archaeology. Cambridge University Press. doi:10.1017/9781108386029. ISBN 9781108422925
Nikitin, Alexey G.; et al. (December 20, 2019). “Interactions between earliest Linearbandkeramik farmers and central European hunter gatherers at the dawn of European Neolithization”. Scientific Reports. Nature Research. 9 (19544): 19544. https://www.ncbi.nlm.nih.gov/pmc/articles/PMC6925266/
[2] Maciamo Hay, Haplogroup G2a, Eudepia, Last update January 2021, https://www.eupedia.com/europe/Haplogroup_G2a_Y-DNA.shtml
[3] The following graphics illustrate the smaller sample size of Y-DNA test data for the G Haplogroup managed by Family Tree DNA (FTDNA), source: 2020 Review Of Big Y, FTDNA Blog, Feb 1, 2021, https://blog.familytreedna.com/2020-review-of-big-y/
[4] Rob Spencer, Case Studies in Macro Genealology, Presentation for the New York Genealogical and Biographical Society, July 2021, http://scaledinnovation.com/gg/ext/NYG&B_webinar.pdf
Rob Spencer, The Big Picture of Y STR Patterns, The 14th International Conference on Genetic Genealology, Houston, TX, March 22-24, 2019, http://scaledinnovation.com/gg/ext/RWS-Houston-2019-WideAngleView.pdf
Rob Spencer, Genetic Genealogy at the Library, Mystic and Noank Library October17, 2019, http://scaledinnovation.com/gg/mnl/mnl3.pdf ; October 10, 2019 http://scaledinnovation.com/gg/mnl/mnl2.pdf; October 7, 2019 http://scaledinnovation.com/gg/mnl/mnl1.pdf
[5] Scott Miller, Ten Facts About the American Economy in the 18th Century, George Washington”s Mount Vernon, https://www.mountvernon.org/george-washington/colonial-life-today/early-american-economics-facts/
Peter H. Lindert and Jeffrey G. Williamson, American Colonial Incomes, 1650-1774, Working Paper 19861, National Bureau of Economic Research, Cambridge, MA, January 2014, https://www.nber.org/system/files/working_papers/w19861/w19861.pdf`
[6] Peter Kalm’s Travels in North America: The English Version of 1770, revised from the original Swedish and edited by Adolph B. Benson (Wilson-Erickson, 1937); reprint edition (Dover, 1966), p. 211.
[7] Franklin, Benjamin. 1751 / 1959. “Observations Concerning the Increase of Mankind, Peopling of Countries, etc.,” in The Papers of Benjamin Franklin, Volume IV, edited by Leonard W. Larabee. New Haven, Conn.: Yale University Press. pp. 227-228
Malthus, Thomas Robert. 1798 / 1920. An Essay on the Principle of Population. London. Reprinted for the Royal Economic Society, London: 1920. pp. 105-106
[8] Rob Spencer, Case Studies in Macro Genealology, Presentation for the New York Genealogical and Biographical Society, July 2021, http://scaledinnovation.com/gg/ext/NYG&B_webinar.pdf
Rob Spencer, The Big Picture of Y STR Patterns, The 14th International Conference on Genetic Genealology, Houston, TX, March 22-24, 2019, http://scaledinnovation.com/gg/ext/RWS-Houston-2019-WideAngleView.pdf
[9] This image is the result of plugging in a GED file of my family tree into a javascript program build by B.F. Lyon, Exploring Family Trees (Beta), On-line Visualization https://learnforeverlearn.com/ancestors/?fbclid=IwAR0OJcmL83m2WRI0mnuCp26h-14btQ2MWGaTGmdpPECkP0VvkCKY4IptI9w
Features of a Web-Based Family Tree Visualization Tool, Sep 20, 2105, http://familytreeviz.blogspot.com/2015/09/features-of-family-tree-visualization.html
[10] Maciamo Hay, Haplogroup G2a, Eudepia, Last update January 2021, https://www.eupedia.com/europe/Haplogroup_G2a_Y-DNA.shtml
[11] The Y-chromosome DNA (Y-DNA) Results Colorized report headings are color-coded in two ways. First, each testing level (Y-DNA1-12, Y-DNA13-25, Y-DNA26-37, Y-DNA38-67, and Y-DNA68-111) is coded with a different shade of blue. Second, the STR (short tandem repeat) markers that have faster mutation rates and are more likely to change within the genealogical time frame are coded with a red background.

The Y-chromosome DNA (Y-DNA) results chart is color coded to show where someone in a subgroup differs from the calculated modal value for an STR (short tandem repeat) marker. For each step less than the modal value, a progressively darker shade of blue is used for the background color. For each step greater than the modal value, a progressively darker shade of pink is used for the background color.

Understanding the Y-DNA Results Colorized Report, FTDNA Help Center, https://help.familytreedna.com/hc/en-us/articles/4503464738319#accessing-the-y-dna-results-colorized-report-0-0
[12] The GD estimates and estimated number of Generations is based on FTDNATiP™ Reports, Most Recent Common Ancestor Time Predictor based on Y-STR Genetic Distance
Understanding Y-DNA Genetic Distance, FTDNA Help Center, https://help.familytreedna.com/hc/en-us/articles/6019925167631-Understanding-Y-DNA-Genetic-Distance
Concepts – Genetic Distance, DNAeXplained – Genetic Genealogy,, Blog, 29 June 2016, https://dna-explained.com/2016/06/29/concepts-genetic-distance/
[13] Time Predictor Estimates related to FTDNATiP™ Reports:
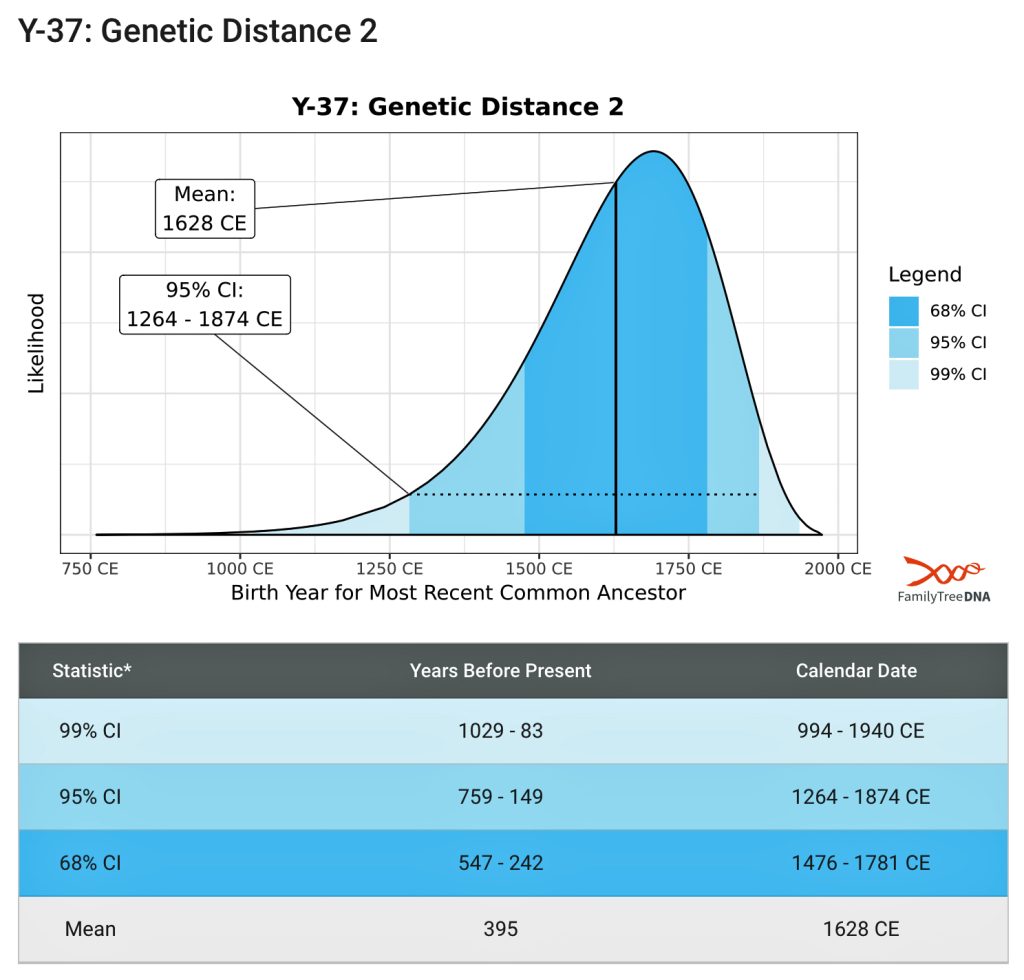
The Time Predictor (TiP), or FTDNATiP™, is a proprietary program that incorporates Y-chromosome DNA STR mutation rates to increase the power and precision of estimates of Time to Most Recent Common Ancestor (TMRCA). It is a tool provided by FTDNA which allows for a probabilistic comparison between two Y-STR haplotypes to determine the time to the most recent common ancestor (TMRCA). The program incorporates marker-specific mutation rates to increase the power and precision of the TMRCA estimates.
[14] Rob Spencer, Case Studies in Macro Genealology, Presentation for the New York Genealogical and Biographical Society, July 2021, http://scaledinnovation.com/gg/ext/NYG&B_webinar.pdf
Rob Spencer, The Big Picture of Y STR Patterns, The 14th International Conference on Genetic Genealology, Houston, TX, March 22-24, 2019, http://scaledinnovation.com/gg/ext/RWS-Houston-2019-WideAngleView.pdf
[15] John and Sheila Rowlands, The Use of Surnames, Chapter 4, Patronymic Naming – A Survey in Transition, Llandysul, Ceredigion: Gomer Press, 2013, Figure 4-3: Decay in the use of patronymic naming to the 10% level, Page 56
[16] Shiela Rowlands, Sources of Surnames in John and Shiela Rowlands, ed, Stages in Researching Welsh Ancestry. Bury, England: The Federation of Family History Societies Publications Ltd., 1999. Pages 153 and 159
Although we are focused on individuals with the Griffith surname in the 1700’s in the American colonies, the prevalence of the Griffith surname has been documented in Wales in the 1800’s. Based on an analysis of census data in Wales in 1850, the top ten most common names represented approximately 80 percent of the Welsh population. While these names were common, it does not imply they were related.
The result of using similar names as surnames resulted in the lack of diversity in surnames in Wales, see: John Rowlands, The Homes of Surnames in Wales in John Rowlands and Shiela Rowlands, ed, Stages in Researching Welsh Ancestry. Bury, England: The Federation of Family History Societies Publications Ltd., 1999. Page 162
Durie, Bruce, Welsh Genealogy, Stroud, United Kingdom: The History Press, 2013, Page 27
John Rowlands, The Homes of Surnames in Wales, in John and Shiela Rowlands, ed, Stages in Researching Welsh Ancestry. Bury, England: The Federation of Family History Societies Publications Ltd., 1999. Page 162-164
John and Sheila Rowlands, The Use of Surnames, Chapter 4, Patronymic Naming – A survey in Transition, Llandysul, Ceredigion: Gomer Press, 2013, Pages 50-57
[17] Rob Spencer, Y STR Clustering and Dendrogram Drawing, Tracking Back: a website for genetic genealogy tools, experimentation, and discussion, http://scaledinnovation.com/gg/clustering.html
The data was from:
Family Tree DNA L-497 Project, DNA Results, https://www.familytreedna.com/groups/g-ydna/about
[18] “All things considered, 33 years per male generation is more accurate than 30 and a reasonable choice for the eras of interest in STR genealogy. ”
Rob Spencer, tMRCA Estimation from STR Data, Revisited, Tracking Back: a website for genetic genealogy tools, experimentation, and discussion, http://scaledinnovation.com/gg/gg.html?rr=strByMu
[19] David Vance, The Life of Trees (Or: Still Another Phylogeny Program),SAPP Tree Generator V4.25, http://www.jdvsite.com
Dave Vance, Y-DNA Phylogeny Reconstruction using likelihood-weighted phenetic and cladistic data – the SAPP Program, 2019, academia.edu, https://www.academia.edu/38515225/Y-DNA_Phylogeny_Reconstruction_using_likelihood-weighted_phenetic_and_cladistic_data_-_the_SAPP_Program
The following provides an explanation of the structure of the phylogenetic tree;
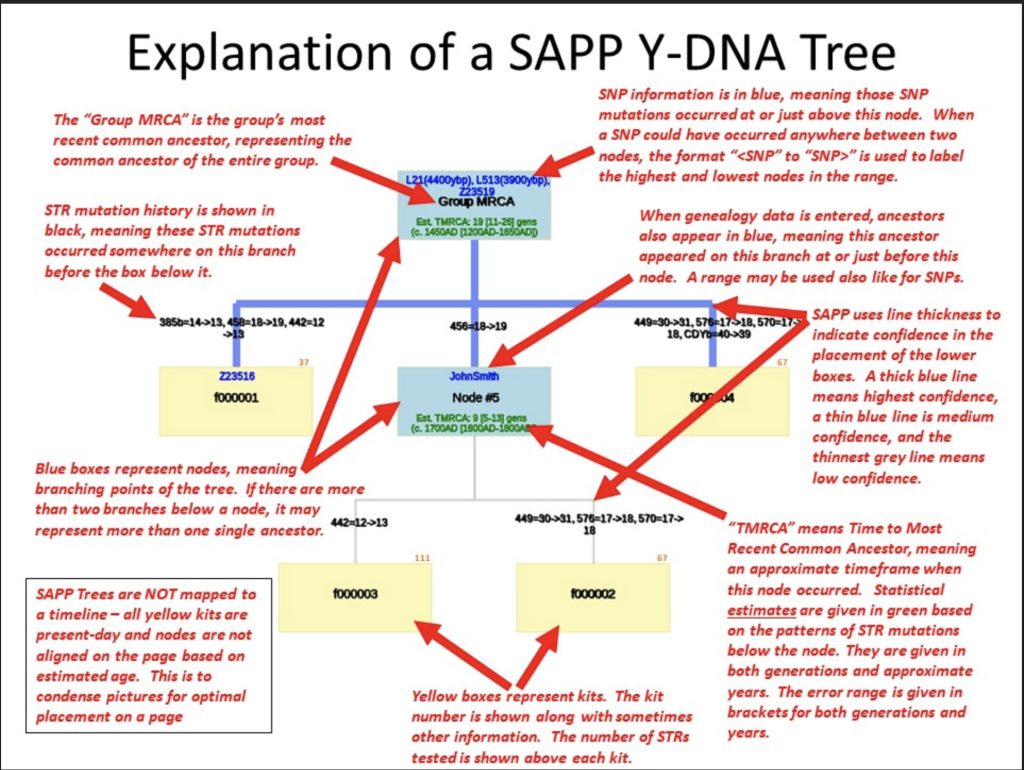
Source: David Vance, Output, The Life of Trees (Or: Still Another Phylogeny Program),SAPP Tree Generator V4.25, https://www.jdvsite.com/outputs/
[20] Source: Page 13 of a readable transcript of the narration in a YouTube at https://drive.google.com/open?id=1CdU…, The video is by J. David Vance, DNA Concepts for Genealogy: Y-DNA Testing Part 1, 10 Oct 2019, https://youtu.be/RqSN1A44lYU
[21] Gruffudd Genealogies: Griffi(th(n)(s)(ng) Surname DNA Project. Website no longer updated., links are not working. http://griffdna.org/pedigrees.html#griffis
“The Griffi(th)(s)(n)(ng) surname project is intended to provide an avenue for connecting the many branches of Griffith, Griffin, Griffis, and other forms of the surname. The patronymic naming system, practiced in Wales into the latter 18th century, makes this task more difficult. Evan, Thomas, Johns, Jones, Rees, Owen, and many other common Welsh names may share common male ancestors. Surnames included in the project include: Griffen, Griffeth, Griffeths, Griffets, Griffett, Griffin, Griffing, Griffis, Griffit, Griffith, Griffiths, Griffitth, etc.”
“For the results to be meaningful, participants will need to share their direct male line ancestry back to the earliest known GRIFFITH/GRIFFIN/GRIFFIS/etc., either in the form of a pedigree chart, family group sheets, or electronic GEDCOM files. Living persons should be excluded from the documentation.”
[22] References to Abia’s marriage to Simon half indicate her name was Abiah Griffis. Baldwin, Evelyn Briggs contributed by, Marriages and Baptisms Performed by Rev. Joshua Hartt of Smithtown , Long Island, with a Sketch of his Life, New York Genealogical and Biographical Record, Vol 42, April 1911, July 1911 . Page 278.
References to Abiah burial, indicate her name as “Abiah Griffiths Haff”, Find A Grave Website, memorial no. 206641461, Hauppauge Rural Cemetery Hauppauge, Suffolk County, New York, USA
[23] Baldwin, Evelyn Briggs contributed by, Marriages and Baptisms Performed by Rev. Joshua Hartt of Smithtown , Long Island, with a Sketch of his Life, New York Genealogical and Biographical Record, Vol 42, April 1911, July 1911 .
[24] Arvilla Rogers Griffith, Obituary, Valley morning Star, 18 Sep 2014, Page 8, Harlingen, TX. PDF available.
Henry V. Griffith, Find My Grave, Memorial ID: 180803329, Plot section 47A site 49 https://www.findagrave.com/memorial/180803329/henry-v.-griffith
Arvilla Rogers Griffith, Find My Grave, Memorial ID: 136333620, Plot Section 47A Site 48 https://www.findagrave.com/memorial/136333620/arvilla-rogers-griffith
