
This story is the fourth part of a continuation of my focus on the G Haplogroup phylogenetic tree of the Griff(is)(es)(ith) patrilineal line of descent. The story discusses the migratory route of the Griffis family Y-DNA in the long term genealogical time layer.
This fourth part of the story focuses on examining possible macro social-cultural and enviromental influences that may explain the lack of identified subclades (ancestors) in the migratory path of the Griffis genetic paternal line. The period of time is roughly between 3000 BC and 650 CE.
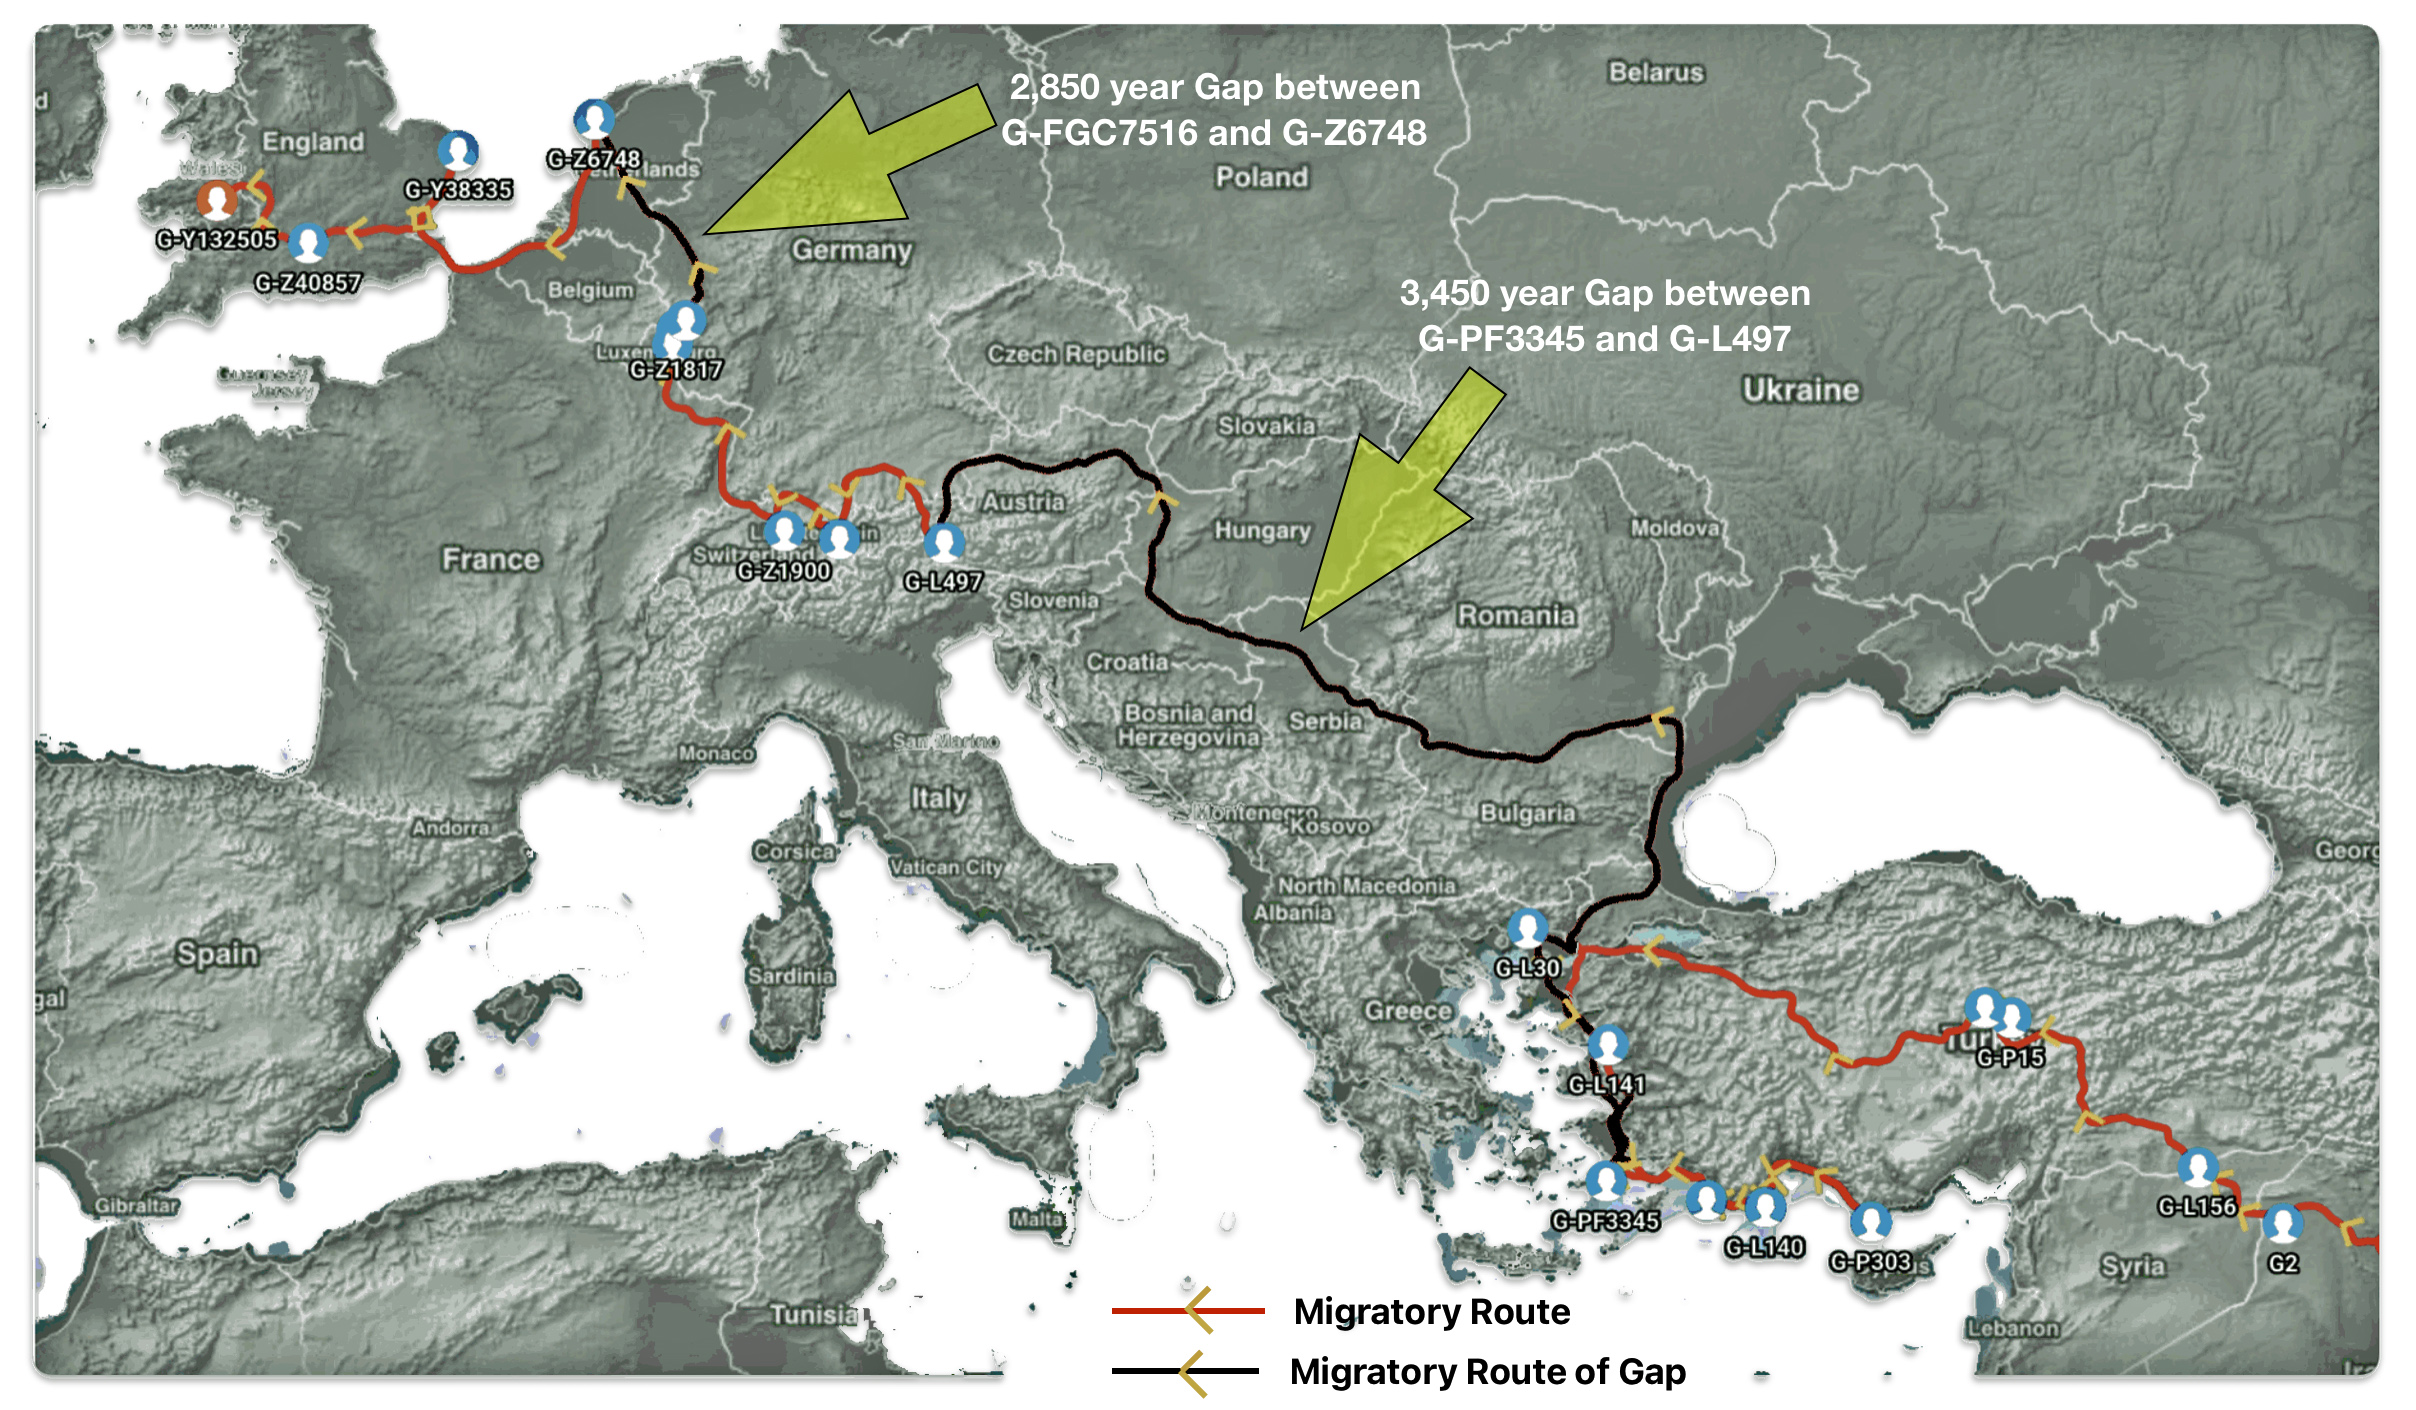
The 2,850 year Gap between G-FGC7516 and G-Z6748: This phylogenetic gap was associated with haplogroup G-FGC477. This common ancestor was born around 2200 BCE. The next genetic ancestor on the Griff(is)(es)(ith) YDNA line was associated with the genetic SNP mutation defining the G-Z6748 haplogroup, 2,850 years later. This gap represents about 95 generations.
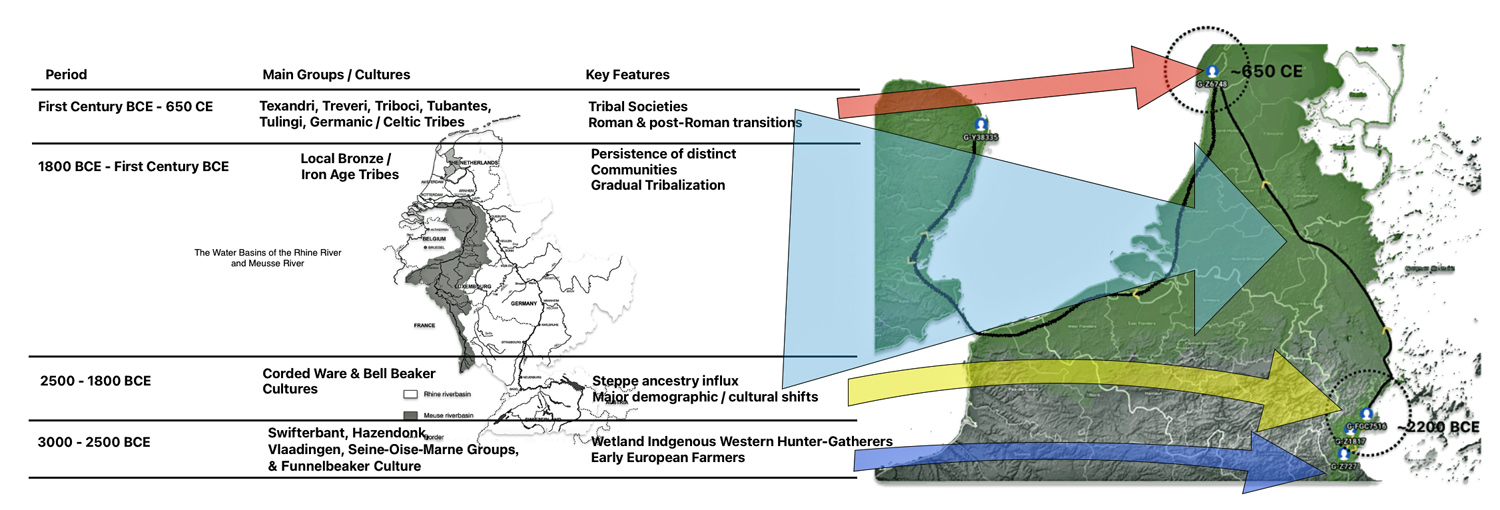
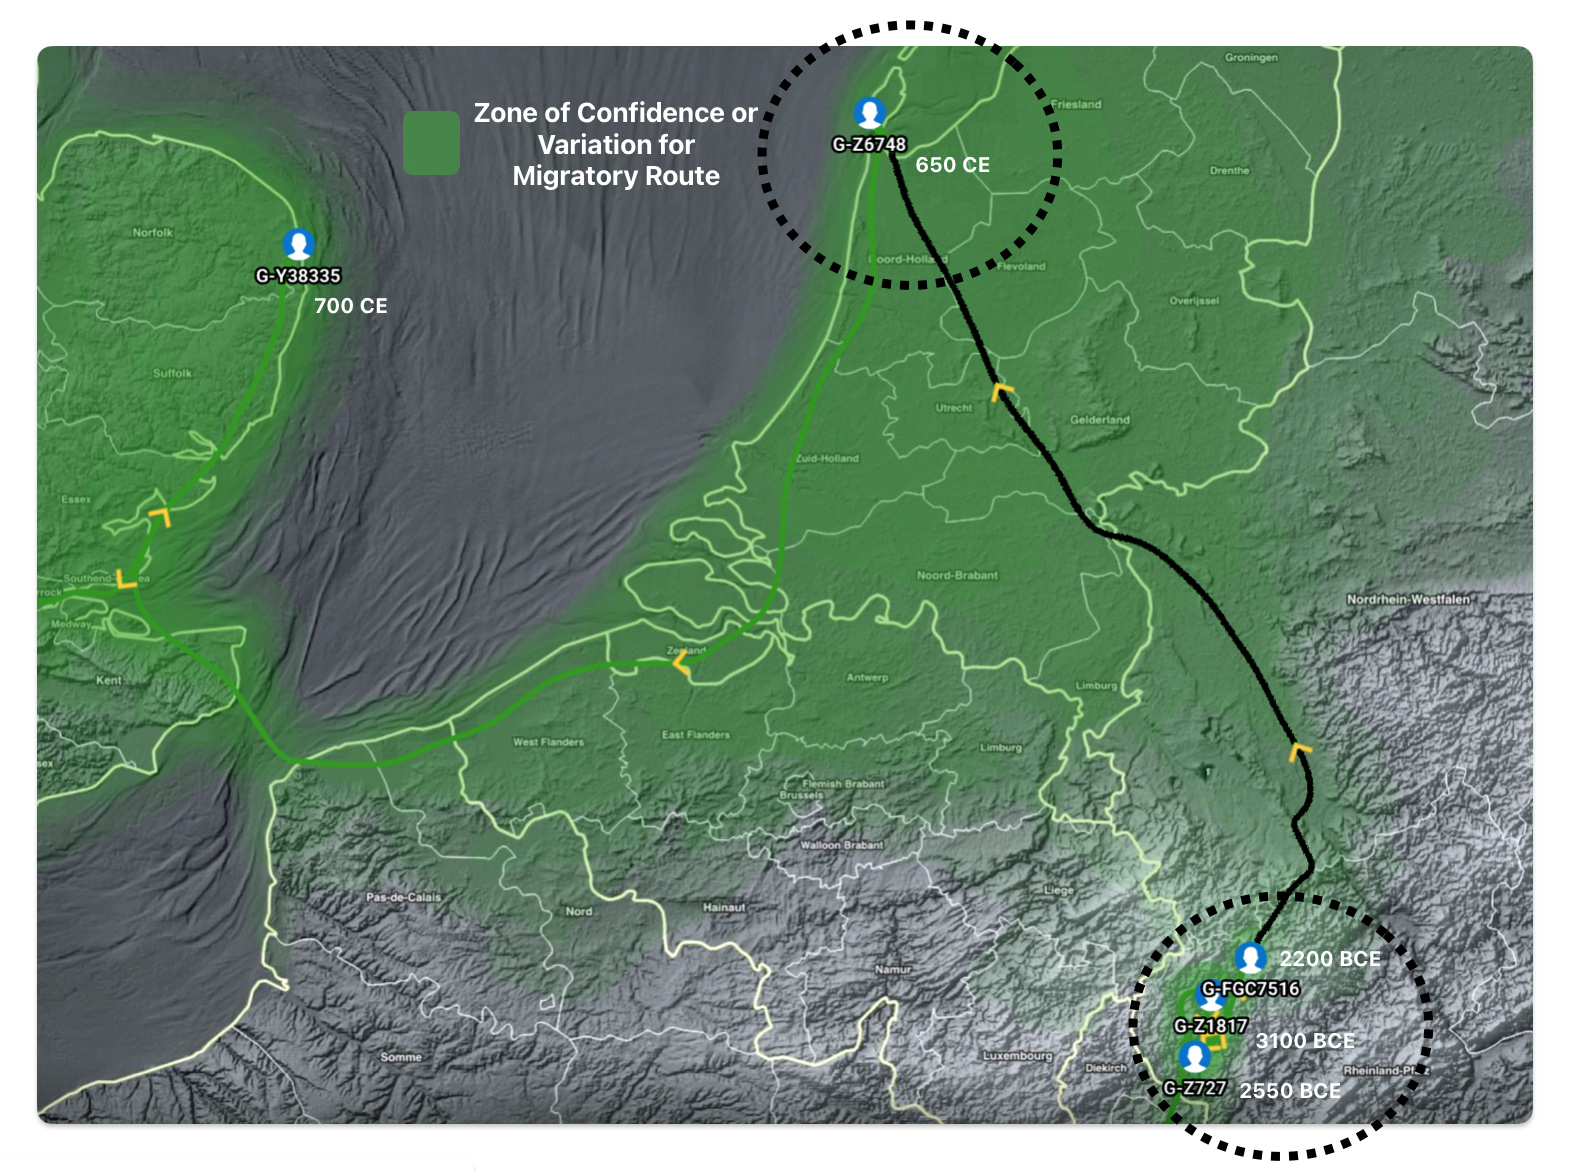
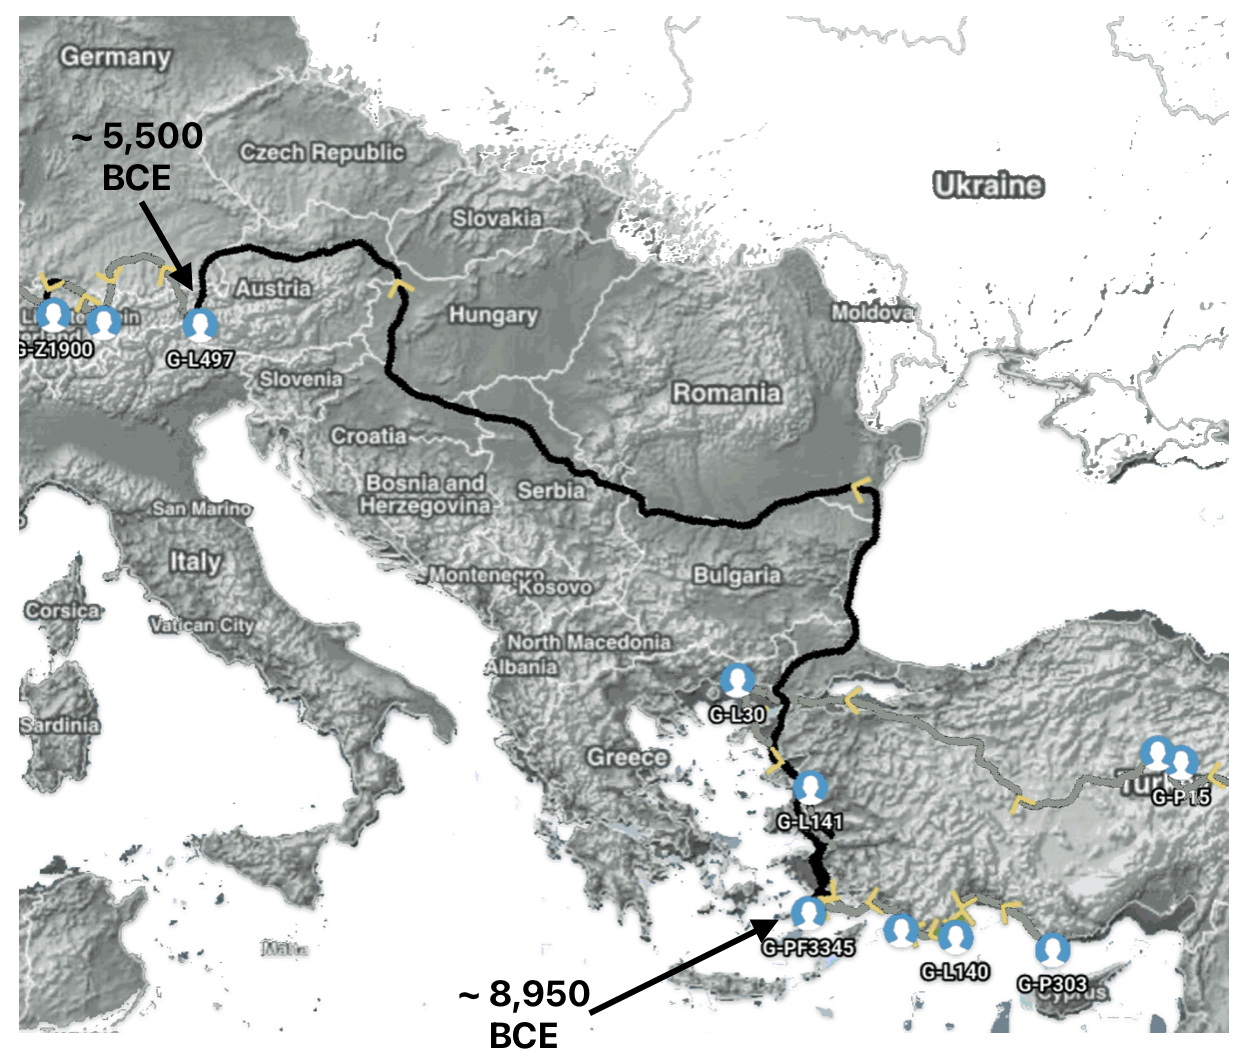
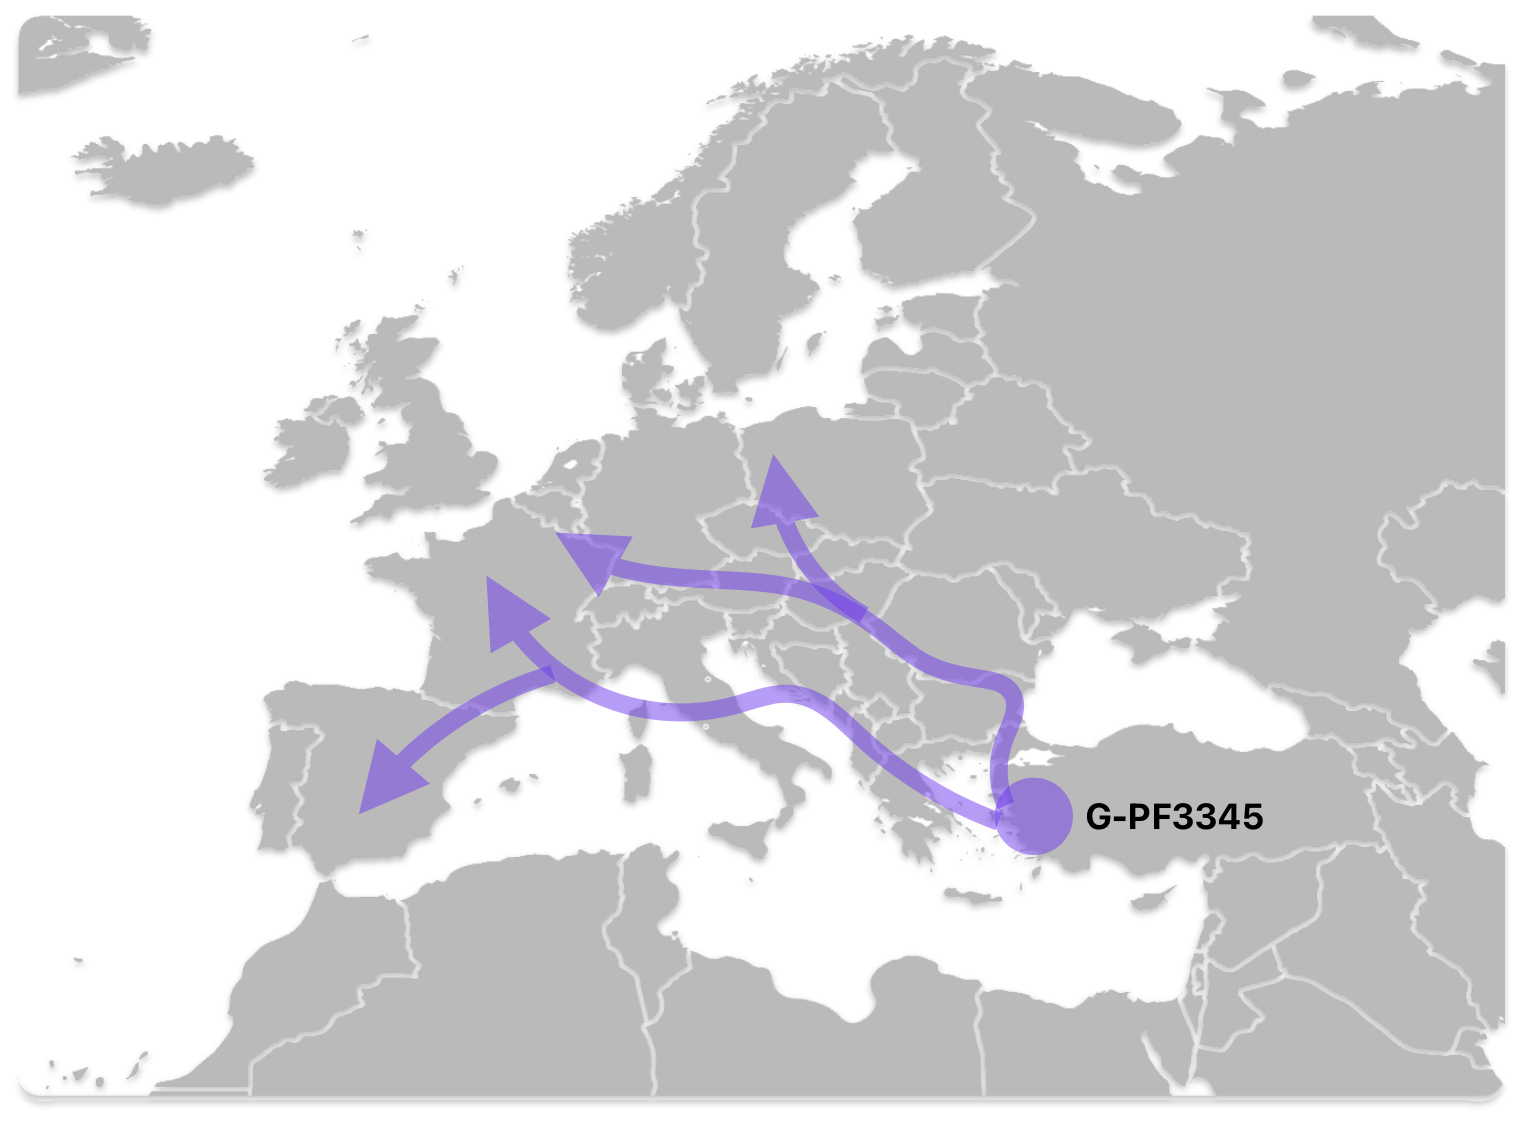
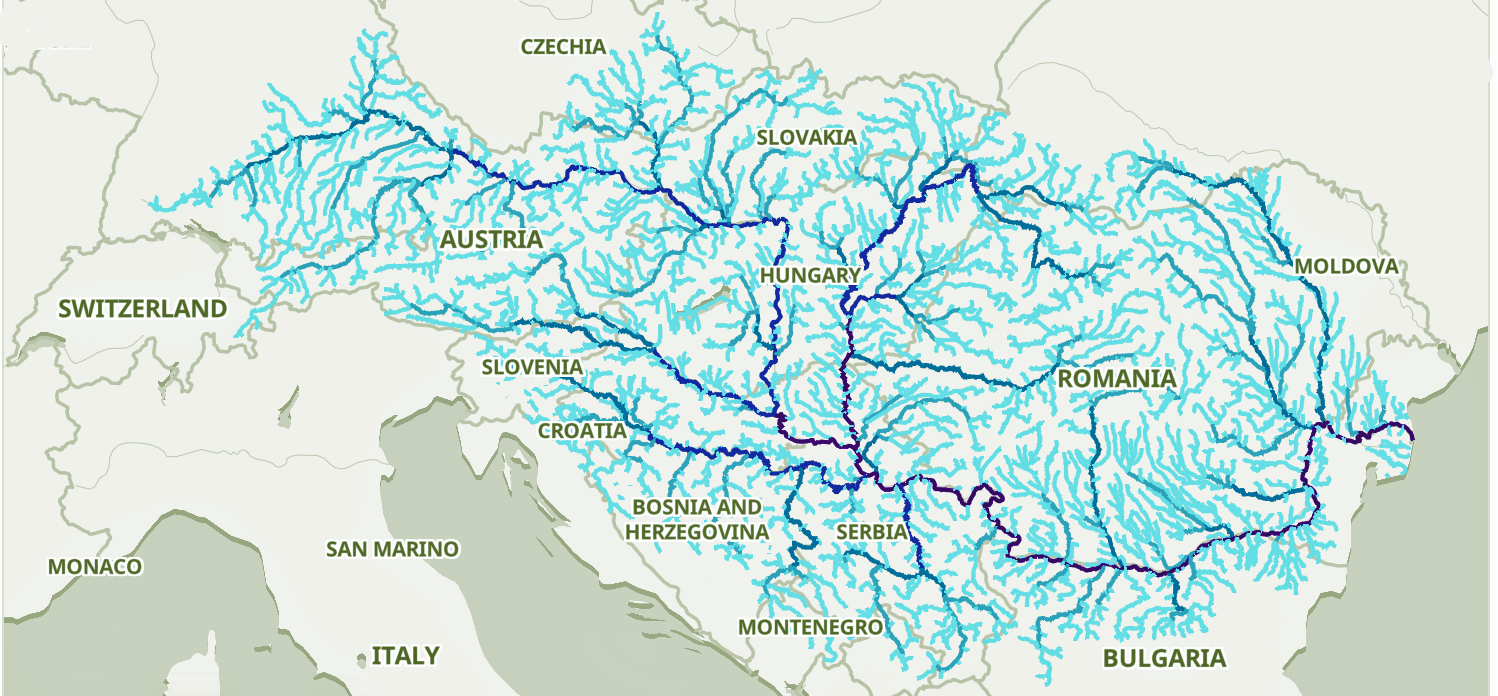
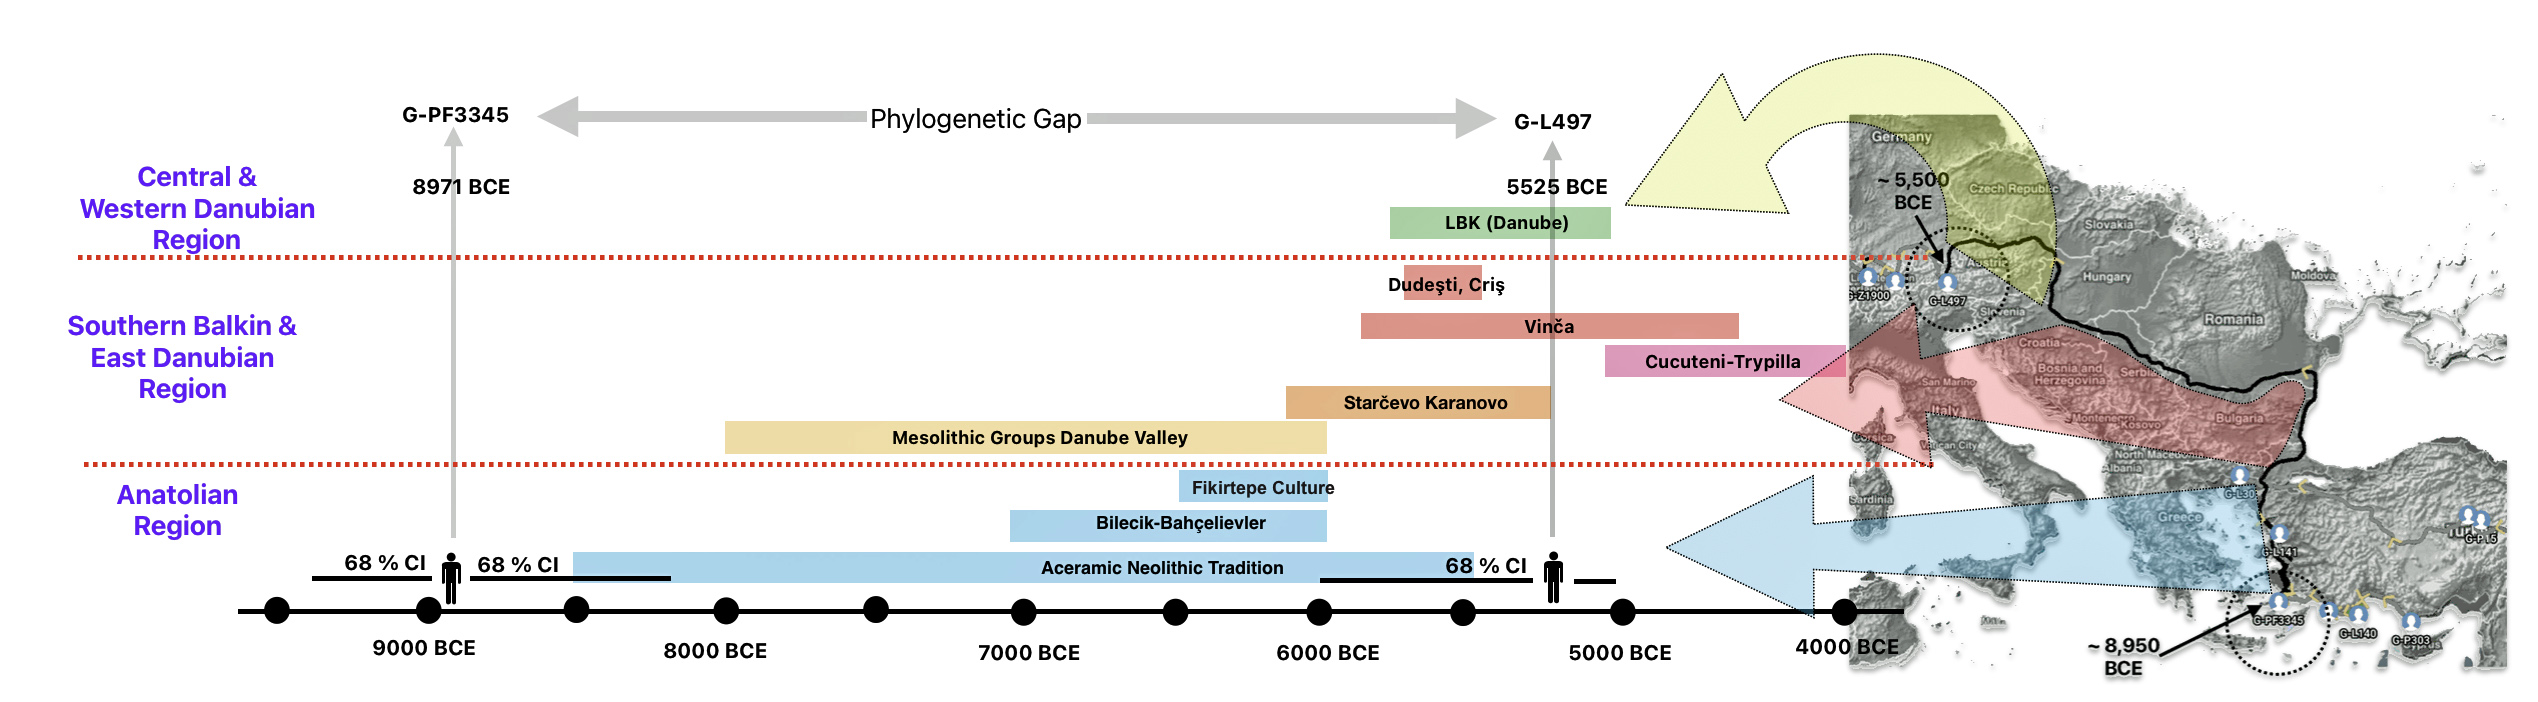
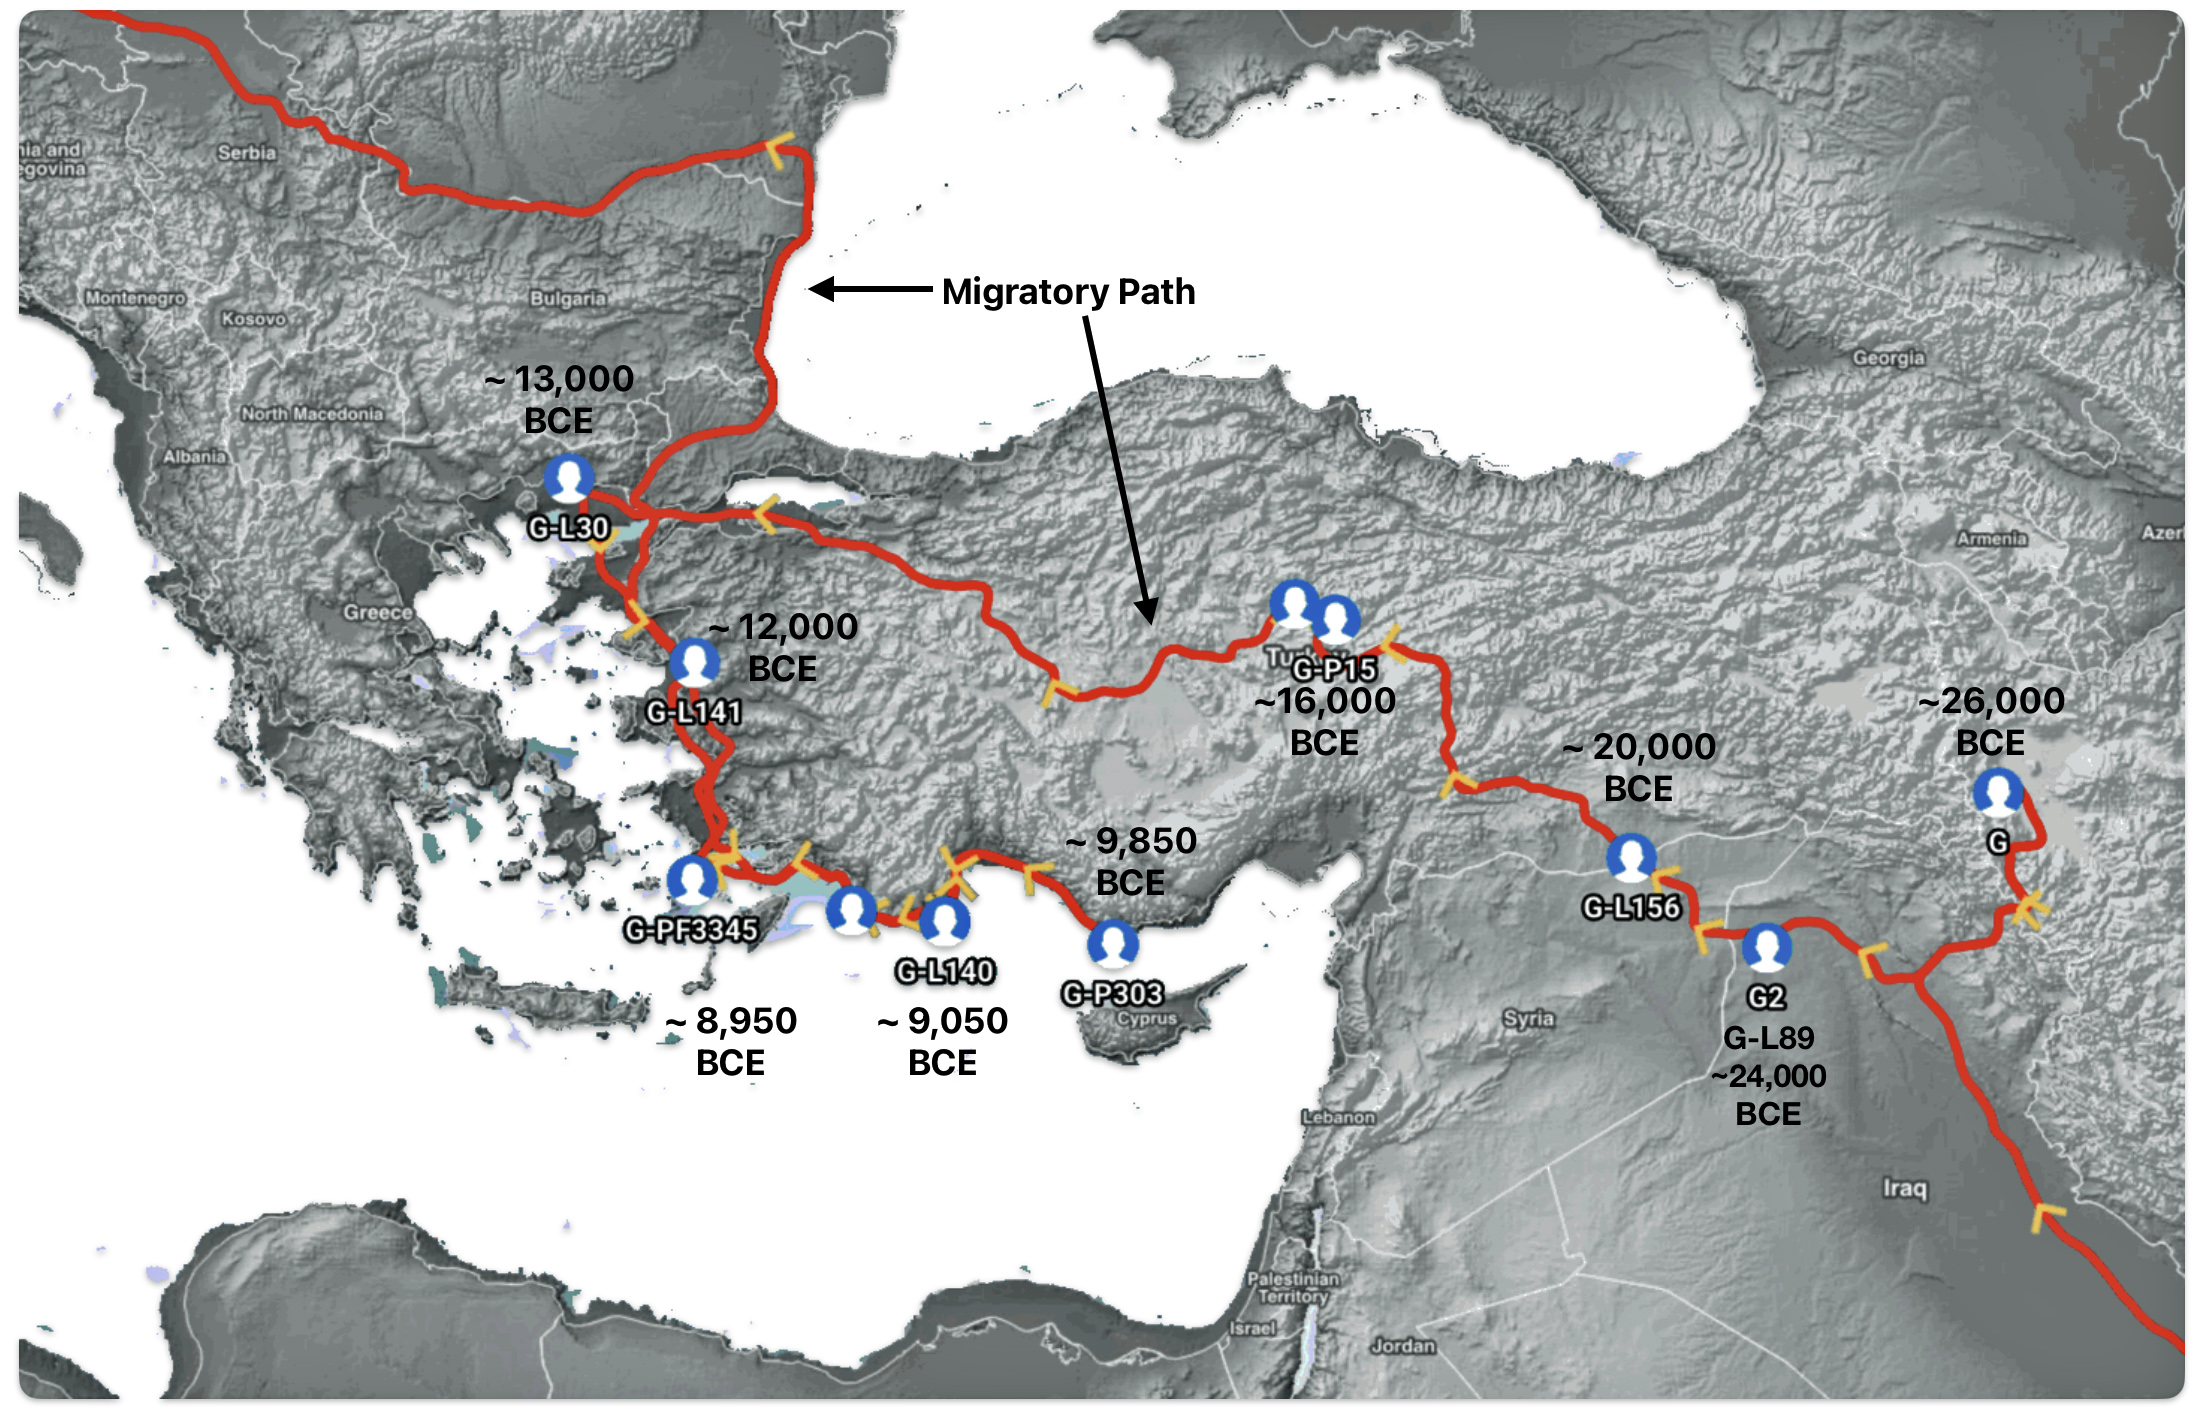
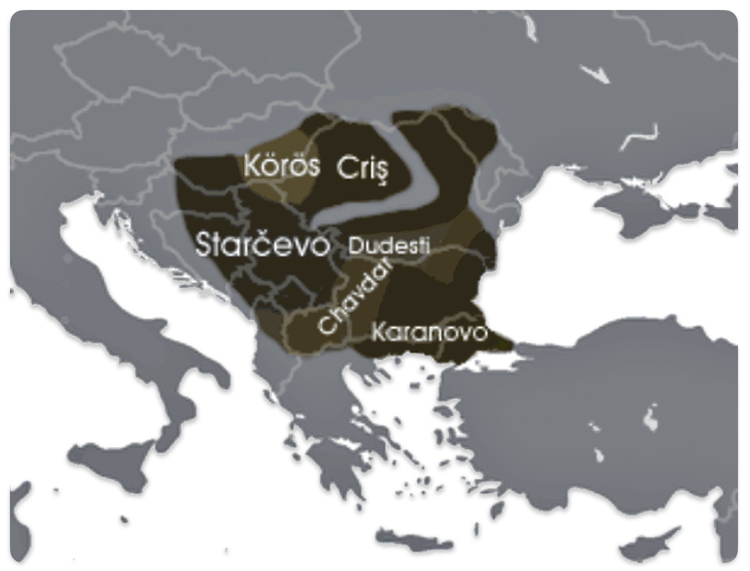
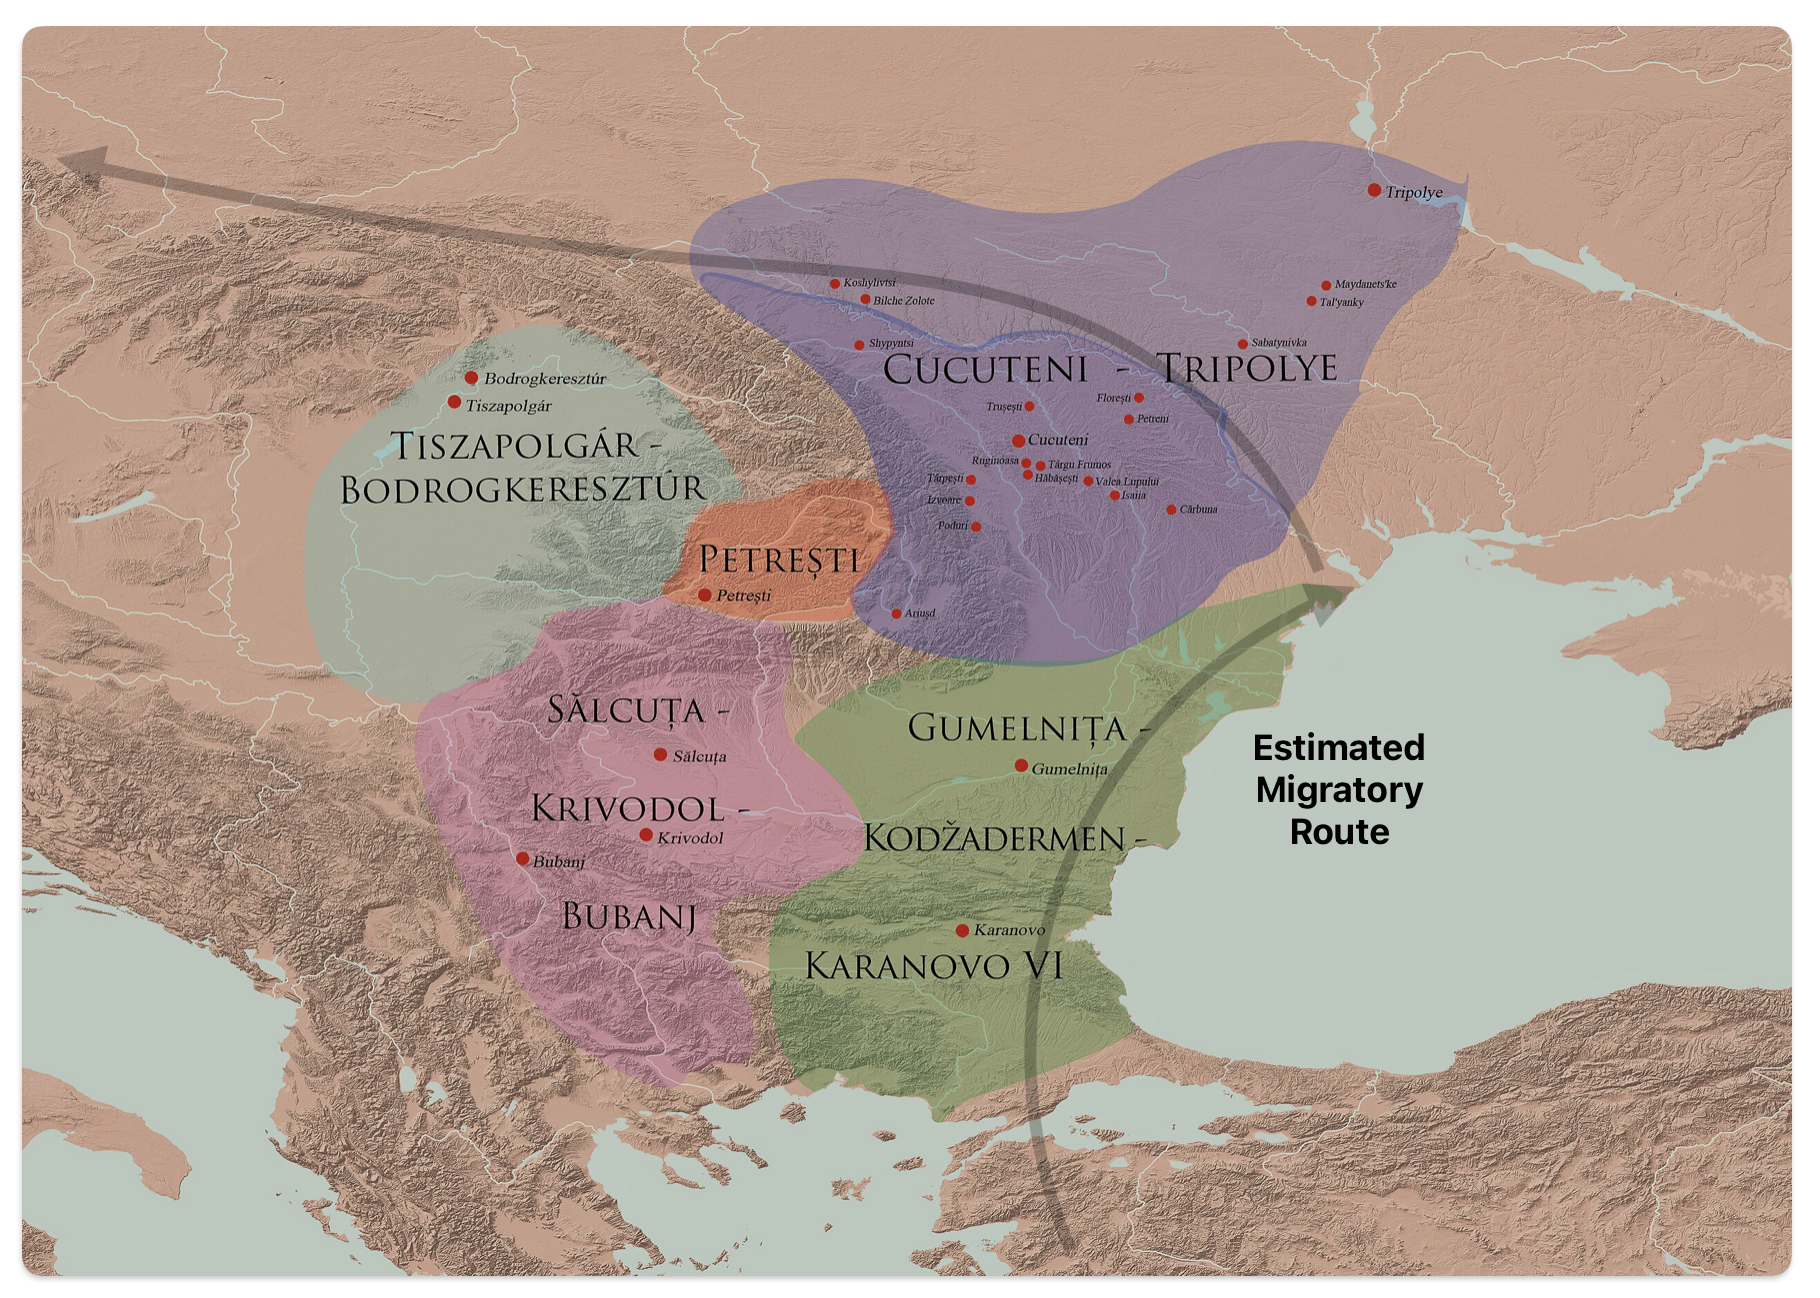
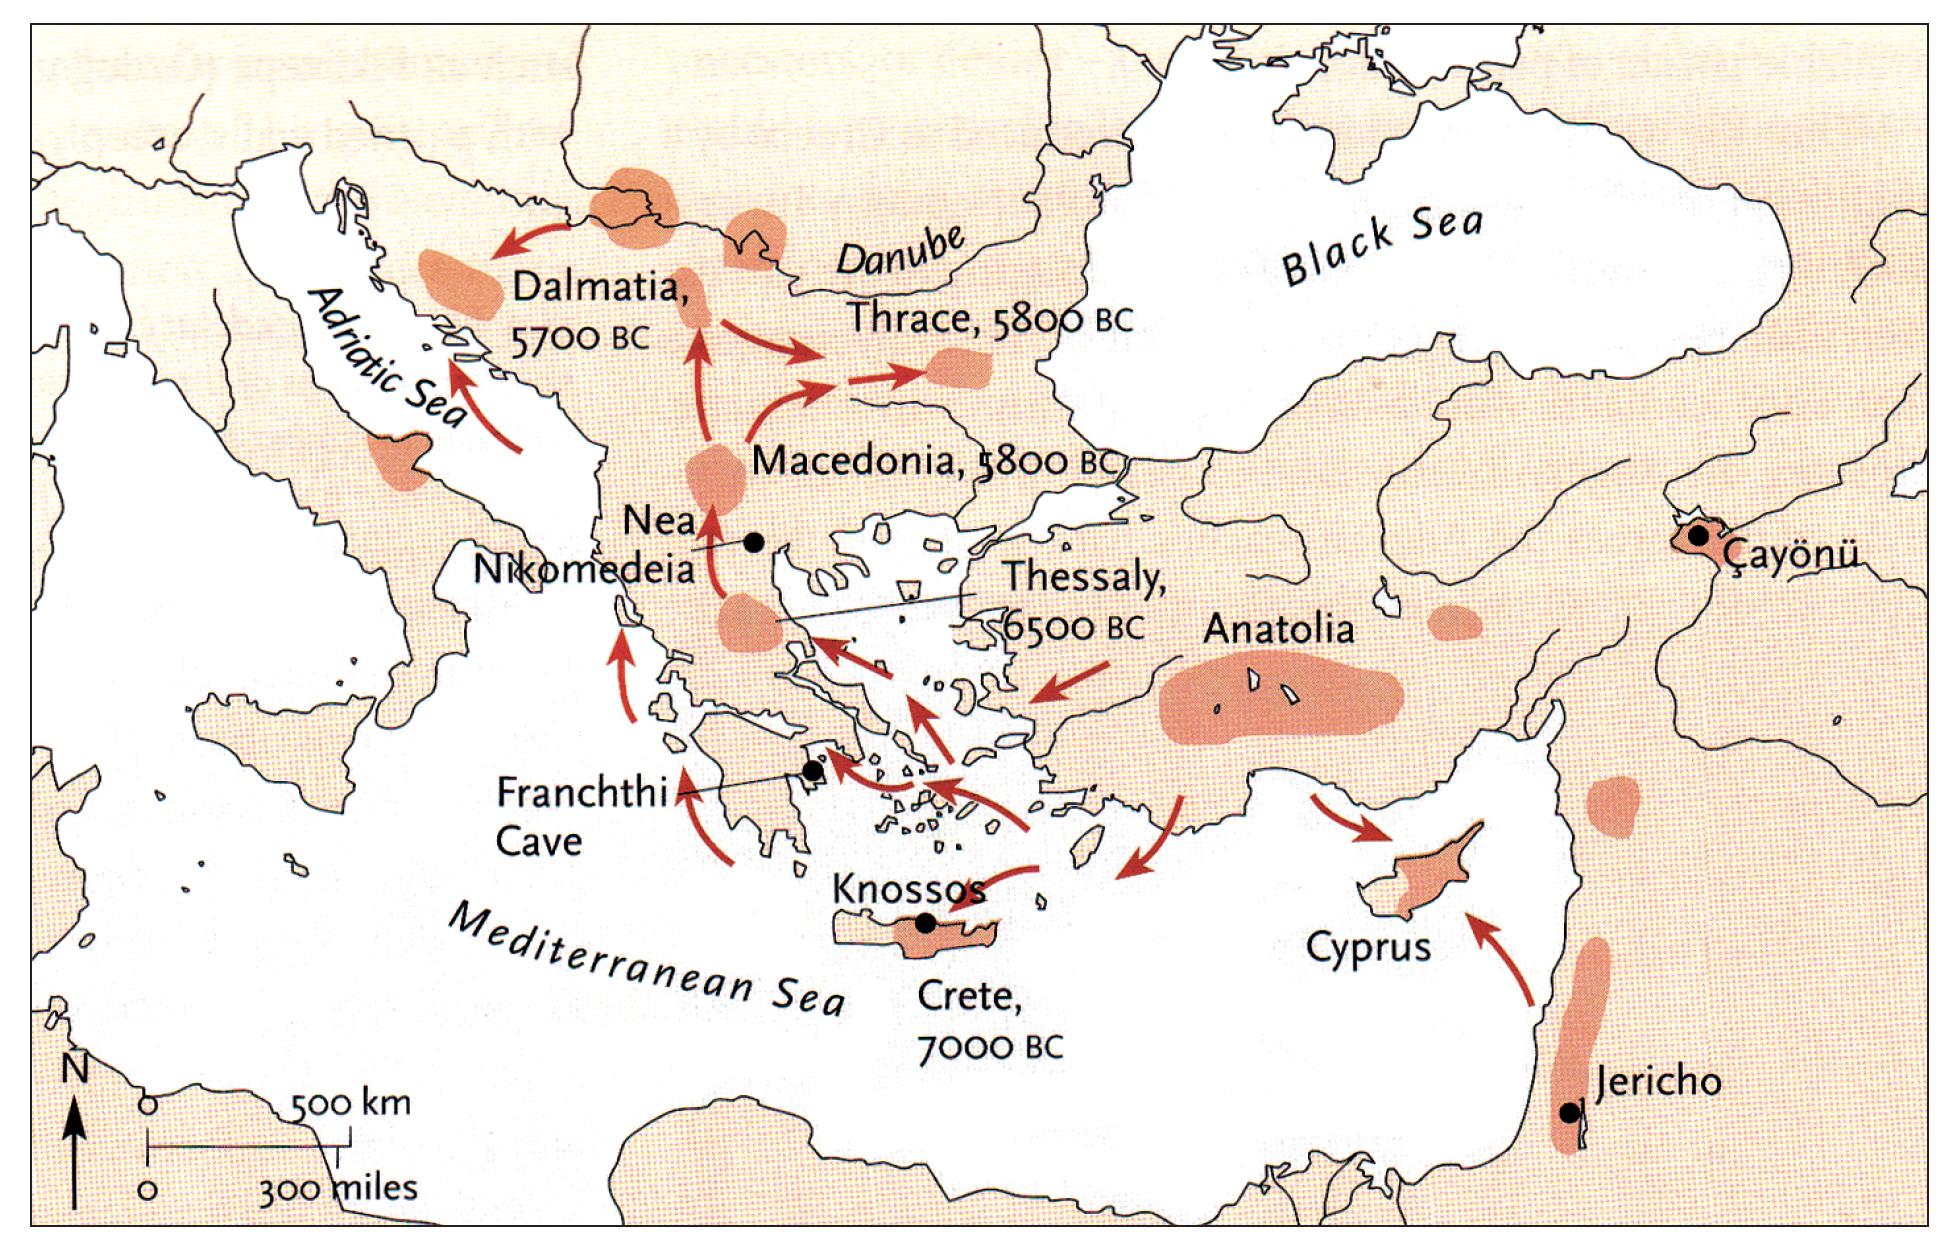
Illustration one depicts the estimated migratory path of the Griff(is)(es)(ith) paternal genetic line. The first ‘phylogenetic gap’, depicted in the center of illustration one below, generally coincides with the migratory path of the Early European Farmers that followed the Dunube RIver watershed. Similar to the first phylogenetic gap that was discussed in a previous story, the second phylogenetic gap, depicted in the upper left hand portion of illustration one, follows another major European river watershed: the Meuse and Rhine River watersheds.
Illustration One: The Two Phylogenetic Gaps
The Genetic Gap Between G-FGC7516 and G-Z6748
As reflected in table one below,, there are three most recent common genetic ancestors (MRCAs) associated with YDNA G haplogroups that are at the beginning of the second phylogenetic gap. They are estimated to have lived fairly close to each other in an area between the modern Gernman-Luxembourg border and the Mosel River (as depicted in illustration one above and five below). Their estimated dates of birth are between 2550 BCE and 2250 BCE.
Table One: G Haplogroups Associated with the Phylogenetic Gap
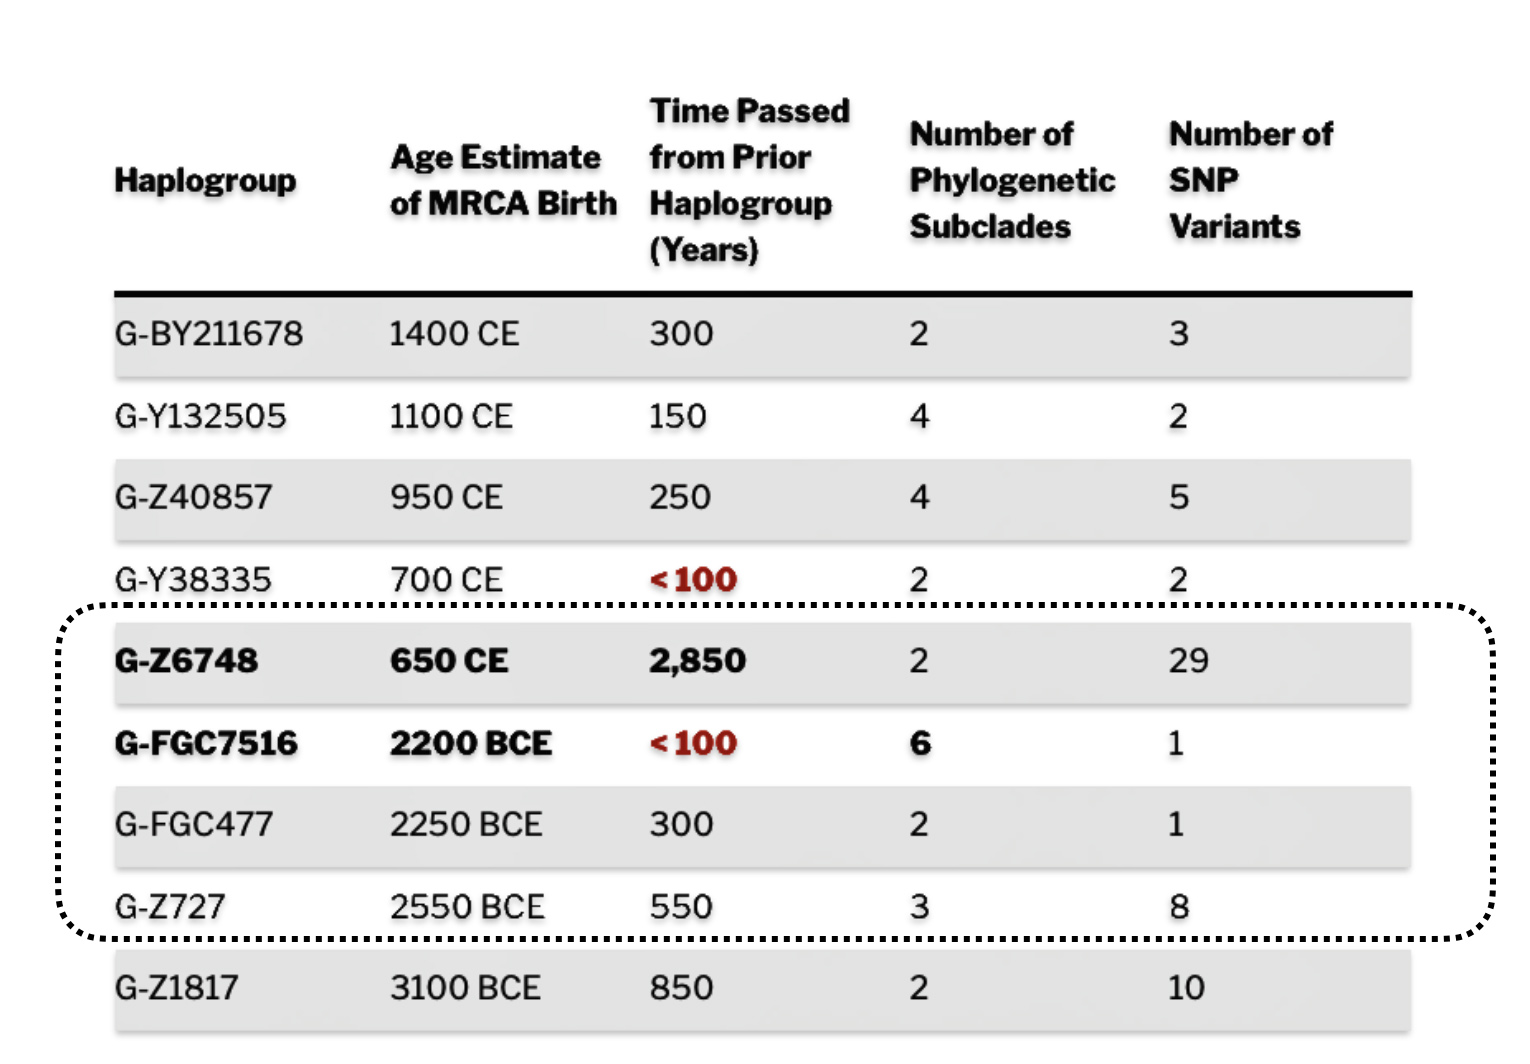
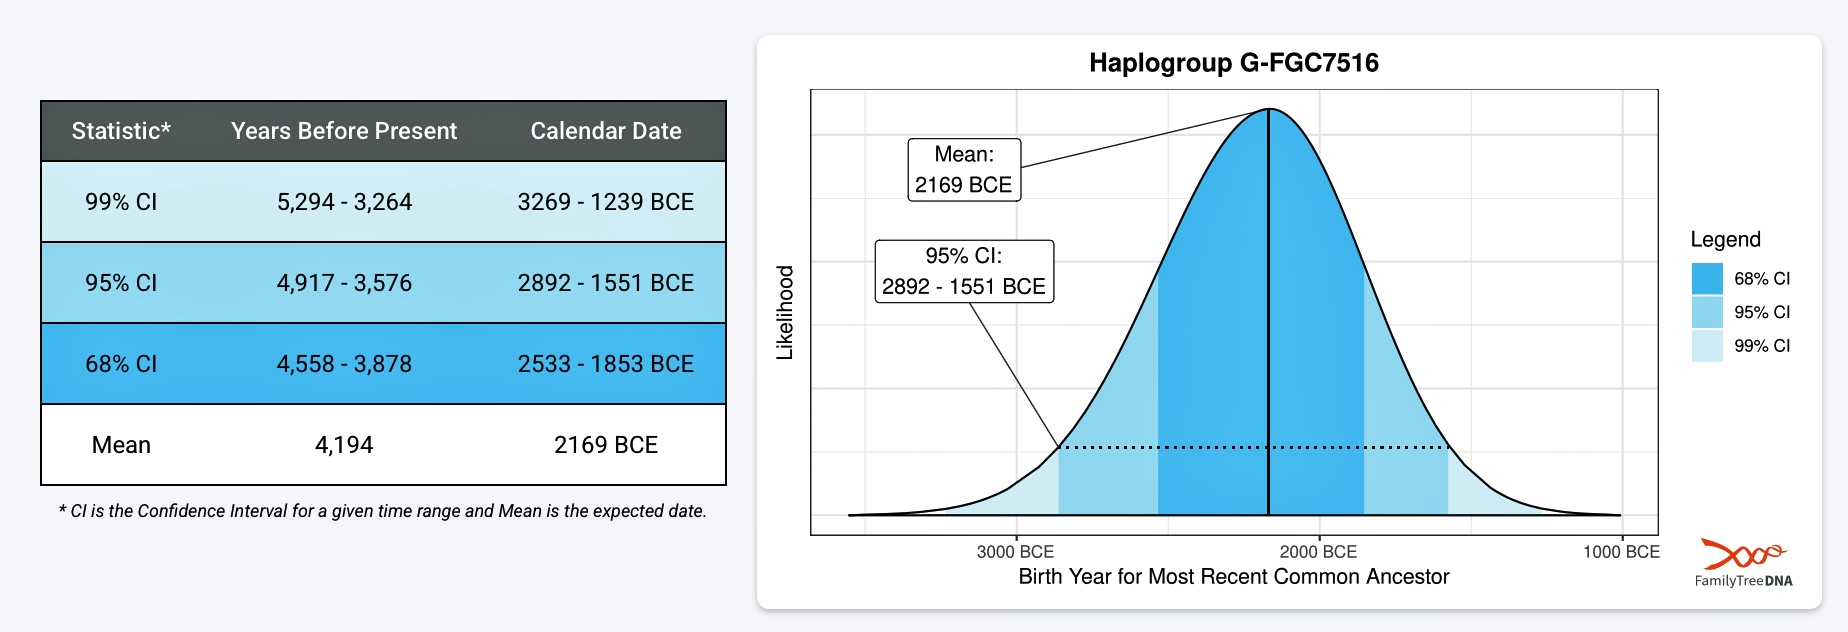
FamilyTreeDNA estimates indicate that the ancestor associated with the G-FGC7516 haplogroup was born around 2169 BCE. The level of certainty in determining the birth date is depicted in a probability plot in illustration two, which shows the most likely time when the common ancestor was born based on the statistical possibilities of various historical factors and data. It is ninety five percent certain that the ancestor associated with G-FGC7516 was born between 2892 BCE and 1551 BCE.
Illustration Two: Statistical Estimation Details on Haplogroup G-FGC7516
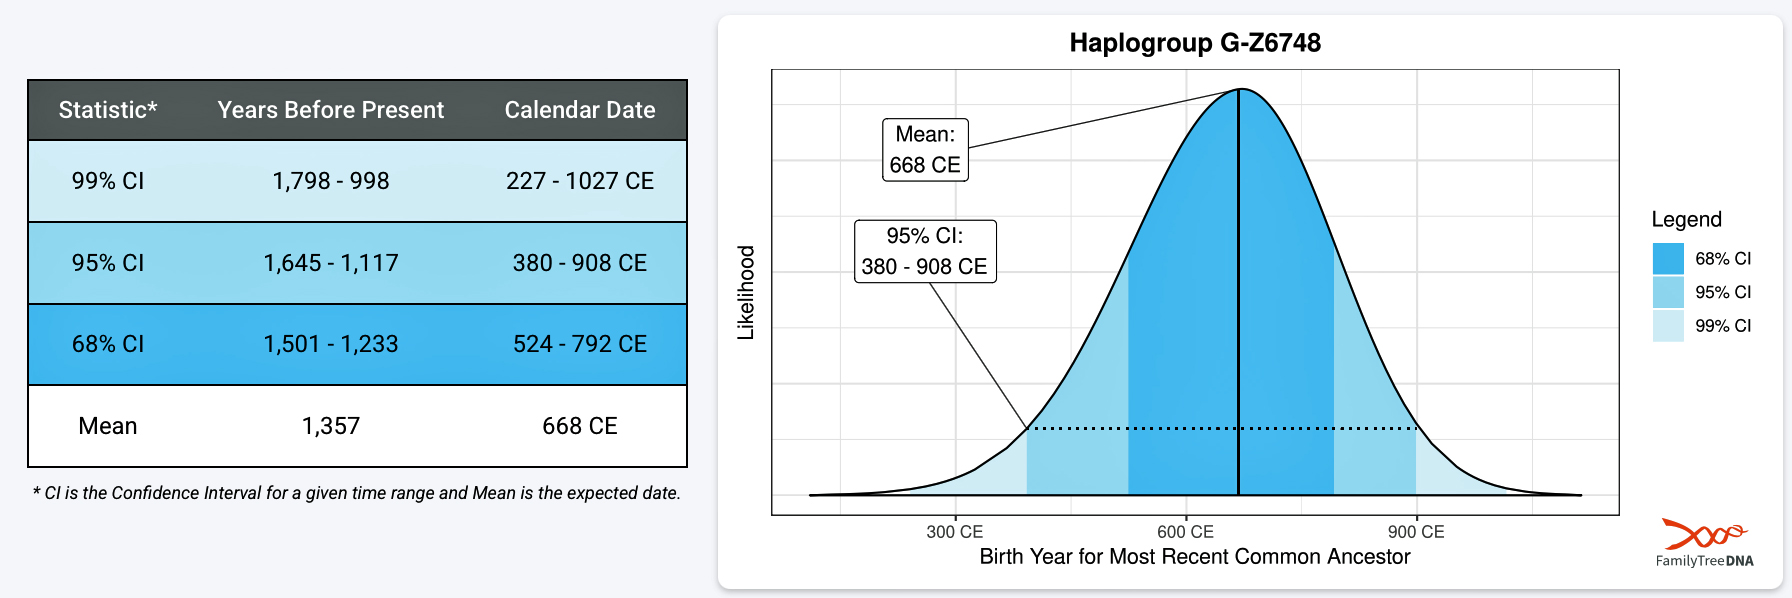
It has been estimated that the ancestor that marks the endpoint of this phylogenetic gap, who represents the G-Z6748 haplogroup, was born around 668 CE. There is a 95 percent chance of certainty that he was born between 380 – 908 CE (see illustration three).
Illustration Three: Statistical Estimation Details on Haplogroup G-G-Z6748
As indicated above, there were two other haplogroups that were geographically and temporally close to G-FGC7516. The estimated ranges for the birthdates for the three genetic ancestors associated with these three haplogroups overlap.
Illustration Four: Overlapping Ranges of Estimated Birth Dates for G Haplogroups Associated with the Second Phylogenetic Gap
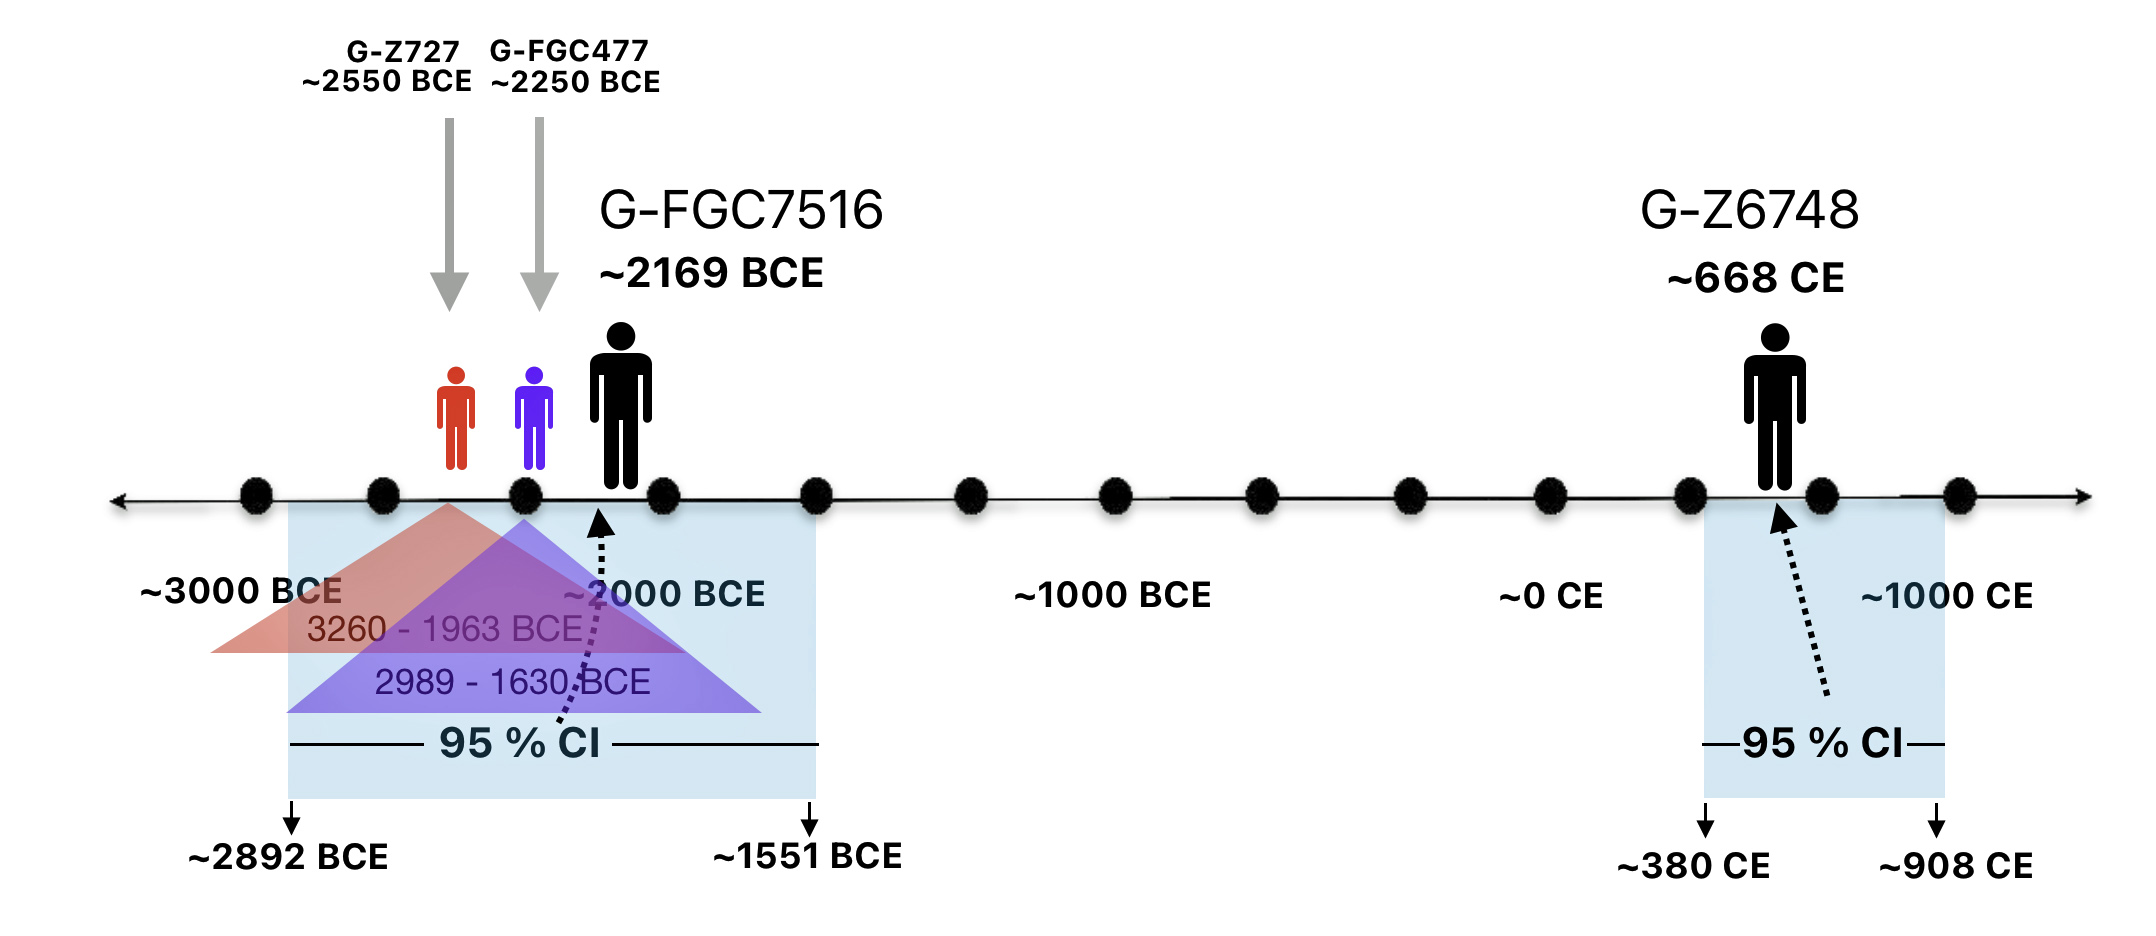
The estimated range, based on a 95 percent confidence interval, of when the ancestors associated with each of these haplogroups were born, is relatively large. As reflected in table two, given the emergence and shifting locations of various social groups and cultures during this period of time, these ancestors that were at the beginning of the gap could have been part of the Corded Ware or Bell Beaker cultures or possibly local bronze-Iron age tribes in the Meuse-Rhine watershed. The ancestor associated with the end of the gap could have been associated with Roman or post Roman transitions or German tribal societies. (see table two). The unknown ancestors in between these two time periods could have been part of various cultures in the Meuse-Rhine Watershed.
Table Two: Main Groups and Cultures Between 3000 BCE and 650 CE
| Period | Main Groups/Cultures | Key Features |
|---|---|---|
| 3000–2500 BCE | Swifterbant, Hazendonk, Vlaardingen, Seine-Oise-Marne (SOM) Groups, & Funnelbeaker Culture (TRB) | Wetland hunter-gatherers, early farmers, high continuity |
| 2500–1800 BCE | Corded Ware & Bell Beaker Cultures | Steppe ancestry influx, major demographic/cultural shift |
| 1800 BCE–First Century BCE | Local Bronze/Iron Age tribes, Urnfield culture (1300-750 BCE) Hallstatt culture (800-450 BCE) | Persistence of distinct communities, gradual tribalization |
| First Century BCE – 650 CE | Texandri, Treveri, Triboci, Tubantes, Tungri, Tulingi, Germanic/Celtic tribes, La Tène culture (450-50 BCE) | Tribal societies, Roman and post-Roman transitions, Frankish Expansion |
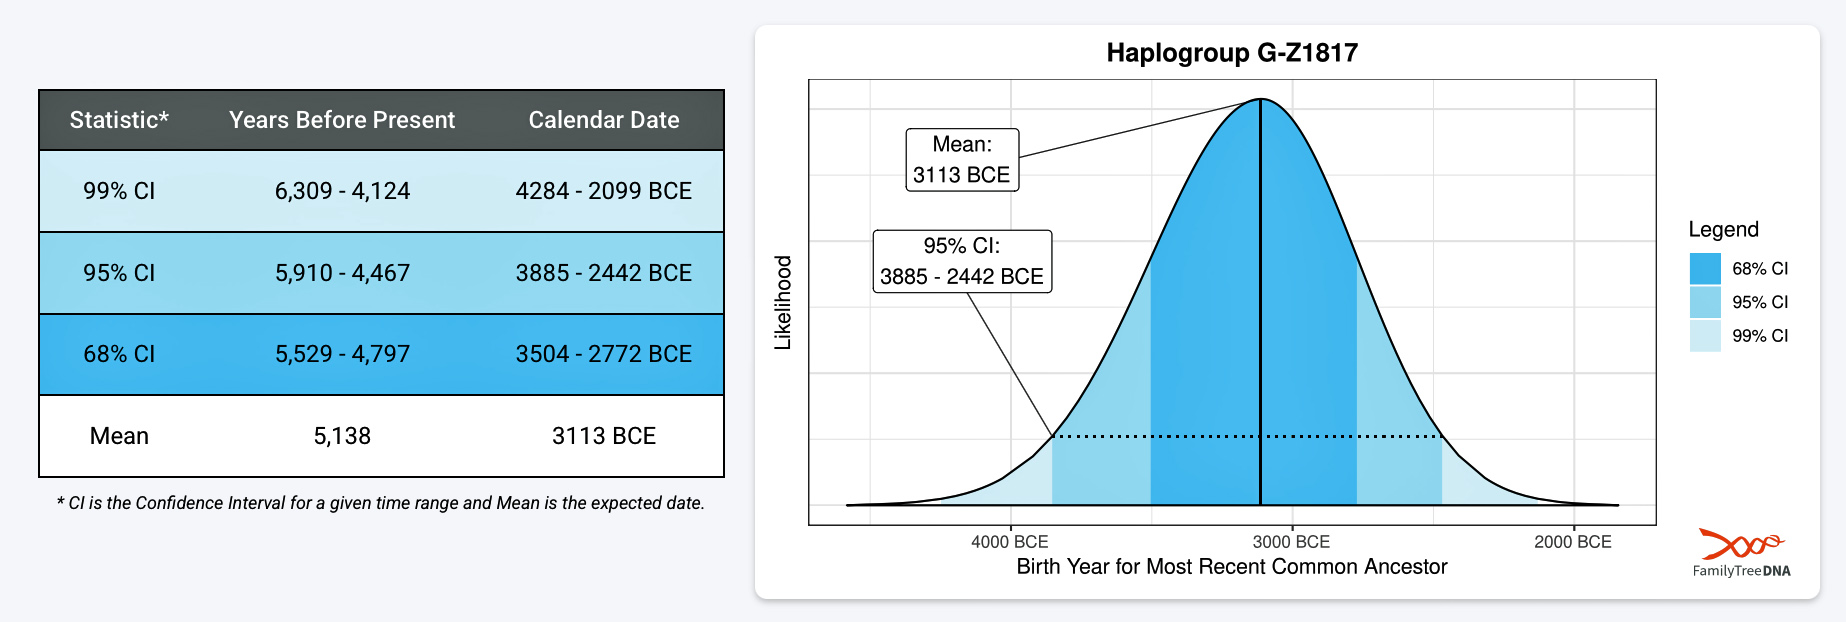
If we consider the statistical variance in estimating the birth of the ancestors asociated with the endpoints of this phylogenetic gap, we are looking at a time span roughly between 2900 BCE and 908 CE. Prior to this phylogenetic time gap, it is possible that a Most Common Ancestor of the Griff(is)es)(ith) paternal line, associated with haplogroup G-Z1817, lived in the lower region of this watershed area between 3885 BCE and 2442 (see illustration five).
Illustration Five: Statistical Estimation Details on Haplogroup G-G-Z1817
How the YDNA Haplgroup Map of the Meuse and Rhine Watershed Changed During This Time Frame
Between 2200 BCE and 650 CE, Northwestern Europe experienced dramatic shifts in Y-chromosome haplogroup distributions. These shifts were driven by migrations, cultural expansions, kinship practices, population replacements and environmental conditions (see table three).
At the beginning of this time frame, Early European Farmers (EEF), represented predominately by the YDNA G2a subclade interacted with the local Western Hunter-Gatherers (WHG), specifically YDNA subclades I2a, R1b-V88, and C1a (typical of Mesolithic hunter-gatherers). Archeological remains of mitochondrial DNA showed predominant Neolithic farmer ancestry, indicating female mediated gene flow from farming communities. [1]
The common ancestors associated with the haplgroups G-Z1817, G-Z727, G-FGC477, and G-FGC7516 of the Griff(is)(es)(ith) line would have existed during this time frame.
The Bell Beaker culture (2500 – 1800 BCE) introduced the YDNA R1b-M269 and Rib-P312 subclades in Western Europe, eventually replacing about 90 percent of earlier Neolithic lineages. Between 2200 BCE and 650 CE, the G haplogroup lineages in the Rhine-Meuse watershed transitioned from Neolithic dominance to near-marginalization, making them demographic outliers compared to the influx of predominant steppe-derived lineages (R1b-M269 and R1a). Their near eradication reflects the region’s shift from Neolithic agrarian societies to Bronze Age pastoralist dominated populations. [2]
The Rhine-Meuse watershed served as a hub for the formation and expansion of Bell Beaker cultural groups, facilitating the spread of R1b subclades across Northwestern Europe. However, this region’s unique ecology allowed prolonged Western Hunter-Gatherers’ (WHG) genetic survival until Yamnaya pastoral Western Steppe Herder (WSH) male lineages achieved near-complete dominance by the Bronze Age.
Table Three: Key Genetic Shifts During the Phylogenetic Gap
| Period | Dominant Haplogroups | Cultural Drivers | Genetic Impact |
|---|---|---|---|
| Bronze Age 2200–800 BCE | G2a, I2a, R1b-V88 → R1b-U106/P312 | Bell Beaker, Corded Ware | Admixture 40–90% male replacement |
| Iron Age to Roman Period 800 – 400 CE | R1b subclades, I1 | Celtic / Germanic regionalization | Local diversification |
| Germanic Expansions 400–650 CE | R1b-U106, R1b-P312, R1a-M420, I1 | Anglo-Saxon migrations | 73–86% turnover in Britain |
These shifts reflect Northwestern Europe’s complex interplay of steppe ancestry expansions, later Germanic tribal migrations, and cultural hybridization over three millennia.
Limited adoption of Corded Ware pottery culture (around 2500 BCE) was introduced through haplogroup R1b-U106 (a steppe-associated lineage) to the region. However, autosomal steppe ancestry remained low (around 11 percent), suggesting cultural adoption without large-scale population replacement. [3]
Between 2500 BCE and 1800 BCE, the Bell Beaker culture (2500–1800 BCE) introduced the R1b-M269 subclades (particularly R1b-P312) to Western Europe, replacing about ninety percent of earlier Neolithic Y-lineages. [4] This lineage became dominant in Britain, France, and Iberia, correlating with steppe ancestry. [5] The Bell Beaker complex marked a 83 to 91 percent genetic turnover, blending R1b-U106 and R1b-P312 lineages (from Corded Ware migrants) with 9 to 17 percent local Rhine-Meuse ancestry (high in hunter-gatherer ancestry).
In Central Europe, Corded Ware groups spread R1a-M417 (ancestral to R1a-Z645) from the Pontic-Caspian steppe, dominating regions like Bohemia and Scandinavia. [6] A steppe ancestry surge, reflecting a forty to fifty percent genetic replacement, occurred in Britain and Iberia, with R1b-P312 reaching 70–90% frequency among males. [7] While some earlier G lineages declined, certain subclades of G, such as G-L13, may have arrived with the steppe pastoralists, and their descendants. This highlights the complex nature of human migration and the subsequent mixing of populations and genetic lineages throughout European history. [8]
The ancestors of the Griff(is)(es)(ith) paternal genetic lineage that migrated through this area during this time period became genetic outliers among other predominant genetic lineages in this geographical area (see table four).
Table Four: G haplogroup’s Genetic Legacy
| Time Period within Phylogenetic Gap | G Haplogroup Status within Region | Key Drivers |
|---|---|---|
| Neolithic (G-Z1817, G-Z727, G-FGC477, G-FGC7516) | Dominant (~60% of males) | Agricultural expansion |
| Bronze/ Iron Age & Roman Era (Absence of Phylogenetic Subclades) | Near eradication (<5%) | Steppe migrations |
| Germanic Expansions (Absence of Subclades & Endpoint of G-Z6748) | Marginal (1–2% in NW Europe) | Continued admixture |
By 650 CE, the G haplogroup represented less that two percent of YDNA lineages in Northwestern Europe, its decline emblematic of the region’s shift from Neolithic agrarian societies to Bronze/Iron Age pastoralist-dominated populations. [9]
The Uniqueness of the Meuse and Rhine River Watershed
Illustration five depicts the estimated migratory path between haplogroup G-FGC716 and haplogroup G-Z6748, the two endpoints associated with this second phylogenetic gap. The map is part of a screen shot utilizing FamilyTreeDNA Globe Trekker program that maps out the YDNA migratory parth for the Griff(is)(es)(ith) genetic paternal line. The ‘zone of confidence’ reflected in the map depicts the possible variation of the migratiory path.
What is noteworthy when looking at illustration five is the relatively short distance between the estimated locations of the two ancestors that represent the endpoints of the genetic gap. The approximate locations of the two endpoints are Aachen, Germany and Amsterdam, Netherlands. Based on contemporary measures of distance, the length of this migratory gap is about 230 kilometers or 143 miles. Despite a relatively short distance between these two ancient ancestors, there are roughly 2,850 years between them.
Illustration Five: The Phylogenetic Gap between G-FGC7516 and G-Z6748
The migratory path of the Griff(is)(es)(ith) paternal line follows the contours between the Rhine River and the Meuse River watershed (see illustration six). The Meuse and Rhine watershed played a critical role in shaping migration, cultural dynamics and the Y-DNA genetic mix in northwestern Europe. It is within this geographical context that we find the second major phylogenetic gap in the Griff(is)(es)(ith) migratory path. I have added circled areas in illustration six to depict the general, estimated locations of the endpoints of the phylogenetic gap.
Illustration Six: The Water Basins of the Rhine River and Meuse River and the Two Most Common Recent Ancestor Enpoints for the Phylogenetic Gap in the Context of Modern Day Poltical Boundaries
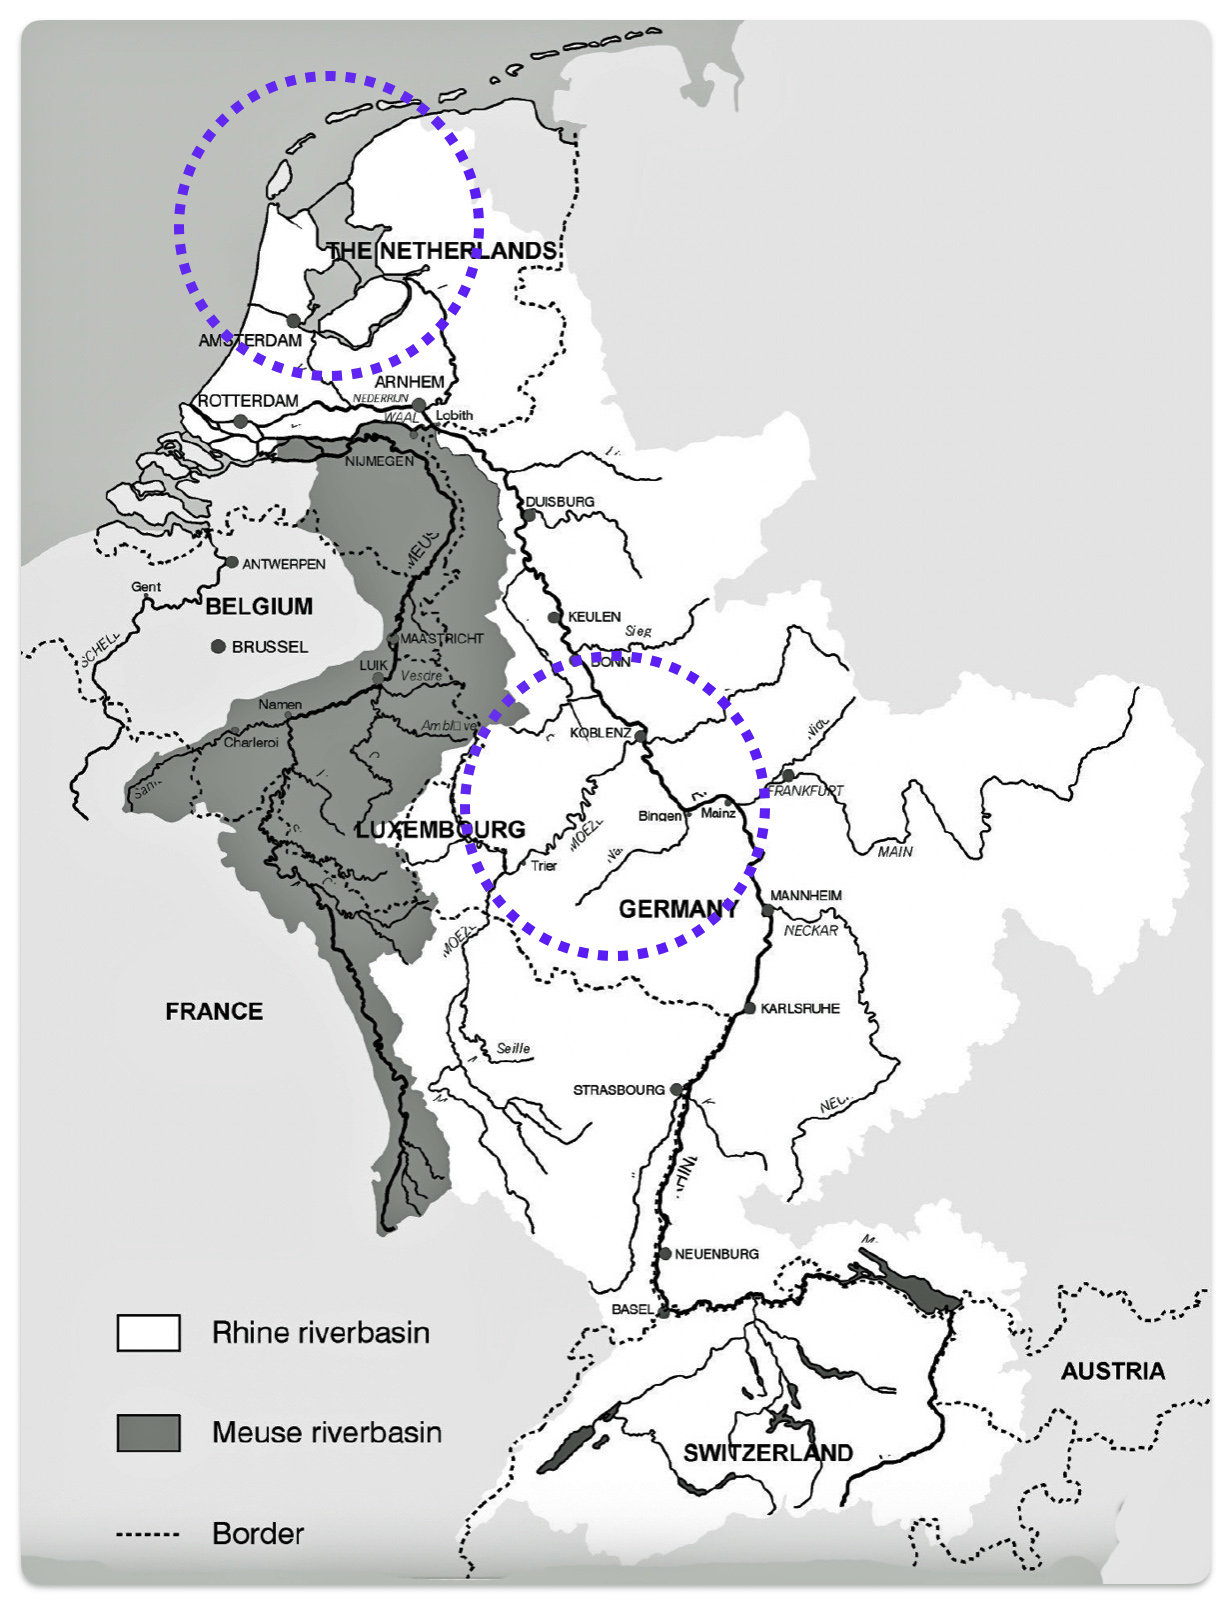
The Rhine River and the Meuse River are part of one of northwest Europe’s significant watersheds. The rivers and related tribularies have served as a frontier, a cultural crossroad, a barrier between groups and a boundary between societies throughout human history. Archaeological evidence and historical records reveal a rich tapestry of cultures that developed along its banks over nearly three millennia. The Rhine and Meuse River regions between 2200 BCE and 650 CE hosted diverse cultures and societies shaped by Neolithic, Celtic, Germanic, and Roman influences, evolving from tribal networks to fortified Roman frontiers and later Frankish kingdoms.
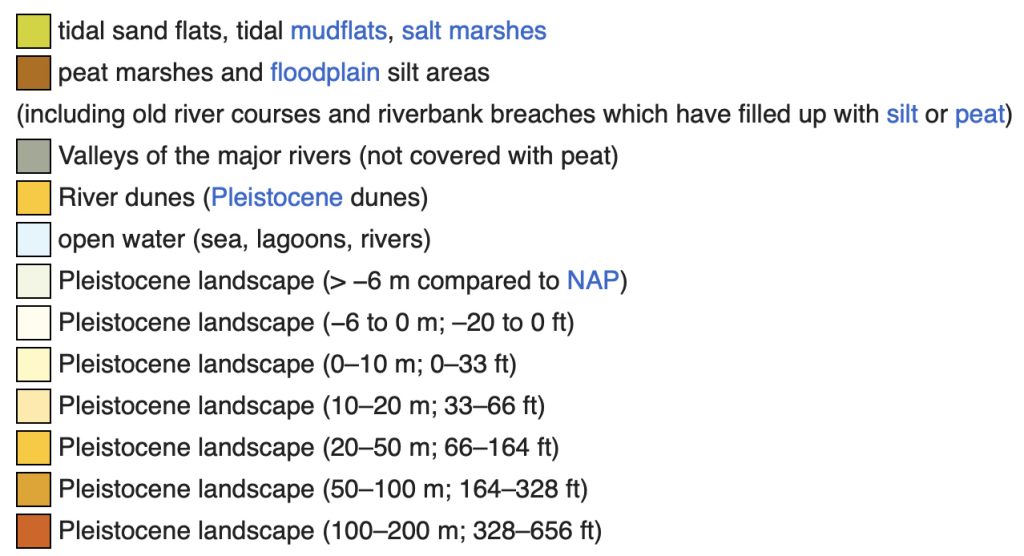
The Rhine-Meuse delta’s dynamic wetland and riverine environments profoundly shaped the interaction of social groups and cultures from 3000 BCE to 800 CE, fostering adaptive subsistence strategies, trade networks, and the interaction of various cultures while also necessitating technological innovation to manage environmental challenges of flooding and changing contours of the land. The shifts in land types are reflected in the following video through time (Click on image to start the video. Video will play directly within the webpage on mobile browsers, instead of opening in a fullscreen player.)
Video: Historical Changes to the Landscape: 5500 BCE, 3850 BCE, 2750 BCE, 500 BCE and 50 BCE
The Rhine-Meuse delta’s dynamic ecology played a dual role in shaping Y haplogroup expansions, both hindering certain genetic lineages and promoting others through environmental strictures and localized adaptations.
The delta’s ecology primarily hindered the expansion of outside incoming YDNA haplogroups (e.g., steppe R1a, Neolithic G2a) by creating barriers to mass male migrations. Simultaneously, it promoted the persistence and of indigenous lineages through isolation, localized resource strategies, and unique admixture events. This dual dynamic produced a YDNA landscape distinct from neighboring European regions. [10]
The delta acted as both a conservator of ancient YDNA (until ~2500 BCE) and a launchpad for R1b lineages that reshaped European paternal ancestry. These patterns underscore how mobility strategies—pioneer groups, kinship networks, and riverine trade—could disproportionately propagate specific male lineages despite limited autosomal impact.
The Meuse and Rhine River watershed may have had a major influence on the Griff(is)(es)(ith) YDNA phylogenetic tree through dynamic interactions between ecological barriers, R haplogroup male-biased migrations, the locus of geopolitical conflicts and changing political boundaries.
The ecology of the Rhine-Meuse delta was characterized by dynamic wetlands, shifting river channels, and fragmented landscapes. This environment had a significant impact on the spread and unique evolution of YDNA haplogroups over time. [11]
YDNA Preservation Challenges in the Watershed Area
Optimal Y-DNA preservation occurred in cool, alkaline, waterlogged environments with rapid sedimentation, while warmer climates, acidic soils, and hydrological disturbances degraded genetic material. Human activities both aided (burial under sediment) and hindered (soil disturbance) the preservation of YDNA remains. [12]
Table Five: Ecological Watershed Conditions that Impact YDNA Retrieval
| Factors | Resultant Conditions |
|---|---|
| Hydrological & Sendimentary Dynamics | Increased sedimentation from Bronze Age agriculture (~3000 BP) accelerated delta growth, burying and potentially preserving organic materials in anaerobic floodplain deposits [13] |
| Flooding phases (e.g., Roman Period, 12 BCE–250 CE) redistributed sediments, alternately exposing or sealing archaeological contexts [14] | |
| Avulsion processes (channel shifts) created localized burial environments, with some areas like abandoned channels acting as natural preservation traps [15] | |
| Climate & Microenvironmental Factors | Cooler, drier periods (e.g., Subboreal, ~2800 BCE) slowed DNA degradation by reducing hydrolytic damage [16] |
| Alkaline environments (e.g., salt-rich deposits) inhibited DNA fragmentation by limiting water activity and enzymatic decay [17] | |
| Anoxic conditions in waterlogged soils (e.g., deltaic peat) reduced microbial activity, preserving skeletal remains [18] | |
| Human Impact | Deforestation and land clearance increased erosion, rapidly burying remains under sediment layers [19] |
| Roman-era mining and medieval embankments disturbed archaeological layers but also created sealed contexts (e.g., ditches) conducive to preservation [20] | |
| Settlement patterns: Upland sites on sandy soils experienced higher DNA degradation due to acidic conditions, while delta wetlands offered better preservation [21] | |
| Climate & Soil Conditions | Warmer phases (e.g., Roman Warm Period) accelerated DNA fragmentation via increased microbial and enzymatic activity [22] |
| Cooler intervals (e.g., Late Antiquity cooling) enhanced preservation, particularly in deep sediment [23] | |
| Soil chemistry: Bones in alkaline soils (pH >7) retained longer DNA fragments than those in acidic environments [24] |
Ecological Barriers and Isolation
The delta’s constantly changing wetlands, river courses, and peat bogs created numerous ecological “islands.” These natural barriers limited large-scale migration and promoted the isolation of local populations. As a result, indigenous YDNA haplogroups—especially those associated with Mesolithic hunter-gatherers (e.g., Haplogroups I2a, R1b-V88, and C1a) persisted in the region much longer than in more accessible parts of Europe. This isolation fostered genetic drift within small, localized communities, leading to the retention and sometimes unique evolution of specific YDNA lineages. [25]
Selective YDNA Gene Flow and Sex-Based Admixture
The challenging terrain and waterlogged soils made the delta less attractive or accessible to large-scale male-dominated migrations, such as those associated with the G haplgroup based Neolithic farmers or the R haplgrop based later steppe populations. However, there was significant female-mediated gene flow, as evidenced by the predominance of Neolithic farmer mitochondrial (mtDNA) lineages alongside persistent local YDNA haplogroups.
This resulted in a unique genetic structure in the neolithic era: local men maintained hunter-gatherer YDNA, while women from incoming farming populations contributed new mtDNA lineages. This pattern is directly linked to the delta’s ecology, which favored gradual, piecemeal integration over wholesale population replacement. [26]
Buffering and Filtering of Major YDNA Migrations
The spread of Steppe ancestry (e.g., Corded Ware culture-associated R1a haplogroups) and later Bell Beaker migrations) was muted or filtered in the delta. While some Steppe and Bell Beaker YDNA lineages did appear, the dominant pattern was one of fusion with the local population rather than replacement. The delta’s fragmented, water-rich environment acted as a semi-permeable barrier, allowing for some genetic and cultural exchange but preserving a strong local genetic signature. [27]
Small Community Size and Kinship Structures
Genetic analyses show evidence of close kinship ties within local communities, consistent with small, relatively isolated populations. This would have reinforced the persistence of local YDNA haplogroups and limited the genetic impact of newcomers. [28]
Legacy of Ecological and Territorial Dynamics
These ecological effects created a legacy of territorial dynamics, as depicted in table four, that had subsequent effects through this phylogeneic gap period. The Rhine-Meuse delta’s ecological and associated cultural transformations between 2500 BCE and 600 CE significantly shaped the structure of individual YDNA phylogenetic trees through this time period..
Table Six: Genetic Legacy of Meuse-Rhine Ecological and Territorial Dynamics
Each of these ecological and territorial influences may have played a part in the lack of discovered subclades in the phylogenetic gap over an estimated 95 generations.
The Continuation – Part Two
Part two of this story focuses on the emergence and shifting locations of various social groups and cultures in the Muese Rhine watershed during this period of time. The ancestors that are documented as well as the undocumented generations may have been part of the cultures that lived in the Meuse-Rhine watershed.
Source:
Feature Banner: The banner at the top of the story features a map of the phylogenetic gaps discussed in the story. The maps was generated by taking a snapshop from the FamilyTreeDNA GlobetrekkerTM video of the migratory path of my YDNA descendants over time. The map shows the migratory path of selected most common recent ancestors and their respective estimated dates of birth. Another map in the banner depicts the Muesse and Rhine River watershed that is associated with this phylogenetic gap. . In addition, various cultures and features associated with time periods within this period of time are depicted.
[1] A significant cultural and demographic shift that occurred in some regions during the transition from the Neolithic to the Bronze Age. This shift involved a decline of sedentary farming communities and a rise of pastoralist groups, characterized by mobile livestock herding.
The Neolithic period saw the development of agriculture and the establishment of permanent settlements. These societies were based on cultivating crops and raising domesticated animals, allowing for larger and more stable populations than hunter-gatherer societies.
The Bronze Age saw further technological advancements, including the development of bronze tools and weapons, as well as innovations like the wheel and horse domestication. These innovations facilitated the rise of pastoralist cultures, especially in the Eurasian steppes. These groups were highly mobile, relying on large herds of livestock, particularly horses, for sustenance and transport.
The shift to a pastoralist-dominated society might have led to the “near-eradication” of some Neolithic agrarian populations in certain regions. This could have occurred through various mechanisms, including:
- Migration and Displacement: Mobile pastoralist groups could have migrated into areas occupied by farmers, displacing them and taking over their lands.
- Conflict and Conquest: The increased mobility and military capabilities of pastoralists, enhanced by horse domestication, may have allowed them to conquer settled agrarian communities.
- Disease: The movement of people and animals could have introduced new diseases to which settled populations had little immunity.
- Cultural Assimilation: Over time, some agrarian populations may have adopted the pastoralist lifestyle and integrated into their societies.
Archaeological and genetic studies support the idea of large-scale population shifts during this period, particularly in Europe. For example, the expansion of the Yamnaya culture, a Bronze Age pastoralist society from the Pontic-Caspian Steppe, into Northern Europe shows evidence of significant population replacement and admixture with existing hunter-gatherer and early farmer populations.
Taylor, W.T.T., Clark, J., Bayarsaikhan, J. et al. Early Pastoral Economies and Herding Transitions in Eastern Eurasia. Sci Rep 10, 1001 (2020). https://doi.org/10.1038/s41598-020-57735-y
Neolithic Europe, Wikipedia, This page was last edited on 25 May 2025, https://en.wikipedia.org/wiki/Neolithic_Europe
Neolithic Revolution, Wikipedia, This page was last edited on 22 May 2025, https://en.wikipedia.org/wiki/Neolithic_Revolution
Lasse Sørensen, Sabine Karg, The expansion of agrarian societies towards the north – new evidence for agriculture during the Mesolithic/Neolithic transition in Southern Scandinavia,
Journal of Archaeological Science, Volume 51, 2014, Pages 98-114,
https://doi.org/10.1016/j.jas.2012.08.042 .
(https://www.sciencedirect.com/science/article/pii/S0305440312003962 )
Ghalichi, A., Reinhold, S., Rohrlach, A.B. et al. The rise and transformation of Bronze Age pastoralists in the Caucasus. Nature 635, 917–925 (2024). https://doi.org/10.1038/s41586-024-08113-5
C. Jeong, et al, Bronze Age population dynamics and the rise of dairy pastoralism on the eastern Eurasian steppe, Proc. Natl. Acad. Sci. U.S.A. 115 (48) E11248-E11255 ,https://doi.org/10.1073/pnas.1813608115 (2018).
Robert Spengler , Michael Frachetti , Paula Doumani , Lynne Rouse , Barbara Cerasetti , Elissa Bullion and Alexei Mar’yashev, Early Agriculture and crop transmission among Bronze Age Mobile pastoralists of central Eurasia, 22 May 2014, Proceedings of the Royal society B, vol 281, Issue 1783 https://doi.org/10.1098/rspb.2013.3382
[2] Iñigo Olalde, Eveline Altena, Quentin Bourgeois, Harry Fokkens, Luc Amkreutz, Marie-France Deguilloux, Alessandro Fichera, Damien Flas, Francesca Gandini, Jan F. Kegler, Lisette M. Kootker, Kirsten Leijnse, Leendert Louwe Kooijmans, Roel Lauwerier, Rebecca Miller, Helle Molthof, Pierre Noiret, Daan C. M. Raemaekers, Maïté Rivollat, Liesbeth Smits, John R. Stewart, Theo ten Anscher, Michel Toussaint, Kim Callan, Olivia Cheronet, Trudi Frost, Lora Iliev, Matthew Mah, Adam Micco, Jonas Oppenheimer, Iris Patterson, Lijun Qiu, Gregory Soos, J. Noah Workman, Ceiridwen J. Edwards, Iosif Lazaridis, Swapan Mallick, Nick Patterson, Nadin Rohland, Martin B. Richards, Ron Pinhasi, Wolfgang Haak, Maria Pala, David Reich, Long-term hunter-gatherer continuity in the Rhine-Meuse region was disrupted by local formation of expansive Bell Beaker groups, bioRxiv, 25 Mar 2025, doi: https://doi.org/10.1101/2025.03.24.644985 , https://www.biorxiv.org/content/10.1101/2025.03.24.644985v1.full.pdf
Olalde I, Altena E, Bourgeois Q, Fokkens H, Amkreutz L, Deguilloux MF, Fichera A, Flas D, Gandini F, Kegler JF, Kootker LM, Leijnse K, Kooijmans LL, Lauwerier R, Miller R, Molthof H, Noiret P, Raemaekers DCM, Rivollat M, Smits L, Stewart JR, Anscher TT, Toussaint M, Callan K, Cheronet O, Frost T, Iliev L, Mah M, Micco A, Oppenheimer J, Patterson I, Qiu L, Soos G, Workman JN, Edwards CJ, Lazaridis I, Mallick S, Patterson N, Rohland N, Richards MB, Pinhasi R, Haak W, Pala M, Reich D. Long-term hunter-gatherer continuity in the Rhine-Meuse region was disrupted by local formation of expansive Bell Beaker groups. bioRxiv [Preprint]. 2025 Mar 25:2025.03.24.644985. doi: 10.1101/2025.03.24.644985. PMID: 40196638; PMCID: PMC11974744 (PubMed) https://pubmed.ncbi.nlm.nih.gov/40196638/
Fernández-Götz, Manuel, and others (eds), Rethinking Migrations in Late Prehistoric Eurasia (London, 2022; online edn, British Academy Scholarship Online, 18 May 2023), https://doi.org/10.5871/bacad/9780197267356.001.0001
Hay, Maciamo, Genetic History of the Benelux & France, Aug 2021, Eupedia, https://www.eupedia.com/europe/benelux_france_dna_project.shtml
Haplogroup G-M201, This page was last edited on 25 May 2025, Wikipedia, https://en.wikipedia.org/wiki/Haplogroup_G-M201
[3] Iñigo Olalde, et al, Long-term hunter-gatherer continuity in the Rhine-Meuse region was disrupted by local formation of expansive Bell Beaker groups, bioRxiv, 25 Mar 2025, doi: https://doi.org/10.1101/2025.03.24.644985 , https://www.biorxiv.org/content/10.1101/2025.03.24.644985v1.full.pdf
Olalde I, et al, Long-term hunter-gatherer continuity in the Rhine-Meuse region was disrupted by local formation of expansive Bell Beaker groups. bioRxiv [Preprint]. 2025 Mar 25:2025.03.24.644985. doi: 10.1101/2025.03.24.644985. PMID: 40196638; PMCID: PMC11974744 (PubMed) https://pubmed.ncbi.nlm.nih.gov/40196638/
[4] García-Fernández, C., Lizano, E., Telford, M. et al. Y-chromosome target enrichment reveals rapid expansion of haplogroup R1b-DF27 in Iberia during the Bronze Age transition.Sci Rep 12, 20708 (2022). https://doi.org/10.1038/s41598-022-25200-7
[5] Gretzinger J, Sayer D, Justeau P, Altena E, Pala M, Dulias K, Edwards CJ, Jodoin S, Lacher L, Sabin S, Vågene ÅJ, Haak W, Ebenesersdóttir SS, Moore KHS, Radzeviciute R, Schmidt K, Brace S, Bager MA, Patterson N, Papac L, Broomandkhoshbacht N, Callan K, Harney É, Iliev L, Lawson AM, Michel M, Stewardson K, Zalzala F, Rohland N, Kappelhoff-Beckmann S, Both F, Winger D, Neumann D, Saalow L, Krabath S, Beckett S, Van Twest M, Faulkner N, Read C, Barton T, Caruth J, Hines J, Krause-Kyora B, Warnke U, Schuenemann VJ, Barnes I, Dahlström H, Clausen JJ, Richardson A, Popescu E, Dodwell N, Ladd S, Phillips T, Mortimer R, Sayer F, Swales D, Stewart A, Powlesland D, Kenyon R, Ladle L, Peek C, Grefen-Peters S, Ponce P, Daniels R, Spall C, Woolcock J, Jones AM, Roberts AV, Symmons R, Rawden AC, Cooper A, Bos KI, Booth T, Schroeder H, Thomas MG, Helgason A, Richards MB, Reich D, Krause J, Schiffels S. The Anglo-Saxon migration and the formation of the early English gene pool. Nature. 2022 Oct;610(7930):112-119. doi: 10.1038/s41586-022-05247-2. Epub 2022 Sep 21. Erratum in: Nature. 2022 Nov;611(7934):E3. doi: 10.1038/s41586-022-05429-y. PMID: 36131019; PMCID: PMC9534755,( PubMed) https://pmc.ncbi.nlm.nih.gov/articles/PMC9534755/
Rootsi S, Myres NM, Lin AA, Järve M, King RJ, Kutuev I, Cabrera VM, Khusnutdinova EK, Varendi K, Sahakyan H, Behar DM, Khusainova R, Balanovsky O, Balanovska E, Rudan P, Yepiskoposyan L, Bahmanimehr A, Farjadian S, Kushniarevich A, Herrera RJ, Grugni V, Battaglia V, Nici C, Crobu F, Karachanak S, Hooshiar Kashani B, Houshmand M, Sanati MH, Toncheva D, Lisa A, Semino O, Chiaroni J, Di Cristofaro J, Villems R, Kivisild T, Underhill PA. Distinguishing the co-ancestries of haplogroup G Y-chromosomes in the populations of Europe and the Caucasus. Eur J Hum Genet. 2012 Dec;20(12):1275-82. doi: 10.1038/ejhg.2012.86. Epub 2012 May 16. PMID: 22588667; PMCID: PMC3499744 (PubMed) https://pmc.ncbi.nlm.nih.gov/articles/PMC3499744/
Hay, Maciamo, Genetic History of he Benelux & France, Aug 2021, Eupedia, https://www.eupedia.com/europe/benelux_france_dna_project.shtml
Haplogroup G-M201, This page was last edited on 25 May 2025, Wikipedia, https://en.wikipedia.org/wiki/Haplogroup_G-M201
[6] Oğuzhan Parasayan et al., Late Neolithic collective burial reveals admixture dynamics during the third millennium BCE and the shaping of the European genome.Sci. Adv.10,eadl2468(2024).DOI:10.1126/sciadv.adl2468
Papac L, Ernée M, Dobeš M, Langová M, Rohrlach AB, Aron F, Neumann GU, Spyrou MA, Rohland N, Velemínský P, Kuna M, Brzobohatá H, Culleton B, Daněček D, Danielisová A, Dobisíková M, Hložek J, Kennett DJ, Klementová J, Kostka M, Krištuf P, Kuchařík M, Hlavová JK, Limburský P, Malyková D, Mattiello L, Pecinovská M, Petriščáková K, Průchová E, Stránská P, Smejtek L, Špaček J, Šumberová R, Švejcar O, Trefný M, Vávra M, Kolář J, Heyd V, Krause J, Pinhasi R, Reich D, Schiffels S, Haak W. Dynamic changes in genomic and social structures in third millennium BCE central Europe. Sci Adv. 2021 Aug 25;7(35):eabi6941. doi: 10.1126/sciadv.abi6941. PMID: 34433570; PMCID: PMC8386934., (PubMed) https://pmc.ncbi.nlm.nih.gov/articles/PMC8386934/
[7] Gretzinger J, Sayer D, Justeau P, Altena E, Pala M, Dulias K, Edwards CJ, Jodoin S, Lacher L, Sabin S, Vågene ÅJ, Haak W, Ebenesersdóttir SS, Moore KHS, Radzeviciute R, Schmidt K, Brace S, Bager MA, Patterson N, Papac L, Broomandkhoshbacht N, Callan K, Harney É, Iliev L, Lawson AM, Michel M, Stewardson K, Zalzala F, Rohland N, Kappelhoff-Beckmann S, Both F, Winger D, Neumann D, Saalow L, Krabath S, Beckett S, Van Twest M, Faulkner N, Read C, Barton T, Caruth J, Hines J, Krause-Kyora B, Warnke U, Schuenemann VJ, Barnes I, Dahlström H, Clausen JJ, Richardson A, Popescu E, Dodwell N, Ladd S, Phillips T, Mortimer R, Sayer F, Swales D, Stewart A, Powlesland D, Kenyon R, Ladle L, Peek C, Grefen-Peters S, Ponce P, Daniels R, Spall C, Woolcock J, Jones AM, Roberts AV, Symmons R, Rawden AC, Cooper A, Bos KI, Booth T, Schroeder H, Thomas MG, Helgason A, Richards MB, Reich D, Krause J, Schiffels S. The Anglo-Saxon migration and the formation of the early English gene pool. Nature. 2022 Oct;610(7930):112-119. doi: 10.1038/s41586-022-05247-2. Epub 2022 Sep 21. Erratum in: Nature. 2022 Nov;611(7934):E3. doi: 10.1038/s41586-022-05429-y. PMID: 36131019; PMCID: PMC9534755 (PubMed) https://pmc.ncbi.nlm.nih.gov/articles/PMC9534755/
García-Fernández, C., Lizano, E., Telford, M. et al. Y-chromosome target enrichment reveals rapid expansion of haplogroup R1b-DF27 in Iberia during the Bronze Age transition.Sci Rep 12, 20708 (2022). https://doi.org/10.1038/s41598-022-25200-7
[8] Eugène C.W.L. (Boed) Marres, G-M201, Marres, https://www.marres.nl/EN/G-M201.htm
[9] Hay, Maciamo, Haplogroup G2a (Y-DNA), Jul 2023, Eupedia, https://www.eupedia.com/europe/Haplogroup_G2a_Y-DNA.shtml
Haplogroup G-M201, Wikipedia, This page was last edited on 25 May 2025, https://en.wikipedia.org/wiki/Haplogroup_G-M201
[10] Iñigo Olalde, et al, Long-term hunter-gatherer continuity in the Rhine-Meuse region was disrupted by local formation of expansive Bell Beaker groups, bioRxiv, 25 Mar 2025, doi: https://doi.org/10.1101/2025.03.24.644985 , https://www.biorxiv.org/content/10.1101/2025.03.24.644985v1.full.pdf
Olalde Iñigo, et al Long-term hunter-gatherer continuity in the Rhine-Meuse region was disrupted by local formation of expansive Bell Beaker groups. bioRxiv [Preprint]. 2025 Mar 25:2025.03.24.644985. doi: 10.1101/2025.03.24.644985. PMID: 40196638; PMCID: PMC11974744 (PubMed) https://pubmed.ncbi.nlm.nih.gov/40196638/
[11] See for example:
Cohen, Kim, Sediment History, Utrecht University, https://www.uu.nl/en/research/water-climate-and-future-deltas/storylines/sediments-matter/follow-the-sediment/sediment-history
Pierrik, H.J., E. Stouthamer, K.M. Cohen, Natural levee evolution in the Rhine-Meuse delta, theNetherlands, during the first millennium CE, Geomorphology, 295 (2017) 215-234, https://dspace.library.uu.nl/bitstream/handle/1874/352044/Natural.pdf?sequence=1
Arnoldussen, Stijn, A Living Landscape: Bronze Age Settlement Sites in the Dutch River area (c.2000-80 BC), Sidestone Press, 2008 https://www.sidestone.com/openaccess/9789088900105.pdf
Fokkens, H., Steffens, B. J. W. & van As, S. F. . Farmers, fishers, fowlers, hunters: knowledge generated by development-led archaeology about the Late Neolithic, the Early Bronze Age and the start of the Middle Bronze Age (2850–1500 cal BC) in the Netherlands. Ned. Archeol. Rapp. 53, 978–990 (2016) https://www.academia.edu/31484011/Farmers_fishers_fowlers_hunters_Knowledge_generated_by_development_led_archaeology_about_the_Late_Neolithic_the_Early_Bronze_Age_and_the_start_of_the_Middle_Bronze_Age_2850_1500_cal_BC_in_the_Netherlands
Kooijmans, L.P. Louwe, The Rhine/Meuse Delta: Four Studies on its Prehistoric Occupation and Holecene Geology, Lieden University Press, 1974
Parasayan O, Laurelut C, Bôle C, Bonnabel L, Corona A, Domenech-Jaulneau C, Paresys C, Richard I, Grange T, Geigl EM. Late Neolithic collective burial reveals admixture dynamics during the third millennium BCE and the shaping of the European genome. Sci Adv. 2024 Jun 21;10(25):eadl2468. doi: 10.1126/sciadv.adl2468. Epub 2024 Jun 19. PMID: 38896620; PMCID: PMC1118650 (PubMed) https://pmc.ncbi.nlm.nih.gov/articles/PMC11186501/
van Dinter, M., The Roman Limes in the Netherlands: how a delta landscape determined the location of the military structures, Netherlands Journal of Geosciences, 92-1, 11-13 2013, 11-32, https://www.researchgate.net/publication/287527529_The_Roman_Limes_in_the_Netherlands_How_a_delta_landscape_determined_the_location_of_the_military_structures
[12] Olson, K. , Krug, E. and Chernyanskii, S. (2025) Natural and Anthropic Environmental Risks to the Rhine River and Delta. Open Journal of Soil Science, 15, 235-267. doi: 10.4236/ojss.2025.154012.
Kravanja P, Golob A, Concato M, Leskovar T, Zupanič Pajnič I. Effects of different environmental factors on preservation of DNA in petrous bones: A comparative study of two Slovenian archaeological sites. Forensic Sci Int. 2025 Jun;371:112495. doi: 10.1016/j.forsciint.2025.112495. Epub 2025 May 7. PMID: 40349398 (PubMed) https://pubmed.ncbi.nlm.nih.gov/40349398/
Poetsch M, Markwerth P, Konrad H, Bajanowski T, Helmus J. About the influence of environmental factors on the persistence of DNA – a long-term study. Int J Legal Med. 2022 May;136(3):687-693. doi: 10.1007/s00414-022-02800-6. Epub 2022 Feb 23. PMID: 35195781; PMCID: PMC9005405 (PubMed) https://pmc.ncbi.nlm.nih.gov/articles/PMC9005405/
Conor Rossi , Gabriela Ruß-Popa , Valeria Mattiangeli , Fionnuala McDaid , Andrew J. Hare , Hossein Davoudi , Haeedeh Laleh , Zahra Lorzadeh , Roya Khazaeli , Homa Fathi , Matthew D. Teasdale , Abolfazl A’ali , Thomas Stöllner, et al , Exceptional ancient DNA preservation and fibre remains of a Sasanian saltmine sheep mummy in Chehrābād, Iran, Biology Letter, The Royal Society, Jul 2021, 17, 7, https://royalsocietypublishing.org/doi/10.1098/rsbl.2021.0222
[13] Olson, K. , Krug, E. and Chernyanskii, S. (2025) Natural and Anthropic Environmental Risks to the Rhine River and Delta. Open Journal of Soil Science, 15, 235-267. doi: 10.4236/ojss.2025.154012.
[14] Peng, F., Prins, M. A., Kasse, C., Cohen, K. M., Van der Putten, N., van der Lubbe, J., Toonen, W. H. J., & van Balen, R. T. (2019). An improved method for paleoflood reconstruction and flooding phase identification, applied to the Meuse River in the Netherlands. Global and Planetary Change, 177, 213-224. https://doi.org/10.1016/j.gloplacha.2019.04.006
[15] Peng, F., Prins, M. A., Kasse, C., Cohen, K. M., Van der Putten, N., van der Lubbe, J., Toonen, W. H. J., & van Balen, R. T. (2019). An improved method for paleoflood reconstruction and flooding phase identification, applied to the Meuse River in the Netherlands. Global and Planetary Change, 177, 213-224. https://doi.org/10.1016/j.gloplacha.2019.04.006
Olson, K. , Krug, E. and Chernyanskii, S. (2025) Natural and Anthropic Environmental Risks to the Rhine River and Delta. Open Journal of Soil Science, 15, 235-267. doi: 10.4236/ojss.2025.154012.
[16] Logan Kistler, Roselyn Ware, Oliver Smith, Matthew Collins, Robin G. Allaby, A new model for ancient DNA decay based on paleogenomic meta-analysis, Nucleic Acids Research, Volume 45, Issue 11, 20 June 2017, Pages 6310–6320, https://doi.org/10.1093/nar/gkx361
Peng, F., Prins, M. A., Kasse, C., Cohen, K. M., Van der Putten, N., van der Lubbe, J., Toonen, W. H. J., & van Balen, R. T. (2019). An improved method for paleoflood reconstruction and flooding phase identification, applied to the Meuse River in the Netherlands. Global and Planetary Change, 177, 213-224. https://doi.org/10.1016/j.gloplacha.2019.04.006
Conor Rossi , Gabriela Ruß-Popa , Valeria Mattiangeli , Fionnuala McDaid , Andrew J. Hare , Hossein Davoudi , Haeedeh Laleh , Zahra Lorzadeh , Roya Khazaeli , Homa Fathi , Matthew D. Teasdale , Abolfazl A’ali , Thomas Stöllner, et al , Exceptional ancient DNA preservation and fibre remains of a Sasanian saltmine sheep mummy in Chehrābād, Iran, Biology Letter, The Royal Society, Jul 2021, 17, 7, https://royalsocietypublishing.org/doi/10.1098/rsbl.2021.0222
[17] Conor Rossi , Gabriela Ruß-Popa , Valeria Mattiangeli , Fionnuala McDaid , Andrew J. Hare , Hossein Davoudi , Haeedeh Laleh , Zahra Lorzadeh , Roya Khazaeli , Homa Fathi , Matthew D. Teasdale , Abolfazl A’ali , Thomas Stöllner, et al , Exceptional ancient DNA preservation and fibre remains of a Sasanian saltmine sheep mummy in Chehrābād, Iran, Biology Letter, The Royal Society, Jul 2021, 17, 7, https://royalsocietypublishing.org/doi/10.1098/rsbl.2021.0222
[18] Conor Rossi , Gabriela Ruß-Popa , Valeria Mattiangeli , Fionnuala McDaid , Andrew J. Hare , Hossein Davoudi , Haeedeh Laleh , Zahra Lorzadeh , Roya Khazaeli , Homa Fathi , Matthew D. Teasdale , Abolfazl A’ali , Thomas Stöllner, et al , Exceptional ancient DNA preservation and fibre remains of a Sasanian saltmine sheep mummy in Chehrābād, Iran, Biology Letter, The Royal Society, Jul 2021, 17, 7, https://royalsocietypublishing.org/doi/10.1098/rsbl.2021.0222
Kravanja P, Golob A, Concato M, Leskovar T, Zupanič Pajnič I. Effects of different environmental factors on preservation of DNA in petrous bones: A comparative study of two Slovenian archaeological sites. Forensic Sci Int. 2025 Jun;371:112495. doi: 10.1016/j.forsciint.2025.112495. Epub 2025 May 7. PMID: 40349398. (PubMed) https://pubmed.ncbi.nlm.nih.gov/40349398/
[19] “Transition to Farming Along the Lower Rhine and Meuse .” Ancient Europe, 8000 B.C. to A.D. 1000: Encyclopedia of the Barbarian World. . Encyclopedia.com. (June 17, 2025). https://www.encyclopedia.com/humanities/encyclopedias-almanacs-transcripts-and-maps/transition-farming-along-lower-rhine-and-meuse
Peng, F., Prins, M. A., Kasse, C., Cohen, K. M., Van der Putten, N., van der Lubbe, J., Toonen, W. H. J., & van Balen, R. T. (2019). An improved method for paleoflood reconstruction and flooding phase identification, applied to the Meuse River in the Netherlands. Global and Planetary Change, 177, 213-224. https://doi.org/10.1016/j.gloplacha.2019.04.006
[20] Peng, F., Prins, M. A., Kasse, C., Cohen, K. M., Van der Putten, N., van der Lubbe, J., Toonen, W. H. J., & van Balen, R. T. (2019). An improved method for paleoflood reconstruction and flooding phase identification, applied to the Meuse River in the Netherlands. Global and Planetary Change, 177, 213-224. https://doi.org/10.1016/j.gloplacha.2019.04.006
[21] Kravanja P, Golob A, Concato M, Leskovar T, Zupanič Pajnič I. Effects of different environmental factors on preservation of DNA in petrous bones: A comparative study of two Slovenian archaeological sites. Forensic Sci Int. 2025 Jun;371:112495. doi: 10.1016/j.forsciint.2025.112495. Epub 2025 May 7. PMID: 40349398 (PubMed) https://pubmed.ncbi.nlm.nih.gov/40349398/
“Transition to Farming Along the Lower Rhine and Meuse .” Ancient Europe, 8000 B.C. to A.D. 1000: Encyclopedia of the Barbarian World. . Encyclopedia.com. (June 17, 2025). https://www.encyclopedia.com/humanities/encyclopedias-almanacs-transcripts-and-maps/transition-farming-along-lower-rhine-and-meuse
[22] Poetsch M, Markwerth P, Konrad H, Bajanowski T, Helmus J. About the influence of environmental factors on the persistence of DNA – a long-term study. Int J Legal Med. 2022 May;136(3):687-693. doi: 10.1007/s00414-022-02800-6. Epub 2022 Feb 23. PMID: 35195781; PMCID: PMC9005405 (PubMed) https://pmc.ncbi.nlm.nih.gov/articles/PMC9005405/
Conor Rossi , Gabriela Ruß-Popa , Valeria Mattiangeli , Fionnuala McDaid , Andrew J. Hare , Hossein Davoudi , Haeedeh Laleh , Zahra Lorzadeh , Roya Khazaeli , Homa Fathi , Matthew D. Teasdale , Abolfazl A’ali , Thomas Stöllner, et al , Exceptional ancient DNA preservation and fibre remains of a Sasanian saltmine sheep mummy in Chehrābād, Iran, Biology Letter, The Royal Society, Jul 2021, 17, 7, https://royalsocietypublishing.org/doi/10.1098/rsbl.2021.0222
[23] Logan Kistler, Roselyn Ware, Oliver Smith, Matthew Collins, Robin G. Allaby, A new model for ancient DNA decay based on paleogenomic meta-analysis, Nucleic Acids Research, Volume 45, Issue 11, 20 June 2017, Pages 6310–6320, https://doi.org/10.1093/nar/gkx361
Conor Rossi , Gabriela Ruß-Popa , Valeria Mattiangeli , Fionnuala McDaid , Andrew J. Hare , Hossein Davoudi , Haeedeh Laleh , Zahra Lorzadeh , Roya Khazaeli , Homa Fathi , Matthew D. Teasdale , Abolfazl A’ali , Thomas Stöllner, et al , Exceptional ancient DNA preservation and fibre remains of a Sasanian saltmine sheep mummy in Chehrābād, Iran, Biology Letter, The Royal Society, Jul 2021, 17, 7, https://royalsocietypublishing.org/doi/10.1098/rsbl.2021.0222
[24] Kravanja P, Golob A, Concato M, Leskovar T, Zupanič Pajnič I. Effects of different environmental factors on preservation of DNA in petrous bones: A comparative study of two Slovenian archaeological sites. Forensic Sci Int. 2025 Jun;371:112495. doi: 10.1016/j.forsciint.2025.112495. Epub 2025 May 7. PMID: 40349398 (PubMed) https://pubmed.ncbi.nlm.nih.gov/40349398/
Poetsch M, Markwerth P, Konrad H, Bajanowski T, Helmus J. About the influence of environmental factors on the persistence of DNA – a long-term study. Int J Legal Med. 2022 May;136(3):687-693. doi: 10.1007/s00414-022-02800-6. Epub 2022 Feb 23. PMID: 35195781; PMCID: PMC9005405 (PubMed) https://pmc.ncbi.nlm.nih.gov/articles/PMC9005405/
[24] Iñigo Olalde, et al, Long-term hunter-gatherer continuity in the Rhine-Meuse region was disrupted by local formation of expansive Bell Beaker groups, bioRxiv, 25 Mar 2025, doi: https://doi.org/10.1101/2025.03.24.644985 , https://www.biorxiv.org/content/10.1101/2025.03.24.644985v1.full.pdf
Olalde Iñigo, et al Long-term hunter-gatherer continuity in the Rhine-Meuse region was disrupted by local formation of expansive Bell Beaker groups. bioRxiv [Preprint]. 2025 Mar 25:2025.03.24.644985. doi: 10.1101/2025.03.24.644985. PMID: 40196638; PMCID: PMC11974744 (PubMed) https://pubmed.ncbi.nlm.nih.gov/40196638/
Fernández-Götz, Manuel, and others (eds), Rethinking Migrations in Late Prehistoric Eurasia (London, 2022; online edn, British Academy Scholarship Online, 18 May 2023), https://doi.org/10.5871/bacad/9780197267356.001.0001
[25] Ibid
[26] Ibid
[17] Ibid
[28] Iñigo Olalde et al, Long-term hunter-gatherer continuity in the Rhine-Meuse region was disrupted by local formation of expansive Bell Beaker groups, bioRxiv, 25 Mar 2025, doi: https://doi.org/10.1101/2025.03.24.644985 , https://www.biorxiv.org/content/10.1101/2025.03.24.644985v1.full.pdf
Olalde I, et al, Long-term hunter-gatherer continuity in the Rhine-Meuse region was disrupted by local formation of expansive Bell Beaker groups. bioRxiv [Preprint]. 2025 Mar 25:2025.03.24.644985. doi: 10.1101/2025.03.24.644985. PMID: 40196638; PMCID: PMC11974744 (PubMed) https://pubmed.ncbi.nlm.nih.gov/40196638/
Kooijmans, L.P. Louwe, The Rhine/Meuse Delta: Four Studies on its Prehistoric Occupation and Holecene Geology, Lieden University Press, 1974
Fokkens, H., Steffens, B. J. W. & van As, S. F. . Farmers, fishers, fowlers, hunters: knowledge generated by development-led archaeology about the Late Neolithic, the Early Bronze Age and the start of the Middle Bronze Age (2850–1500 cal BC) in the Netherlands. Ned. Archeol. Rapp. 53, 978–990 (2016)
Kooijmans, L.P. Louwe, The Rhine/Meuse Delta: Four Studies on its Prehistoric Occupation and Holecene Geology, Lieden University Press, 1974
Parasayan O, Laurelut C, Bôle C, Bonnabel L, Corona A, Domenech-Jaulneau C, Paresys C, Richard I, Grange T, Geigl EM. Late Neolithic collective burial reveals admixture dynamics during the third millennium BCE and the shaping of the European genome. Sci Adv. 2024 Jun 21;10(25):eadl2468. doi: 10.1126/sciadv.adl2468. Epub 2024 Jun 19. PMID: 38896620; PMCID: PMC1118650 (PubMed) https://pmc.ncbi.nlm.nih.gov/articles/PMC11186501/
Cohen, Kim, Sediment History, Utrecht University, https://www.uu.nl/en/research/water-climate-and-future-deltas/storylines/sediments-matter/follow-the-sediment/sediment-history
Pierrik, H.J., E. Stouthamer, K.M. Cohen, Natural levee evolution in the Rhine-Meuse delta, the Netherlands, during the first millennium CE, Geomorphology, 295 (2017) 215-234, https://dspace.library.uu.nl/bitstream/handle/1874/352044/Natural.pdf?sequence=1
Arnoldussen, Stijn, A Living Landscape: Bronze Age Settlement Sites in the Dutch River area (c.2000-80 BC), Sidestone Press, 2008 https://www.sidestone.com/openaccess/9789088900105.pdf
Fokkens, H., Steffens, B. J. W. & van As, S. F. . Farmers, fishers, fowlers, hunters: knowledge generated by development-led archaeology about the Late Neolithic, the Early Bronze Age and the start of the Middle Bronze Age (2850–1500 cal BC) in the Netherlands. Ned. Archeol. Rapp. 53, 978–990 (2016)
Nienhuis, Piet, H. , Environmental History of the Rhine-Meuse Delta, Springer Science + Business Media B.V., 2008
Amkreutz, L. W. S. W. Persistent traditions: a long-term perspective on communities in the process of Neolithisation in the Lower Rhine Area (5500-2500 cal BC). (Sidestone Press, 2013).
Cromb., P. et al. New evidence on the earliest domesticated animals and possible small-scale husbandry in Atlantic NW Europe. Sci. Rep. 10, 1–15
Brusgaard, N. .. et al. Early animal management in northern Europe: multi-proxy evidence from Swifterbant, the Netherlands. Antiquity 98, 654–671 (2024).
Kooijmans, L. P. L. & Jongste, P. F. B. A neolithic settlement on the Dutch North Sea coast c. 3500 CAL BC. (Analecta Praehistorica Leidensia S., 2006).
Dreshaj, M., Dee, M., Brusgaard, N., Raemaekers, D. & Peeters, H. High resolution Bayesian chronology of the earliest evidence of domesticated animals in the Dutch wetlands (Hardinxveld-Giessendam archaeological sites). PLoS One 18, 1–23 (2023).
[29] See for example
Iñigo Olalde et al, Long-term hunter-gatherer continuity in the Rhine-Meuse region was disrupted by local formation of expansive Bell Beaker groups, bioRxiv, 25 Mar 2025, doi: https://doi.org/10.1101/2025.03.24.644985 , https://www.biorxiv.org/content/10.1101/2025.03.24.644985v1.full.pdf
Olalde, I. et al. A common genetic origin for early farmers from Mediterranean Cardial and Central European LBK cultures. Mol. Biol. Evol. 32, 3132–3142 (2015).
Lazaridis, I. et al. Ancient human genomes suggest three ancestral populations for present-day Europeans. Nature 513, 409–413 (2014).
Skoglund, P. et al. Origins and genetic legacy of Neolithic farmers and hunter-gatherers in Europe. Science 336, 466–469 (2012).
Curry, Andrew, The First Europeans Weren’t Who Your Might Think, National Geographic Magazine, August 2019, online: https://www.nationalgeographic.com/culture/article/first-europeans-immigrants-genetic-testing-feature
Reich, David (2018). Who We are and how We Got Here: Ancient DNA and the New Science of the Human Past. Oxford University Press.
Miller, Mark, Most European Men are Descended from just Three Bronze Age Warlords, New Study Reveals, 25 may 2015, Ancient Origins, https://www.ancient-origins.net/news-evolution-human-origins/most-european-men-are-descended-just-three-bronze-age-warlords-new-020361
Batini, C., Hallast, P., Zadik, D. et al. Large-scale recent expansion of European patrilineages shown by population resequencing. Nat Commun 6, 7152 (2015). https://doi.org/10.1038/ncomms8152
Abrams, Joel, A handful of Bronze-Age men could have fathered two thirds of Europeans, 21 May 2015, The Conversation, https://theconversation.com/a-handful-of-bronze-age-men-could-have-fathered-two-thirds-of-europeans-42079
[30] Bronze Age deforestation:
Agricultural Expansion: Bronze Age populations in the region expanded upstream along the Rhine and Meuse rivers, leading to extensive forest clearing for farming purposes. The introduction of ploughing techniques also intensified land use and soil disturbance.
Increased Sediment Load: Large-scale deforestation increased sediment runoff into the rivers. By Roman times (2000 years ago), the Rhine and Meuse carried significantly more fine sediment than before, roughly doubling the pre-Bronze Age levels.
Delta Alterations: The increased sediment delivery to the Rhine-Meuse delta caused major changes to the river network. The delta branch network underwent a “complete replacement,” with sediment deposition splitting discharge over more channels and leading to the silting up of older branches. This pulse of sedimentation helped shape the delta as it is known today.
Increased Flood Intensity: The increased sediment load and altered river channels likely led to increased flooding and sedimentation within the delta, potentially ending peat formation in some areas.
During the Late Bronze Age (1050-800 BC), there is evidence of a decline in settlement sites in the delta, potentially linked to increased flooding and changes in the river system. However, other research suggests that climate change might also have played a role in this decline.
While direct human impact in the delta began later, with activities like peat mining during Roman times and channel embankment in the Middle Ages, the impacts of upstream deforestation in the Bronze Age were already significant.
Huth, Christoper, Water between two worlds – reflections on the explanatory value of archaeological finds in a Bronze Age river landscape, 276 – 289 in Anne Lehoërff and Marc Talon, Movement, Exchange and Identity in Europe in the 2nd and 1st Millennia BC, Philadelphia: Oxbow s,, 2017, https://www.academia.edu/35831287/Water_between_two_worlds_reflections_on_the_explanatory_value_of_archaeological_finds_in_a_Bronze_Age_river_landscape
Fokkens, H., Steffens, B. J. W. & van As, S. F. . Farmers, fishers, fowlers, hunters: knowledge generated by development-led archaeology about the Late Neolithic, the Early Bronze Age and the start of the Middle Bronze Age (2850–1500 cal BC) in the Netherlands. Ned. Archeol. Rapp. 53, 978–990 (2016)
Parasayan O, Laurelut C, Bôle C, Bonnabel L, Corona A, Domenech-Jaulneau C, Paresys C, Richard I, Grange T, Geigl EM. Late Neolithic collective burial reveals admixture dynamics during the third millennium BCE and the shaping of the European genome. Sci Adv. 2024 Jun 21;10(25):eadl2468. doi: 10.1126/sciadv.adl2468. Epub 2024 Jun 19. PMID: 38896620; PMCID: PMC1118650 (PubMed) https://pmc.ncbi.nlm.nih.gov/articles/PMC11186501/
van Dinter, M., The Roman Limes in the Netherlands: how a delta landscape determined the location of the military structures, Netherlands Journal of Geosciences, 92-1, 11-13 2013, 11-32
Cohen, Kim, Sediment History, Utrecht University, https://www.uu.nl/en/research/water-climate-and-future-deltas/storylines/sediments-matter/follow-the-sediment/sediment-history
Pierrik, H.J., E. Stouthamer, K.M. Cohen, Natural levee evolution in the Rhine-Meuse delta, the Netherlands, during the first millennium CE, Geomorphology, 295 (2017) 215-234, https://dspace.library.uu.nl/bitstream/handle/1874/352044/Natural.pdf?sequence=1
Arnoldussen, Stijn, A Living Landscape: Bronze Age Settlement Sites in the Dutch River area (c.2000-80 BC), Sidestone Press, 2008 https://www.sidestone.com/openaccess/9789088900105.pdf
Fokkens, H., Steffens, B. J. W. & van As, S. F. . Farmers, fishers, fowlers, hunters: knowledge generated by development-led archaeology about the Late Neolithic, the Early Bronze Age and the start of the Middle Bronze Age (2850–1500 cal BC) in the Netherlands. Ned. Archeol. Rapp. 53, 978–990 (2016)
Allentoft, M. E. et al. Population genomics of Bronze Age Eurasia. Nature 522, 167–172 (2015)
[31] van Dinter, M., The Roman Limes in the Netherlands: how a delta landscape determined the location of the military structures, Netherlands Journal of Geosciences, 92-1, 11-13 2013, 11-32
van dinter, Marieke, Living along the Limes Landscape and settlement in the Lower Rhine Delta during Roman and Early Medieval times, PhD Thesis, Utrecht, 2017, https://www.academia.edu/35123998/Living_along_the_Limes_Landscape_and_settlement_in_the_Lower_Rhine_Delta_during_Roman_and_Early_Medieval_times
Cohen, Kim, Sediment History, Utrecht University, https://www.uu.nl/en/research/water-climate-and-future-deltas/storylines/sediments-matter/follow-the-sediment/sediment-history
Pierik, H.J., van Lanen, R.J., Roman and early-medieval habitation patterns in a delta landscape: The link between settlement elevation and landscape dynamics, Quaternary International (2017), http://dx.doi.org/10.1016/j.quaint.2017.03.010
[32] van dinter, Marieke, Living along the Limes Landscape and settlement in the Lower Rhine Delta during Roman and Early Medieval times, PhD Thesis, Utrecht, 2017, https://www.academia.edu/35123998/Living_along_the_Limes_Landscape_and_settlement_in_the_Lower_Rhine_Delta_during_Roman_and_Early_Medieval_times
Pierik, H.J., van Lanen, R.J., Roman and early-medieval habitation patterns in a delta landscape: The link between settlement elevation and landscape dynamics, Quaternary International (2017), http://dx.doi.org/10.1016/j.quaint.2017.03.010
van Lanen RJ, de Kleijn MTM, Gouw-Bouman MTIJ, Pierik HJ. Exploring Roman and early-medieval habitation of the Rhine–Meuse delta: modelling large-scale demographic changes and corresponding land-use impact. Netherlands Journal of Geosciences. 2018;97(1-2):45-68. doi:10.1017/njg.2018.3, https://www.cambridge.org/core/journals/netherlands-journal-of-geosciences/article/exploring-roman-and-earlymedieval-habitation-of-the-rhinemeuse-delta-modelling-largescale-demographic-changes-and-corresponding-landuse-impact/40F68343AEEC8FF41124C5F098069863
Cohen, Kim, Sediment History, Utrecht University, https://www.uu.nl/en/research/water-climate-and-future-deltas/storylines/sediments-matter/follow-the-sediment/sediment-history
[33] The Maastricht-Aachen corridor played a significant role in the early medieval period, particularly during the reigns of the Merovingian and Carolingian dynasties, despite the decline of Roman influence. Maastricht owed its existence to the Via Belgica, a major Roman road connecting Boulogne-sur-Mer to Cologne, as it provided a crucial crossing point of the Meuse river. A Late Roman Castellum (fort) and a bridge across the Meuse were key elements of the city’s infrastructure.
The Maastricht-Aachen corridor, building upon its Roman foundations and strategic location, evolved into a dynamic region in the post-Roman era. It served as a vital center of trade, a political hub, and a significant cultural center during the Merovingian and Carolingian periods, solidifying its place in early medieval European history.
During the Merovingian Period (450-750 AD), Maastricht became a significant center for trade and commerce due to its strategic location at the crossroads of important routes. The city’s location facilitated the minting and circulation of Merovingian coins throughout Europe. Archeological evidence confirms the presence of artisanal activities, such as pottery production, in Maastricht during this time.
During the Carolingian Period, Maastricht, along with Aachen and Liège, became part of the heartland of the Carolingian dynasty. Aachen evolved into a political and administrative center for Charlemagne.
Maastricht, Wikipedia, This page was last edited on 7 June 2025, https://en.wikipedia.org/wiki/Maastricht
Aachen, Wikipedia, This page was last edited on 8 June 2025,, https://en.wikipedia.org/wiki/Aachen
Arnoldussen, Stijn, A Living Landscape: Bronze Age Settlement Sites in the Dutch River area (c.2000-80 BC), Sidestone Press, 2008 https://www.sidestone.com/openaccess/9789088900105.pdf
Pierik, H.J., van Lanen, R.J., Roman and early-medieval habitation patterns in a delta landscape: The link between settlement elevation and landscape dynamics, Quaternary International (2017), http://dx.doi.org/10.1016/j.quaint.2017.03.010
[34] Mares, Boed, G-M201, 19 Feb 2025, Marres, https://www.marres.nl/EN/G-M201.htm
Francia, Wikipedia, This page was last edited on 13 June 2025, https://en.wikipedia.org/wiki/Francia
Franks, Wikipedia, This page was last edited on 13 June 2025, https://en.wikipedia.org/wiki/Franks
Altena, E., Smeding, R., van der Gaag, K.J. et al. The Dutch Y-chromosomal landscape. Eur J Hum Genet 28, 287–299 (2020). https://doi.org/10.1038/s41431-019-0496-0
van Es, W.A. and W.J.H. Verwers, Early Medieval settlements along the Rhine: precursors and contemporaries of Dorestad, Journal Archaeology in the Low Countries, 2-1 (May 2010) 5-39, https://jalc.nl/cgi/t/text/get-pdfcfad.pdf?c=jalc%3Bidno%3D0201a01
Uehlinger, Urs, Karl M. Wantzen, Rob S.E.W. Leuven, Hartmut Arndt, The Rhine River Basin, https://d-nb.info/1088795714/34
[35] Ardennes and Eifel are mountain ranges in Europe. “Their western starting point roughly begins where the Meuse river crosses the French-Belgian border. They stretch in a northeastern direction, covering eastern Belgium (Wallonia), northern Luxembourg and western Germany as far as the Rhine river between the cities of Bonn and Koblenz, and are bordered by the Moselle river on the south.“
Ardennes and Eifel, Wikipedia, This page was last edited on 1 November 2024, https://en.wikipedia.org/wiki/Ardennes_and_Eifel