Weaving Facts into a Family Story in Different Layers of Genealogical Time : Part Two

Historical context when writing a story is an aim when I research our family history. In addition to studying the basic facts of direct ancestors’ lives, if it is possible, my intent is to consider family stories and the social context in which ancestors lived. Sometimes this aim is difficult to achieve. When analyzing evidence in genealogical time layers outside the traditional genealogical period of time, family history takes on a different meaning and challenges to adding historical context to the story.

As we trace family lineages back in time our source of genealogical evidence changes and becomes limited. Stories shift from specific ancestors and families to lineages. Generations of ancestors shift to questions of where and when genetic mutations may have occurred. The methods we use to gather evidence also change.

Our notion of ‘family’ changes. We have two ‘sets’ of family: genealogical and genetic. Both are related and overlap but not identical. Our terminology and focus on describing ‘family’ characteristics changes. Our general orientation to recreate historical context and describe influencing factors in family stories change.

Fundamental questions arise regarding what are the differences and limitations when writing family history in different genealogical layers of time. While there are differences, there is a line of connectivity and coherence in what we call ‘family’ across the three genealogical layers of time. The sources of contextual evidence are different in each time layer. In the genealogical time payers of deep ancestry and the period of lineages, our family stories can be gleaned from paleo-genomic research and macro cultural anthropological research.

The Three Layers of Genealogical Time

In the first part of this story, I outlined three layers of genealogical time that have unique characteristics.

  • Short Term – Normal Time: This is the realm of traditional genealogy and family history that spans roughly 300 years or 10 generations. I use 31 years are one generation. [1];
  • Mid Range – Lineages: This middle layer of time can be viewed within a genetic genealogical perspective that focuses on Y-STR mutations. It is a period where surnames emerge. Using traditional genealogical methods with genetic genealogy can lead to promising leads on the location of haplogroup groups based on surnames and geographical areas. The middle historical time layer can be viewed in terms of tracing Single Nucleotide Polymorphisms (SNP) and Short Tandem Repeats (STR) Y-DNA mutations in lineage / clan groups and haplogroups.
  • Long Range – Deep Ancestry: This is the foundational layer of genealogical time. It can provide an understanding of the correlation between haplogroup migration and geographical location. This time layer focuses on the correlation of genetic evidence with ancient cultural groups that existed in specific geographical areas and long-term climate and landscape changes as well as historic cultural geographical patterns across long stretches of time. This long range layer of time can be viewed within a genetic genealogical perspective that focuses on Y-SNP mutations;

Each of these layers of time are associated with differing orientations and sources of contextual background information to create family stories.

Reframing Contextual Factors for Mid Range and Deep Ancestry Time Layers

In the traditional genealogical time layer we have paper, digital and physical sources of historical evidence to create family stories. Contextual factors are broadly encapsulated in four social structural levels. (See table one.) They can help explain or provide descriptive information surrounding an ancestor or family’s life experiences in a particular time period.

Table One: Social Structural Levels or Networks of Influence in the Traditional or Short Term Genealogical Time Layer

Social Structural
Level
Examples of Social Structural Influences
IndividualFamily Member / Couple
Nuclear Family
Micro LevelExtended Family / Local Neighborhood
Local Social Groups (Church, Local Community)
Local Occupational Work Groups
Intermediate LevelEthnic Networks
Economic Strata / Class
City-Wide area / Local Regional Areas
Macro LevelState and National Level
European Country
Geographical Region

In addition to the various social structural levels that may play a prominent role in describing the experiences of ancestors and their families, there are ecological, technological, economic, cultural influences that may add historical context to the story. These influences may affect specific or all social structural levels, as illustrated below.

Illustration One: Time and Historical Context of Structure, Culture, and Other Factors in the Short Range Time Layer

As we move back in time, contextual evidence increasingly becomes associated with the intermediate and macrostructural levels. The ability to document these historical contextual factors of influence diminish as was we go back into the mid range and long range genealogical time layers. Evidence is not available for certain social structural levels and other contextual historical factors. This is illustrated in table two.

Table Two: Likelihood of Finding Information from Social Structural Levels Associated with Traditional Genealogy

Time Period / Layer
IndividualMicro LevelIntermediate
Level
Macro
Level
Long Range – Deep AncestryXX
Mid Range – LineagesXXX
Short Term – Normal TimeXXXX

Our frame of reference shifts from individual ancestors and families to terminal single nucleotide polymorphisms (SNPs), short tandem repeats (STRs), the most recent common ancestor (tMRCA), haplotypes, haplogroup subclades, modal haplotypes and branches. [2]

Y-DNA SNP and STR mutations or mtDNA SNPs are the basic frames of reference for the mid range and long range time layers. These mutations help identify groups, based on those mutations, loosely akin to what are families in the short term or traditional time layer.

SNPs and STRs: The Underlying Connection Between the Three Time Layers

In a nutshell, SNPs, single nucleotide polymorphisms, are the mutations that define different haplogroups. Haplogroups reach far back in time on the direct paternal, generally the surname, line. [3]

SNPs and STRs are the building blocks that tie the three genealogical time layers together. While both are part of each time layer, one can argue that SNPs characterize the long term genealogical time layer while STRs are provide a unique discriminatory power in the mid range or period of lineages genealogical time layer.

A Base Pair in DNA

Two complementary nitrogenous bases (adenine with thymine, and cytosine with guanine) that pair together to form the “rungs” of the DNA double helix, held together by hydrogen bonds. They are the building blocks of DNA structure where the sequence of these base pairs encodes genetic information.

Illustration Two: A Base Pair 

SNPs represent variations at a single DNA base position where one nucleotide in the DNA string is substituted for another. STRs are repeated sequences of DNA that consist of 2-6 base pairs occurring in a head-tail manner. For example, a sequence of DNA base sequences in the DNA chain resembling “GATAGATAGATAGATA” represents four repeats of the “GATA” pattern. These repeats can vary in length among different individuals, making them highly polymorphic (the occurrence of multiple distinct forms or variants). [4]

SNPs and STRs serve distinct purposes in genetic analysis across different time periods due to their unique mutation characteristics. STRs are ideal for recent genetic analysis (short range and mid range time periods) because they have a high mutation rate of approximately 10-3 to 10-4 per generation. [5] [6] This makes them particularly useful for population differentiation studies, genealogical matching within the past 500 years to 800 years, and forensic DNA testing and kinship analysis. [7] Completing a’ Big Y’ DNA test provides matches back 1,500 years. [8]

SNPs are better suited for studying ancient (long range) genetic history. They have extremely low mutation rates of approximately 10-8 . [9] They are considered “once in the lifetime of mankind” events. [10] They can effectively track population divergence dating back to the African exodus 50,000-75,000 years ago. [11] As more male individuals are tested, the SNP haplotrees can become more refined and identify sub branches or subclades in what I have identified as the mid range and short range time periods.

From a technical angle, SNPs work better with degraded DNA (e.g. ancients bones) due to smaller target regions. They also have greater mutational stability and require 40-60 loci to match the discriminatory power of 13-15 STRs. [12]

STRs provide higher information content per locus due to multiple alleles. (An allele is a variant form of a gene that occurs at a specific location (locus) on a DNA molecule.) They also can be used for high-resolution description of human evolutionary history. [13]

As indicated in illustration three below and discussed in a previous story, the “One-Two” punch of Y-DNA testing involves using the results of Y-SNP DNA tests to provide a general location of Y-DNA testers on the Y-DNA haplotree based on nested haplogroups. The ‘second punch’ uses Y-STR test results to help group test results within recent haplogroup branches and to assist in analyzing potential individual matches.

The analysis and comparison of individual Y-STR test results can help delineate lineages and tease out branches within the haplotree, fine-tuning relationships between people within the tree. The “One-Two Punch’ approach with SNP and STR data is particularly helpful in trasing out genetic ties with test results associated with different surnames and before the use of surnames in the period of lineages genealogical time layer.

Illustration Three: The Relationship Between SNPs and STRs in Refining Haplogroup Branches

Click for Larger View | Source: Modified illustration from J. David Vance, DNA Concepts for Genealogy: Y-DNA Testing Part 2, 3 Oct 2019 https://www.youtube.com/watch?v=mhBYXD7XufI&t=355s

While STR tests are used by individual testers to discover possible Y-DNA genetic matches with other testers, the results of STR tests can also provide insights into macroscopic demographic properties that can shed light on lineages and clans – well before the time of surnames. Y- STRs have a time window that runs back to the late Bronze Age. 

STRs … tell us about demography — specifically about bottlenecks and subsequent expansions, namely “founder events.” While SNPs tell us when they were created, STRs tell us about when the population burgeoned after a founding mutation. That SNP and STR clades have a fundamentally different interpretation has caused considerable confusion, but once understood, the methods are very useful complements.” [14]

STRs have been viewed as having limited use in estimating dates beyond about 50 to 100 generations (e.g. 1,550 – 3,100 years before present). However, there have been studies that indicate STR data can be utilized to for genealogical analysis into the Paleolithic era. (The Paleolithic period, also known as the Old Stone Age, generally spans from around 3.3 million years ago to approximately 11,650 years ago.) [15]

The Haplogroup and Most Recent Common Ancestor as the ‘Generation’ in the Mid Range and Deep Ancestry Time Layers

The concepts of an haplogroup and the Most Recent Common Ancestory (tMRCA) play a tandem role as defining what can be called a ‘generation’ in the deep ancestry and period of lineages genealogical time layers. However, pinpointing a ‘generation’ in the mid-range and long range time periods is not as exact as in the short range genealogical time layer.

A haplogroup can be considered like an ancestor on your family tree. Each haplogroup forms a branch on that family tree. Depending on the age of the haplogroup (when it formed), you may have the name of that ancestor, or the ancestor may have lived so long ago that their name has been lost to time.

“Each haplogroup formed at a specific time and in a specific location. Testing of modern peoples and ancient DNA informs us of those locations and phylogenetic experts are able to build not just a tree of humankind, but also migration paths that those haplogroups took across and out of Africa and to the other continents.” [16]

A Y-DNA SNP mutation is akin to a direct paternal descendent. Haplogroups contain one or more unique SNP mutations. Each unique SNP mutation within the haplogroup pertain to a single line of descent. Each haplogroup originates from, and remains part of, a preceding single haplogroup.

As such, any related group of haplogroups may be precisely modelled as a nested hierarchy, in which each set (haplogroup) is also a subset of a single broader set (as opposed, that is, to biparental models, such as human family trees). Haplogroups can be further divided into subclades.[17]

There is at least one SNP mutation associated with a haplogroup. However, many haplogroups may have more than one SNP mutation associated with it, referred to as equivalents or equivalent SNPs.

“Equivalent SNPs” in a haplogroup refer to multiple SNPs that occur on the same genetic branch, essentially meaning they all indicate membership in the same haplogroup, even though they are slightly different mutations at the DNA level. Essentially they are considered the same for identifying a haplogroup as they all point to the same ancestral lineage within that group. 

These SNPs are located on the same branch of the phylogenetic tree, indicating they arose around the same time in evolutionary history and are associated with the same haplogroup. It is often difficult to determine the exact chronological order of occurrence between equivalent SNPs. When multiple SNPs are tested, if they all show the same pattern (positive or negative for the same haplogroup), it strengthens the identification of that haplogroup. [18]

Equivalent SNPs are variants that occupy the same branch as one another. This occurs when multiple SNPs are tested positive and negative for the same upstream and downstream SNPs and have all yielded the same positive and negative results from testers as the main SNP on the branch, making it impossible for our phylogenetic expert to confidently determine which of these variants are upstream or downstream of the others.[19]

When multiple equivalent SNPs exist, they are often listed together in haplotrees and source documentation. Different laboratories and corporations may select different equivalent SNPs as their primary or defining marker for the same haplogroup.

In each nested genetic set of SNPs, there resides a ‘Most Common Recent Ancestor’. The determination of relationships of identified SNP mutations within the haplogroup relies on statistical methods like the rho statistic to estimate the time to most recent common ancestor (TMRCA), next-generation sequencing techniques that can identify SNPs in an unbiased way, and high-quality coverage of the Y chromosome to ensure accurate SNP identification. [20]

When dealing with equivalent SNPs in a haplogroup, the focus is not on choosing a single “most recent” common ancestor, but rather on understanding that these mutations represent the same ancestral point in the haplogroup’s history. The actual age estimation of the common ancestor is calculated using statistical methods and ‘molecular clock’ calculations rather than trying to determine which of the equivalent SNPs came first. [21]

In genetic genealogy, the most recent common ancestor (tMRCA) refers to the most recent individual from whom two or more people being tested are directly descended, essentially the point in time where their genetic lineages converge based on DNA analysis. The MRCA can be a specific person in a family tree, or a population-level ancestor estimated through genetic data analysis. Regarding the latter, the MRCA will often be represented by an estimated birth date and a statistical confidence level associated with the estimated date. [22]

Rob Spencer provides a cogent explanation of the relationship with tMRCA and when haplogroups are formed. Illustration four depicts an example of how the tMRCA and haplogroup formation dates can be different.

Illustration Four: Formation Dates of Haplogrups and tMRCA

Click for Larger View | Source: Spencer, Rob, Data Source and SNP Dates, Discussion, SNP Tracker,http://scaledinnovation.com/gg/snpTracker.html

Spencer’s illustration focuses on the fact that the determination of when the MRCA emerged or was estimated to be born varies depending on who or what organization is calculating the MRCA date. The variation in estimates is also dependent upon the number of SNP mutations associated with a specific haplogroup.

In a rapidly expanding population with many surviving lineages, tMRCA and formation are very close and may be identical. But for older and leaner lineages, a SNP may appear long before one of the originator’s descendants has two surviving lineages, and additional separate mutations may occur in that time. In the sketch, (illustration above), SNP S2 is one of 21 such equivalents: different mutations but evidently from a long unbranched line, since all DNA testers either have none of these 21 SNPs or they have all of them. The tMRCA for S2 is shown in blue; it’s where branches that have S3 and S4 split away. But the formation time for S2 cannot be directly measured and it could be anywhere between S2’s tMRCA and the previous tMRCA. YFull’s convention is to assign a SNP’s formation date to the previous SNP’S tMRCA (the left-most of the long run of equivalent SNPs). But it is perhaps better to estimate the formation date as halfway between, as shown by the red dot, which is what SNP Tracker does.” [23]

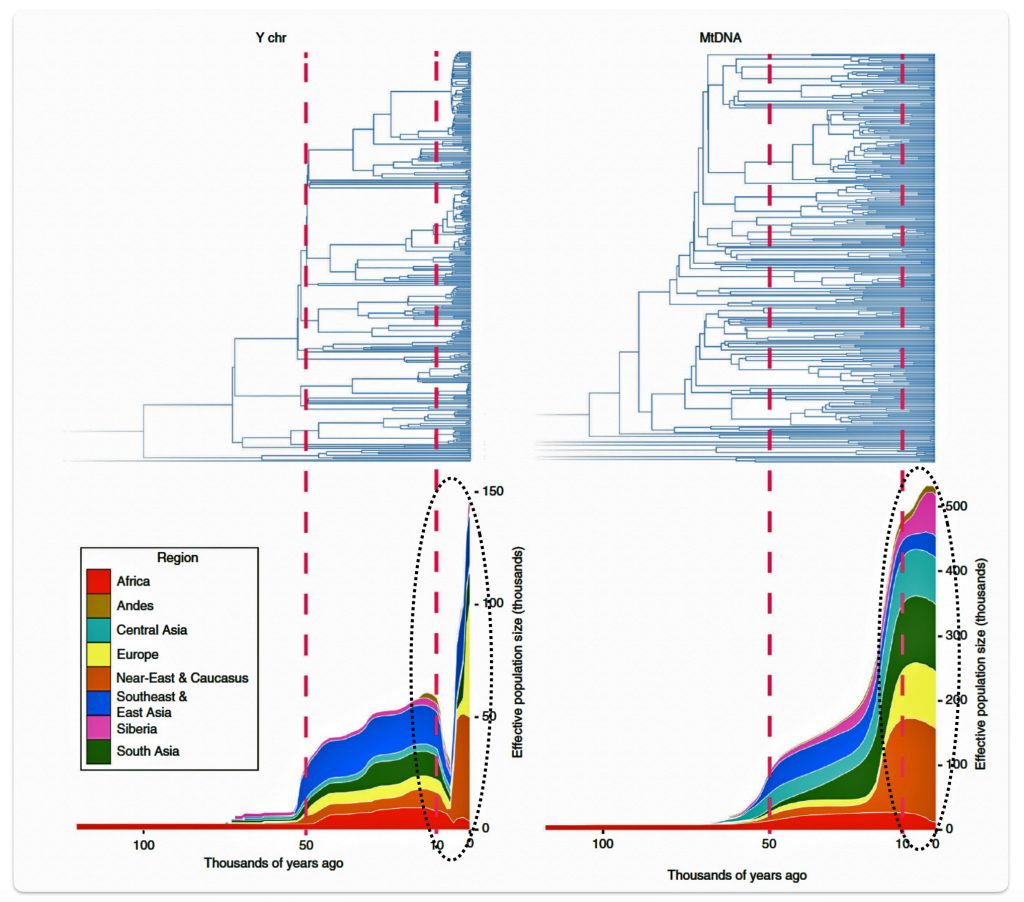
Different haplogroups exhibit substantial variation in their mutation rates. This can be due to bottlenecks or expansion in populations. Bottleneck events can create distinctive patterns that increase the rate of coalescence between lineages, lead to fewer overall haplotypes, and result in higher frequencies of the most common haplotypes. [24]

Different haplogroups may have undergone varying levels of genetic diversification based on their demographic history and population size. Migration patterns can create unique combinations of variants. [25] Some haplogroups have experienced more mutations over time due to geographic isolation leading to distinct mutation patterns, larger population sizes allowing more opportunities for mutations to occur, and older lineages having more time to accumulate variants. [26]

The age of population splits affects variant distribution. Older lineages have had more time to accumulate variants. Recent demographic events (5,000-10,000 years ago) particularly shape the distribution of rare variants. Population-specific variants can arise either from new mutations within a population or from the loss of variants in other populations [27]

The impact of growth on SNP variant diversity is particularly evident in founder populations, where initial small population sizes followed by rapid expansion create unique patterns of genetic variation and haplogroup distribution [28]

Differences between ‘Generations’ and ‘Haplogroups’

The parallel between ‘generation’ in the traditional genealogical time layer and ‘haplogroup’ in the other two time layers is limited. A family is associated with a specific network of individuals that can be associated with a ‘generation’. A generation is a group of people born around the same time and generally in the same area. A generation is also the average period of time it takes for children to be born, grow up, become adults, and have children. [29]

A haplogroup, on the other hand, is a group of people with similar genetic SNP and STR markers that can be traced back to a common ancestor. That common ancestor could have lived thousands of years before the group of people identified as having similar genetic markers. Despite the limited similarity between the terms family and haplogroup, their similarity is based on their ability to connect and trace patrilineal or matrilineal connections across each of the three time layers.

Illustration five below provides an example of comparing ‘generational’ and ‘haplogroup’ properties based on my genealogical evidence. On the left hand side of the illustration is eight generations depicting my patrilineal family lineage through traditional genealogical research. To the right of my traditional patrilineal lineage is my ‘recent’ genetic genealogical lineage depicted through haplogroups based on SNP mutations along my patrilineal line.

As reflected in the illustration, my traditional patrilineal genealogical tree depicts eight generations between fathers and sons. Generations can be viewed as the years between father and son. In this instance, generations range from 21 years to 41 years. My patrilineal line of descent, which comprises eight generations back, spans 217 years.

Illustration Five: Comparison of Generations in a Traditional Family Tree and ‘Genetic Generations’ in a Haplotree

Click for Larger View | Sources: The traditional patrilineal line is based on personal genealogical research. The haplogroup information is based on genetic data test results from the Y-700 DNA test from FamilyTreeDNA (FTDNA)

The recent haplogroups or ‘genetic generations’ in my patrilineal line, as reflected in illustration four, comprise five SNP mutation levels or ‘genetic generations’ prior to my terminal YDNA SNP which is identified as G-FT48097. There is another haplogroup that split off of my most recent haplogroup G-FY211678 that I am related to and is idenified as G-FT119236. I am not directly related to the G-FT119236 haplogroup.

As depicted in table three, three things are particularly notable with haplogroups: the range of years between each haplogroup, the variance of the number of SNPs associated with each haplogroup and the number of immedite descendants or subbranches for each haplogroup. The number of years that are between each haplogroup range from an estimated 50 years to 1400 years. The number of SNPs associated with each haplogroup vary greatly. A third observation, not evident in illustration five, is the number of branches or subclades – the number of male descendants from each haplogroup.

Table Three: SNP Variants and Immidiate Male Descendants Associated with Selected Haplogroups

HaplogroupNumber of
Associated
SNPs
Estimated Years
Between Haplogroup
Number of Phylogenetic Subclades
G-Z674829– –2
G-Y383352502
G-Z4085751504
G-Y13250521504
G-BY21167833002
G-FT48097– – 500

Corresponding to the same time frame as table three, illustration six depicts a phylogenetic tree of haplogroups and subclades or branches that are associated with my ‘recent’ genetic descendants from haplofgroup G-Z6748.

Illustration Six: Phylogenetic Trees of Haplogroups Descending from G-Z4768

Click for Larger View | Source: A portion of and modification of Rolf Langland and Mauricio Catelli, Haplogroup G-L497 Chart D: FGC477 Branch, 2 Aug 2024, G-L497 Y-DNA Work Group, FamilyTreeDNA, https://drive.google.com/file/d/1xuZseoX40tWQhU5TpXZXqD6Y9zI9eqVz/view

Table four illustrates the wide variance in estimating the year of birth for each of the common ancestors associated with each haplogroup. While individual dates should be interpreted cautiously, collectively they can provide reliable benchmarks. Most genealogists recommend using 95% confidence intervals for the most accurate interpretation of results. Sixty-eight percent confidence intervals are recommended for narrower, but less certain estimates [30]

Table Four: The Most Recent Common Ancestor (tMRCA) Associated with Each Haplogroup

HaplogroupEstimated
Birth Date
of tMRCA
95 %
Confidence
Range of Birth
95%
Confidence
in Yrs
Rounded
Estimate
of tMRCA
Birth Date
G-Y38335708 CE425 – 943 CE518 yrs700 CE
G-Z40857970 CE737 – 1162 CE425950 CE
G-Y1325051115 CE841 – 1332 CE4911100 CE
G-BY2116781413 CE1210 – 1571 CE3611400 CE
Source: FamilyTreeDNA Big Y Data Haplotree, accessed 26 Jan 2025

The reliability of Y-DNA SNP-based MRCA estimates varies significantly depending on the timeframe and methodology used. For genetic genealogy purposes, the accuracy varies by depth of time. For prehistoric migrations for about 5000 years, there is a variance of 500 years in precision. For MRCA’s within 200 years, it is estimated that he variance could be around a 30 year variance. For MRCA dating based on cultural origins within 800 years, the precision of the estimate is plus or minus 500 years. [31]

Different testing companies use varying mutation rates. YFull utilizes 144.4 years per SNP. FamilyTreeDNA results associated with the BigY500 DNA test utilized : 131.3 years per SNP. For the BIig Y 700 Y-DNA test, a mutation rate of 83.3 years per SNP is used. [32]

Haplotrees as Family Trees in the Mid Range and Long Term Genealogical Time Layers

A haplotree is a branching diagram that shows the evolutionary relationships and genetic ancestry of human populations through inherited genetic markers. These trees represent the journey of human genetic lineages and help visualize how different groups are related to each other genetically. [33] There are two main types of haplotrees: Mitochondrial DNA (mtDNA) haplotrees that track maternal lineages through mitochondrial DNA and Y-DNA haplotrees that track paternal lineages through Y chromosome mutations.

Haplotrees follow a nested hierarchical structure where each haplogroup originates from and remains part of a preceding haplogroup. They are typically labeled using alphabetical nomenclature, starting with an initial letter followed by numbers and additional letters for refinements (e.g., A → A1 → A1a). [34]

The Y-DNA haplotree is particularly dynamic, with new branches being added frequently as more genetic data becomes available. As of recent updates, it has grown significantly from its initial 153 branches and 243 Y-SNPs to encompass thousands of documented genetic lineages. [35]

As of February 2024, it was claimed that the Y-DNA haplotree contains 76,626 distinct branches (as of February 2024). [36] Another source indicates by the end of 2024, these totals grew to 86,892 branches and 734,748 variants, marking a full-year increase from 2023 of 11,823 branches (15.5%) and 83,752 variants (12.9%). [37]

Unlike the Y DNA tree, which is defined and constructed by the genetic community, new mitochondrial DNA branches cannot be added to the official mitochondrial Phylotree. The official mitochondrial Phylotree is maintained at www.phylotree.org and is periodically updated. The most recent version is mtDNA tree build 17, published and updated in February 2016. [38]

Haplotrees are built on the principle that genetic mutations accumulate and remain fixed in DNA over time. When a mutation occurs, all descendants of that individual will carry that genetic marker. The sequential nature of these mutations allows scientists to reconstruct the historical order of genetic changes and map human migrations throughout history.

Illustration seven depicts the major branches for the Y-DNA haplogroup tree and illustration eight depicts the major branches for the mtDNA maternal lineages .

Illustration Seven: Major Branches of the Y-DNA Haplogroup Tree

Click for Larger View | Source: Primary structure of the Y-chromosome tree. Nineteen letters label monophyletic clades, but three of these (orange) denote internal branches ancestral to other lettered haplogroups: F is an ancestor of G, H, I, J, and K; K is the common ancestor of L, T, N, O, S, M, and P; and P is an ancestor of Q and R. A twentieth letter, “A”, marks a paraphyletic group of the four most highly diverged clades: A00, A0, A1a, and A1b1 (blue). Multi-letter labels represent joins. For example, DE is the parent of D and E. Finally, A1b is the parent of A1b1 and BT, the common ancestor of all non-A haplogroups. Source: 23andMe to Update Paternal Haplogroup Assigments, 11 Apr, 2024, 23andMe Blog, https://blog.23andme.com/articles/23andme-updates-paternal-haplogroup-assignments

Illustration Eight: Major Branches of the mtDNA Haplogroup Tree

Click for Larger View |Source: Modification of diagram found at – Katy Rowe-Schurwanz, Learn about the significance of mtDNA haplogroups and how your mtDNA test results can help you trace your maternal ancestry back to Mitochondrial Eve, 19 Jul 2024, FamilyTreeDNA Blog, https://blog.familytreedna.com/interpreting-mtdna-test-results/
Click for Larger View | Source: FamilyTreeDNA

We can look at my DNA results in the context of haplotrees. Results of my FamilyTreeDNA (FTDNA) Y-700 DNA test indicate my Y-DNA terminal haplogroup is G-BY211678 and my mtDNA phylotree is H50.

The relative positions of these results are indicated in illustrations nine and ten of the major haplotree branches by blue circles.

Given the specificity and the wide range of SNPS tested in the Y-700 DNA test, my results reflect a new terminal end point, FT-48097 in the G -BY211678 branch of the G Haplotree. [38] A terminal SNP represents the furthest known branch or “leaf” on haplotree tree. (See Illustration nine.)

This metaphorical tree framework has proven so useful that it has become a standard way to visualize and understand Y-DNA testing results, with modern genetic testing companies like Family Tree DNA adopting it as their primary way to represent genetic relationships.

Illustration Nine: The Tree Metaphor for explaining Branches in the G Haplotree Branch and My Test Results

The application of the tree metaphor specifically to terminal SNPs emerged from the broader field of genetic genealogy and haplogroup identification. A terminal SNP represents the furthest known branch or “leaf” on a person’s genetic tree. This modern usage combines the traditional tree metaphor with current genetic science and the branch structure of the DNA haplotree. The main branches or subclades represent major haplogroups. Smaller branches indicate subgroups. The terminal SNP represents the smallest “leaf” on the branch.

Unlike Y-line DNA, no additional SNP tests are required to fully determine one’s mitochondrial DNA haplogroup.  The full mitochondrial sequence test (mtFullSequence) at FTDNA provides the most detailed, full haplogroup designation. With the HVR1 (mtDNA) and HVR2 (mtDNAPlus) tests, you receive a base haplogroup.  The full sequence is required to determine your full haplogroup.

To put this in perspective, think of your mitochondrial DNA as a clock face. There are a total of 16,569 locations in your mitochondrial DNA. The HVR1 test tests the number of locations from 11:55 to noon and the HVR2 test tests the number of locations between noon and 12:05PM.  The full sequence test tests the rest, the balance of the 50 minutes of the hour.[39]

Illustration Ten: The H50 Branch on the mtDNA PhyloTree

Click for Larger View | Source: PhyloTree.org – mtDNA tree Build 17 (18 Feb 2016): subtree R0, http://www.phylotree.org/tree/R0.htm

Reframing Contextual Factors for Mid Range and Deep Ancestry Time Layers

Given the change in the frame of reference in developing family stories in the mid and long range time periods, it is more useful to redefine the four ‘social’ structural levels of influence in genetic genealogical terms, as indicated in table five.

Table Five: Comparison of Structural Influences between Different Genealgical Layers of Time

Social Structural
Level
Examples in
Short Term
Time Layer
Examples in
Mid Range &
Long Range
Layers
IndividualFamily Member;
Couple;
Nuclear Family;
‘A generation’
Terminal SNP;
Private Variant;
the Most Recent Common Ancestor
(tMRCA)
Micro LevelExtended Family;
Local Neighborhood;
Local Social Groups
SNP & STR Groups;
Genetic Distance;
Haplogroup subclade;
Modal Haplotype;
tMRCA
Localized Geographical Area
Intermediate LevelEthnic Networks;
Strata / Class;
City-Wide area;
Local Regional Areas
SNP Haplogroup
Sub-branches / Subclades;
Modal Haplotype;;
tMRCA
Regional Geographic Area
Macro LevelState & National Level;
European Country;
Geographical Region
Migratory Paths of Haplogroups;
Major Branches of Haplogroups;
tMRCA;
Regions of Europe

The ‘individual‘ level in the mid range and long term levels of time are ideally represented by a terminal SNP or private variant. A terminal SNP is the defining mutation that represents the most recently known branch on a Y-DNA haplogroup tree, an haplotree. A private variant is a genetic mutation that has occurred in a specific family line but has not yet been found in other tested individuals. These variants represent new SNPs that are unique to particular lineages. [40]

New branches emerge when a variant not only becomes a Named Variant but also fulfills additional criteria: at least one person must test negative for it. This “negative test” helps distinguish the new branch from equivalent ones, signaling a point of divergence in the tree. Each branch represents a distinct lineage, connecting individuals to their unique paternal heritage and further refining our understanding of the tree’s structure.[41]

There are distinct differences between private variants and terminal SNPs. When a private variant is found in enough testers and receives official designation, it can become a new terminal SNP for those who carry it. This demonstrates the evolving nature of genetic genealogy classification as more people test their DNA.

The ‘micro‘ level is represented by haplogroup subclades or branches that are related to the terminal SNP or private variant. The subsclades are in a ‘local’ geographical area and are related to a common ancestor that resided in that geographical area. It is analogous to the ‘extended family’ or ‘local social groups’ . This is the genetic social structural level that can reveal the emergence of surnames in the period of lineages.

Illustration Eleven: Genealogical Time and Social Structural Levels

The ‘intermediate‘ level straddles the mid range and long range time layers of genealogical time. The social structures in this time layer are akin to ‘ethnic networks’ or larger networks and haplogroups based in ‘regional geographical areas’. It is represented by a larger portion of haplogroup subclades which comprise haplogroup branches that have a common genetic ancestor that migrated from one geographical area to another. The Phylogenetic tree of haplogroups descending from G-Z4768 in illustration six above would be an example.

The ‘macro‘ level is in the long range genealogical time layer. It is graphically reflected by the migratory paths of major branches in an haplogroup lineage. This time layer is similar to French historian Fernand Braudel’s “long duration”. It is a time layer which emphasizes studying history or genealogy through the lens of long-term, slow-moving structures like geography, climate, and demographics, rather than focusing on short-term events or individual figures. It is essentially looking at the deep, underlying patterns of history that persist over extended periods of time, often beyond human memory. [42]

Illustration twelve depicts the differences in the social structural levels in each of the three genealogical time layers.

Illustration Twelve: Historical Context of Social Structure in the Three GenealogicalTime Layers

The three layers of genealogical time rely upon different methods of gathering contextual evidence. I have discussed contextual factors found in the traditional or short term genealogical time layer in a previous story.

As depicted in illustration thirteen, in addition to the various social structural levels that may influence our development of a story about a family member of family in the traditional genealogical time layer, there are ecological, technological, economic, cultural influences that may add historical context to the story. These influences may affect specific or all social structural levels. Rather than delve into possible relationships of causation, I have simply recognized the impact of and interplay between social, cultural, technological influences when weaving stories from our genealogical evidence.

Illustration Thirteen: Social Structural Levels and Other Influences in the Three Genealogical Time Layers

The long term and mid range ancestry genealogical time layers are also influenced by contextual factors. However, the ability to retrieve evidence on these factors diminishes as one goes back in time. These contextual factors in the period of deep ancestry are largely the outcome of a series of environmental, demographic and evolutionary events reflected in migration, genetic bottlenecks, founder events, admixture, population isolation, natural selection and genetic drift which occurred in different parts of the world at various time points in history. [43]

In human populations, changes in genetic variation are driven not only by genetic processes themselves, but can also arise from environmental, cultural or social changes. SNPs and STRs are influenced by several key factors that affect their occurrence and distribution throughout the genome. Demographic population patterns significantly influence SNP and STR mutation patterns through several key mechanisms.

Rob Spencer’s research in genealogy, particularly regarding “bottleneck” events, focuses on identifying periods in a population’s history where a significant decrease in population size occurred, which can leave a noticeable genetic signature in the genealogical record and impact the diversity of descendants today. Conversely, a founder event happens when a small group separates from a larger population to establish a new colony. [44]

Cultural factors and processes can influence migration patterns and genetic isolation of populations, and can be responsible for the patterns of genetic variation as a result of gene-culture co-inheritance (e.g. a preference of cousin marriage). Understanding how social and cultural processes affect the genetic patterns of human populations over time has brought together anthropologists, geneticists and evolutionary biologists, and the availability of genomic data and powerful statistical methods widens the scope of questions that analyses of genetic information can answer.” [45]

The long term and mid range ancestry genealogical time layers rely on paleo-genomic, anthropological sources and historical analyses of cultural groups for contextual evidence. [46] The contextual sources for the deep ancestry time period are discussed in part three of this series of stories.

Illustration Fourteen: Historical Context of Social Structure, Culture, and Other Factors in the Three Genealogical Time Layers

A Illustrative Model for Depicting the Mid Range and Long Term Genealogical Time Periods

Examples for each of the four structural levels in mid and long range genealogical time are provided in an illustrated model of genealogical time and historical contexts of structural and cultural factors below.

Illustration Fifteen: Time and Historical Context of Structure, Culture, and Other Factors in the Mid and Long Range Genealogical Time Layers

The examples for each of the social structural levels in the illustration are based on my genetic genealogical past. The examples for creating the illustration are from various sources. [47]

Reference
Number in
Model
Structural LevelExample
OneIndividualMy terminal SNP G-FT480 based on Y-700 FamilyTreeDNA results
TwoMicroPhylogenetic Tree of Decendents of Haplogroup G-Y132505
ThreeIntermediatePhylogenetic Tree of Decendents of Haplogroup G-Z6748
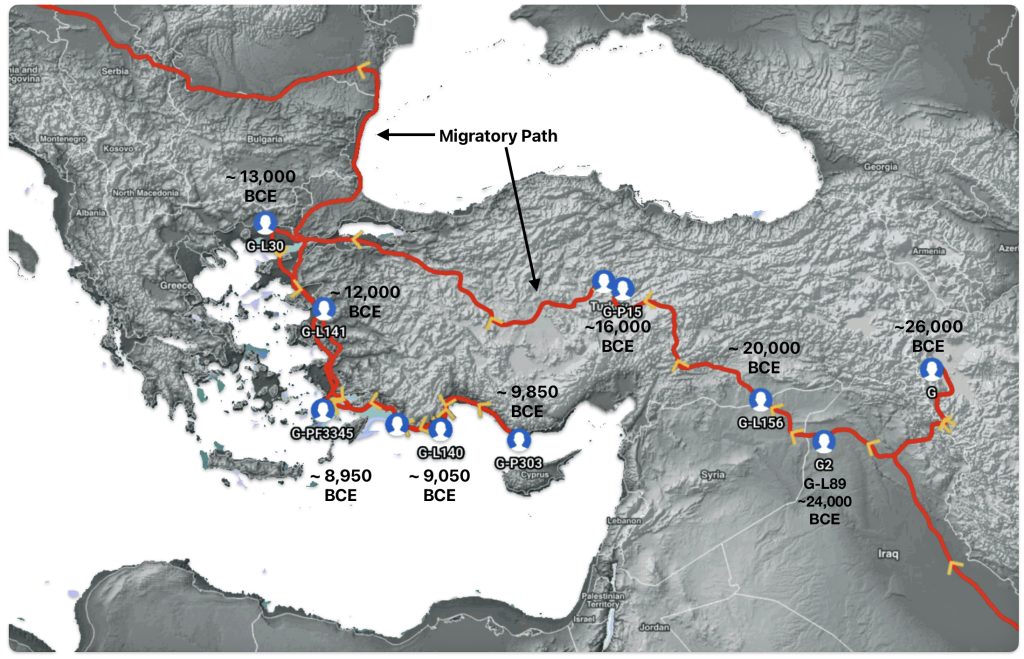
FourMacroMigratory Path of G Haplogroup in Europe

Reference Number 2 & 3 in the Model

The Phylogenetic tree is based on the current YDNA descendants of Haplogroup G-Z6748.

A subset of the phylogentic tree, which represents the micro level, is the haplogroup G-Z6748. This haplogroup appears to be a largely Welsh haplogroup, though extending into neighboring parts of England.

My Y-700 DNA test results as reflected in work compiled by the project administrators of the FamilyTreeDNA G-L497 work group project. [48]

Reference Number 4 in the Model

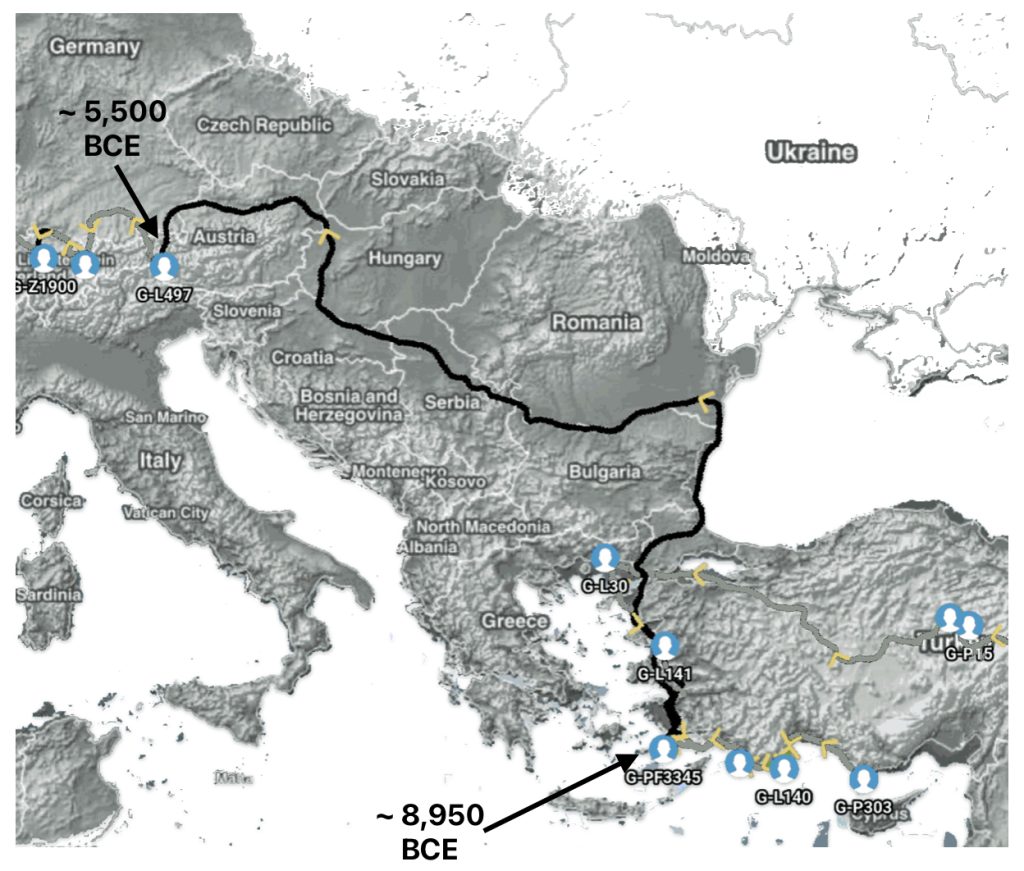
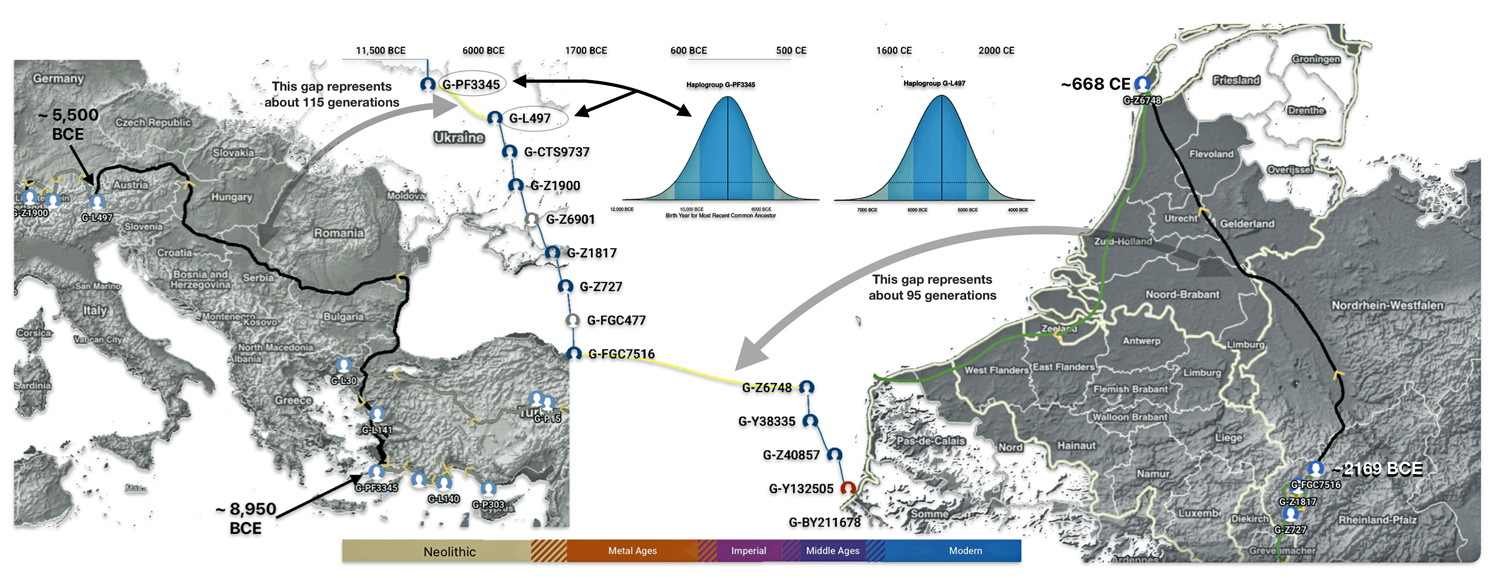
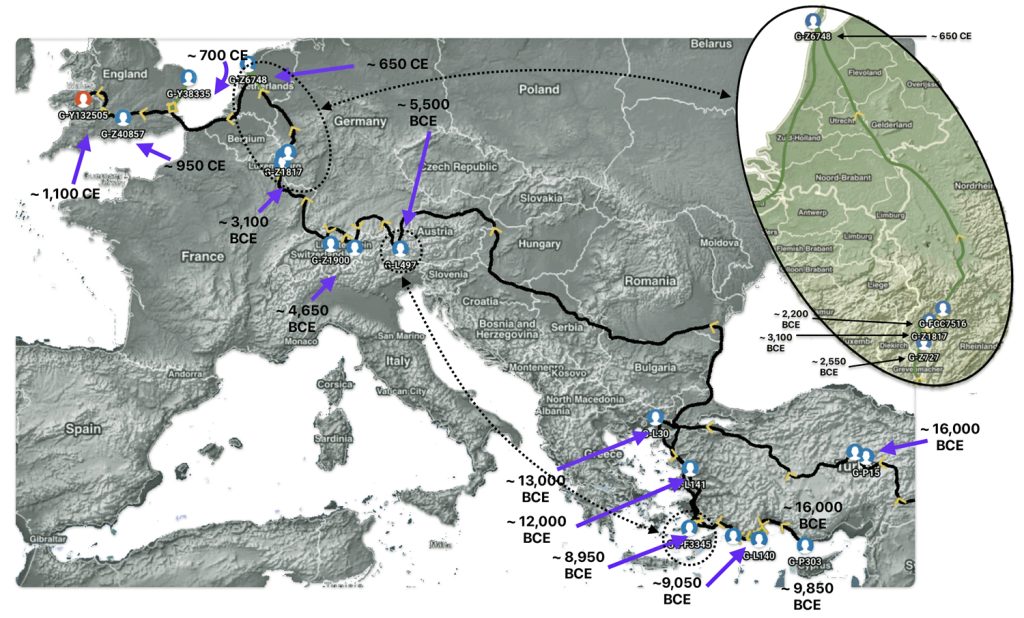
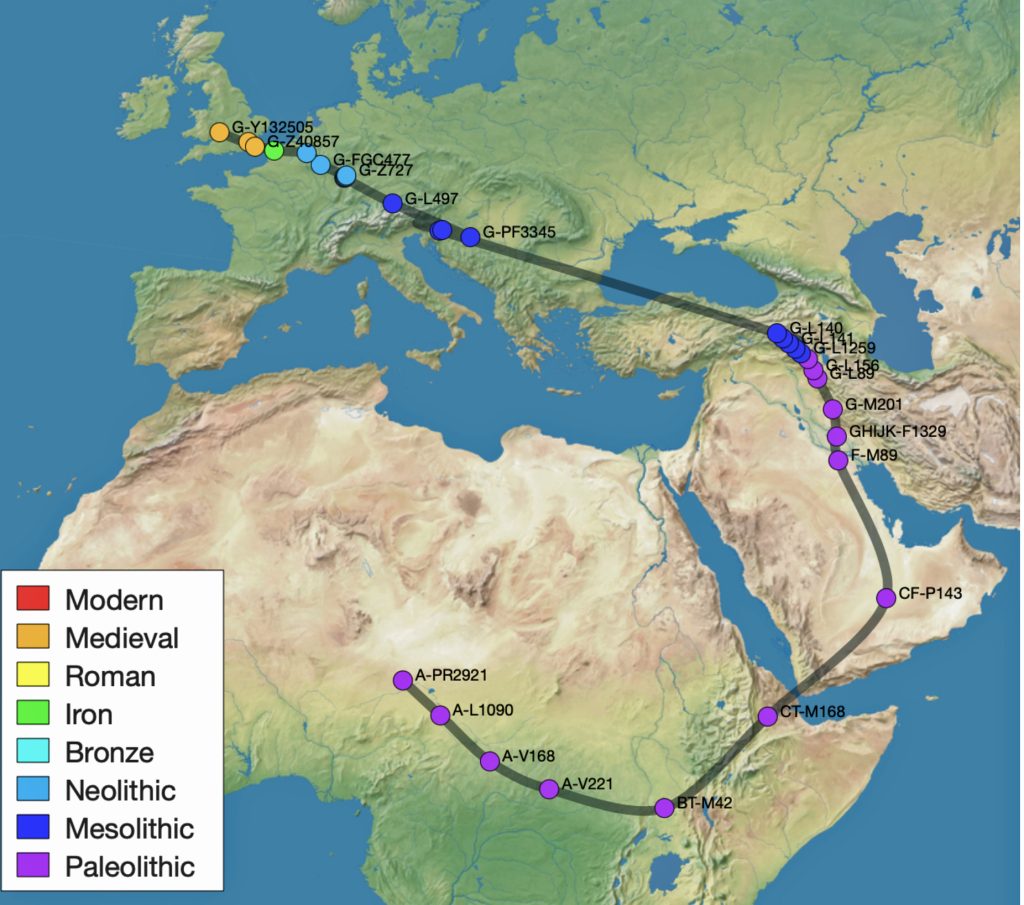
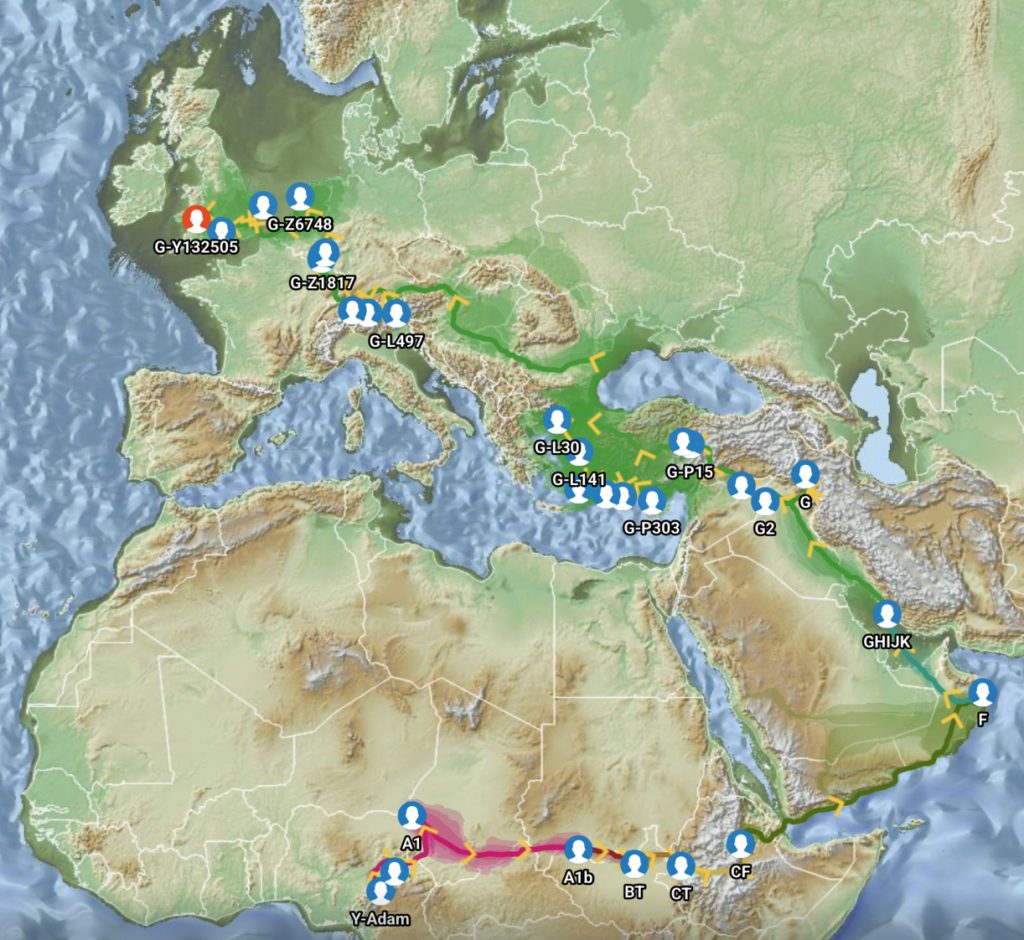
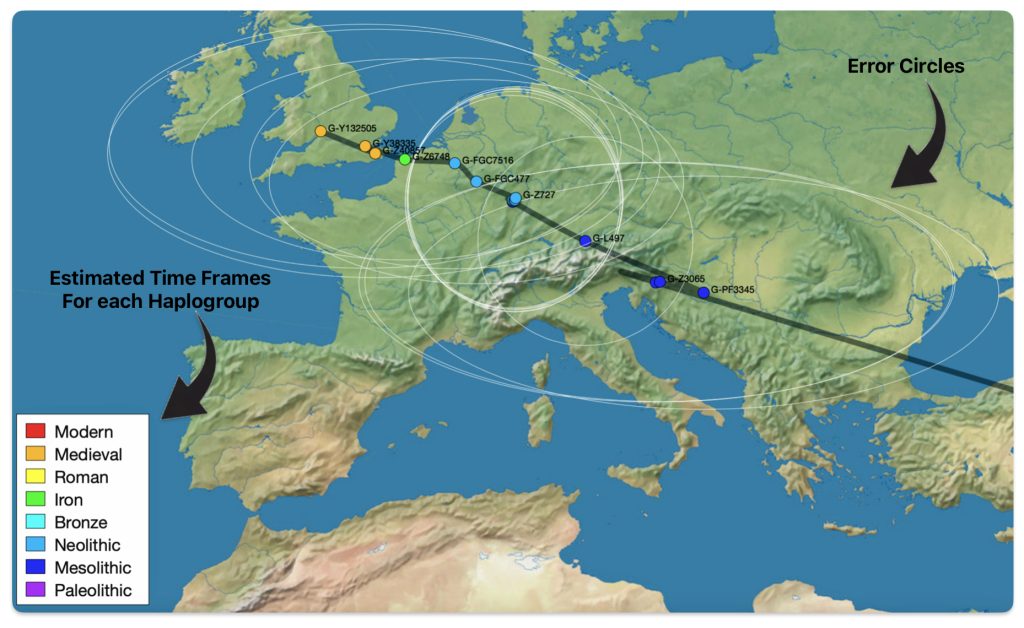
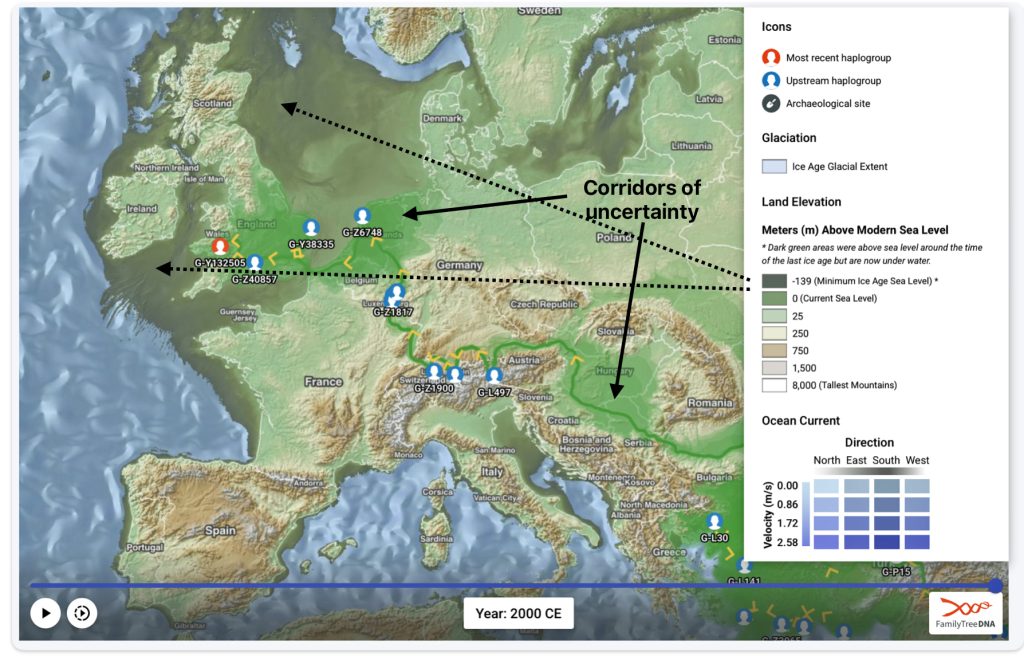
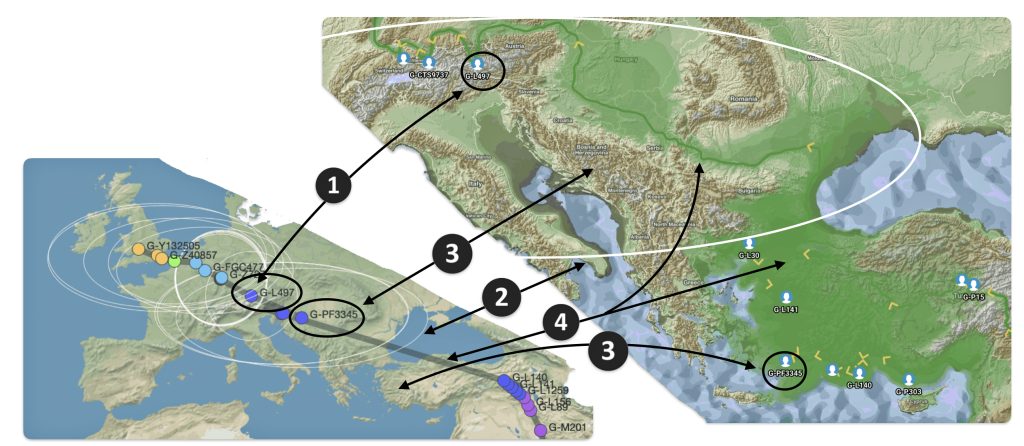
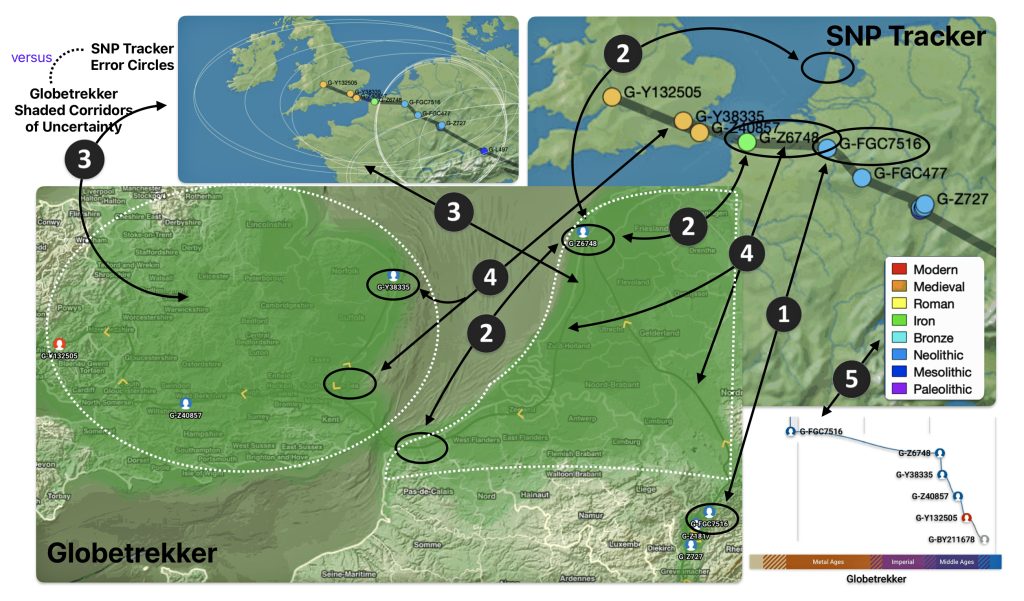
An illustrative example used in the model depicted above for the macro social structural level is a depiction of the general migratory path for my patrilineal genetic ancestors through the G-L497 haplogroup line. The ‘reconstructed’ migratory path was created using Globetrekker.

Globetrekker is an innovative DNA mapping tool launched by FamilyTreeDNA (FTDNA) in July 2023. The mapping tool visualizes paternal ancestry migration paths. This feature is only available to customers who have taken the Big Y-500 or Big Y-700 test. [49]

Reference Number 5 & 7 in the Model

An observation is noted in the illustrated model about the high percentage of population in Wales that exhibit STR values associated with the G-P303 haplogroup. “In Wales, a distinctive G2a3b1 type (DYS388=13 and DYS594=11) dominates there and pushes the G percentage of the population higher than in England.” In the model, it is used to illustrate a micro level genetic observation that is found in the short term and mid level genealogical time layers.

In Wales, a distinctive G2a3b1 type (DYS388=13 and DYS594=11) dominates and pushes the G percentage of the population higher than in England.

DYS stands for DNA Y-chromosome Segment. It is used to describe a segment of DNA on the Y chromosome that contains short tandem repeats (STRs). STRs are short DNA patterns that repeat in a specific sequence. All STRs are given a unique identification number. For example, DYS388: the D indicates that the segment is a DNA segment, the Y indicates that the segment is on the Y chromosome, the S indicates that it is a unique segment, and the number 388 is the identifier.

The values for the two abovementioned DYS’s are uniquelyassociated with the Haplogroup G-P303 (G2a2b2a, formerly G2a3b1). 

Reference Number 6 in the Model

This observation is associated with the intermediate structural level. It is a current theory proffered by a member of the FamilyTreeDNA working project group for the Z-6748 Haplogroup. The YDNA tests associated with this group have ancestors that appear to have come from Wales.

Click for Larger View | Source: Migratory Path for Haplogroup G-Y132505 generated through GlobTrekker, FamilyTreeDNA, based on data as of 21 Jan 2025

The current theory is the ancestor of this YDNA line came across the English Channel with the Normans around the Norman Invastion. While the ancestor was not Norman he was probably a French or Belgium.

Reference Number 8 in the Model

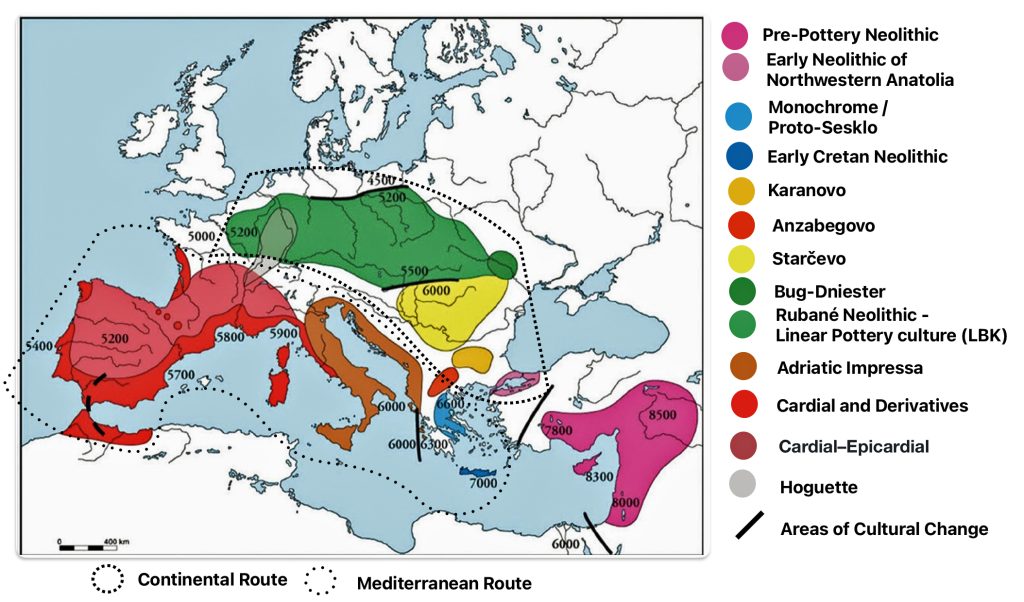
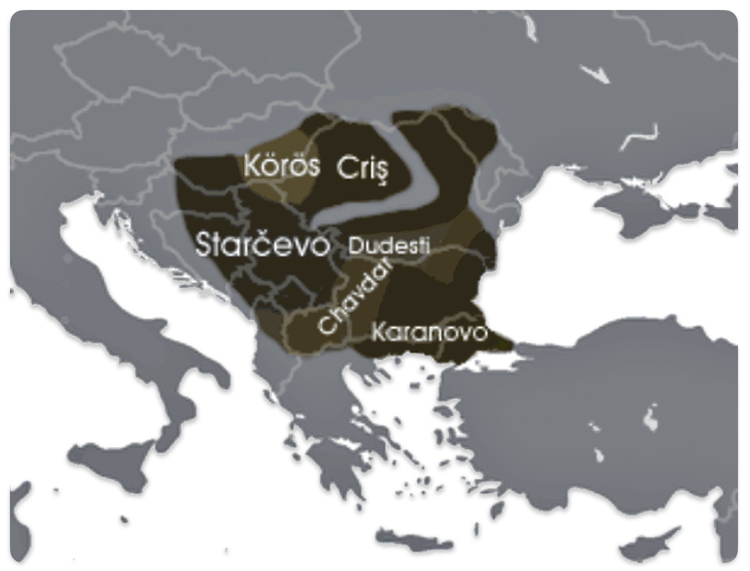
Examples of contextual evidence from macro cultural and paleo-genomic research are correlated with each of the four structural levels. This is an example of macro-cultural contextual evidence in illustration three provides a map of cultural groups around 1,000 – 1,200 BCE.

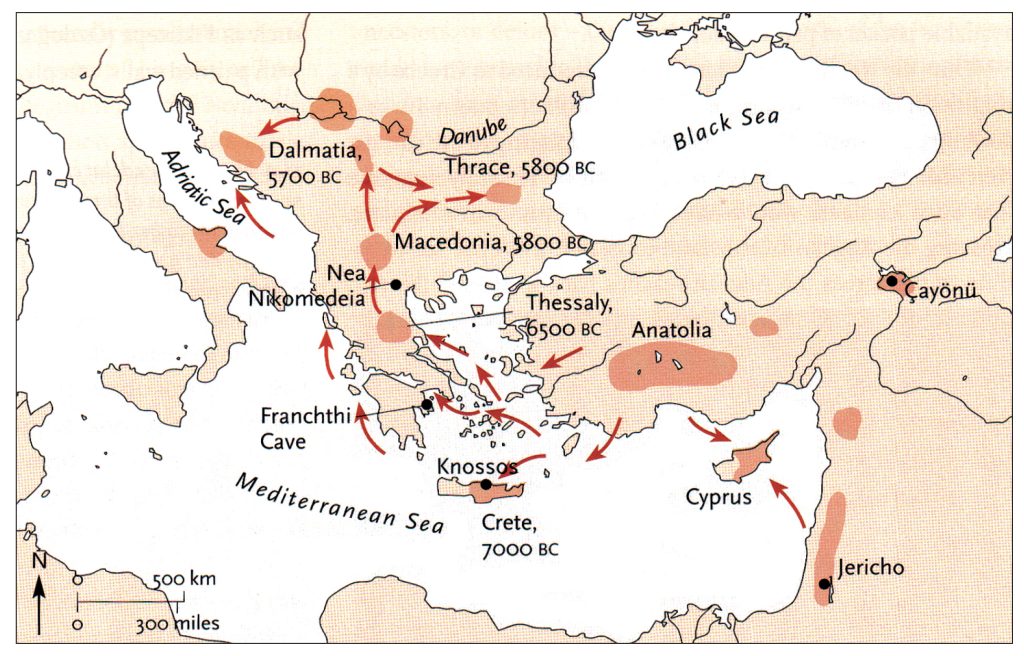
The information in the map is correlated with when the G-Z1817 haplogroup existed in Europe. The haplogroup follows an ancestral path that descended from earlier G lineages that were present in the region approximately 4,550 BCE. The haplogroup emerged from the G-CTS9737 haplogroup around 3,050 BCE during the transition between the Stone Age and Metal Ages.

Example of Cultural Groups in Europe Around 1000 1200 BCE

Click for Larger View | Source: Hay, Maciamo, Haplogroup G2a (Y-DNA), Jul 2023, Eupedia, https://www.eupedia.com/europe/Haplogroup_G2a_Y-DNA.shtml

The haplogroup appears to have a predominantly Germanic and Central European focus, with its distribution suggesting possible connections to early Germanic populations. The modern pattern indicates the haplogroup likely played a role in Central European population movements, though maintaining its strongest presence in German-speaking regions. [50]

Reference Number 9 in the Model

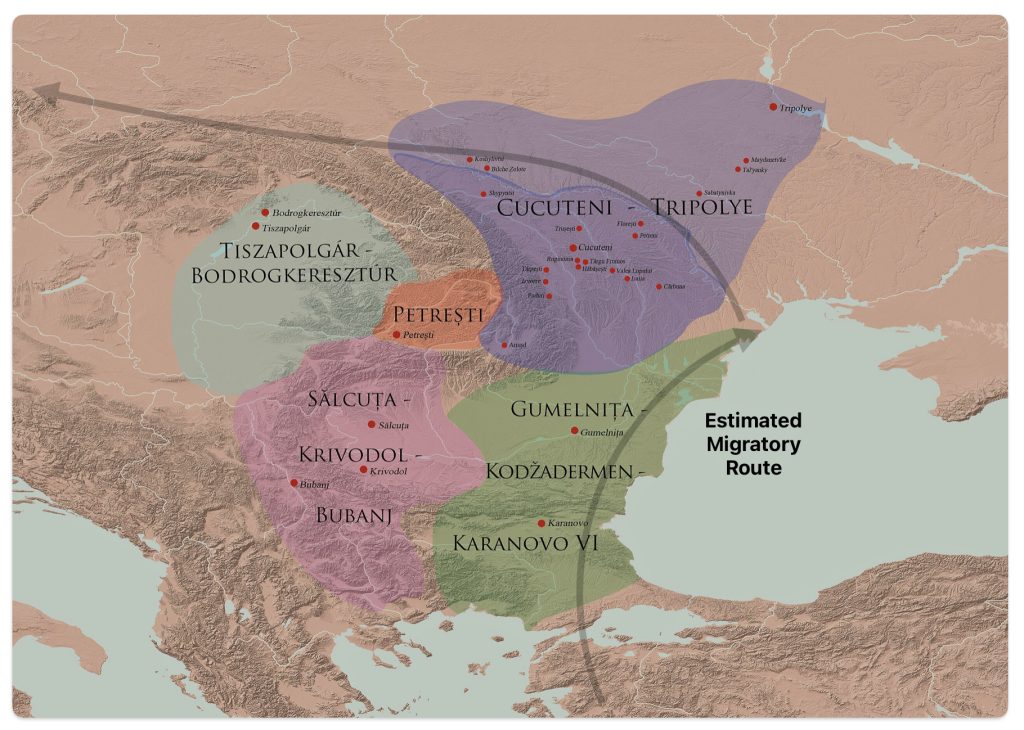
Ths is an illustrative example at the macro level provides a correlation of where ancient DNA (aDNA) remains have been found that were part of the G-P15 haplogroup. G-P15, also known as haplogroup G2a, is a Y-chromosome haplogroup that emerged approximately 15,000-16,000 years ago.

Example of G-P15 Ancient remains in Europe

Click for Larger View | Source: E.K. Khusnutdinova, N.V. Ekomasova, et al., Distribution of Haplogroup G-P15 of the Y-Chromosome Among Representatives of Ancient Cultures and Modern Populations of Norther Eurasia, Opera Med Physiol. 2023. Vol. 10 (4): 57 – 72, doi: 10.24412/2500-2295-2023-4-57-72

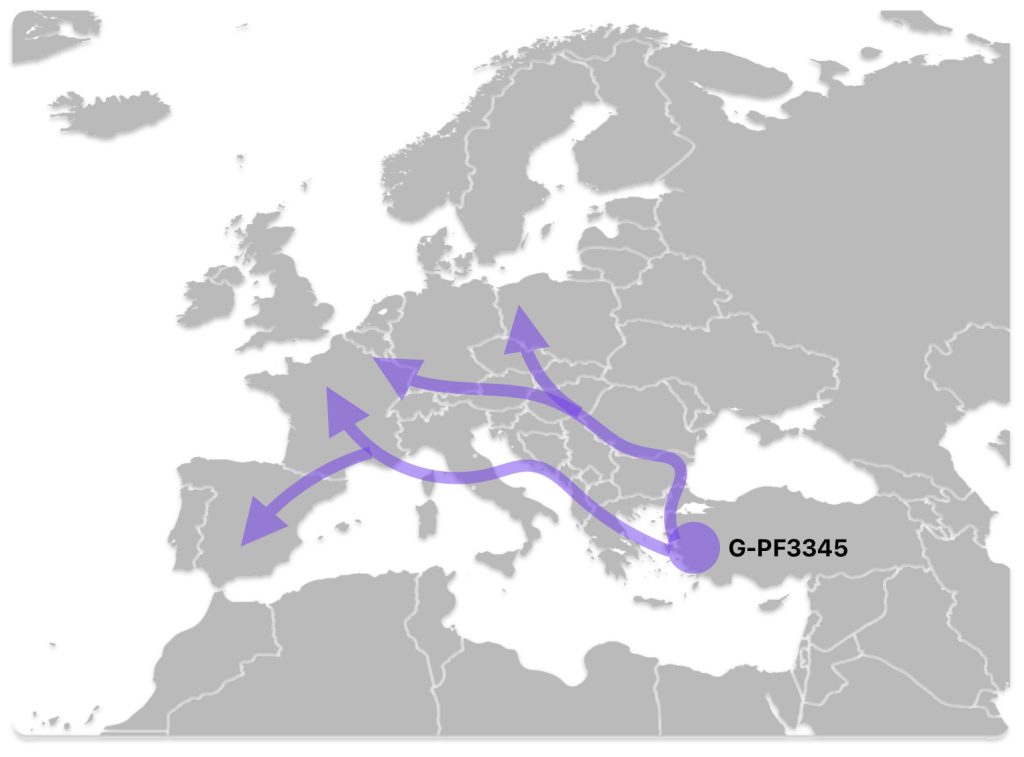
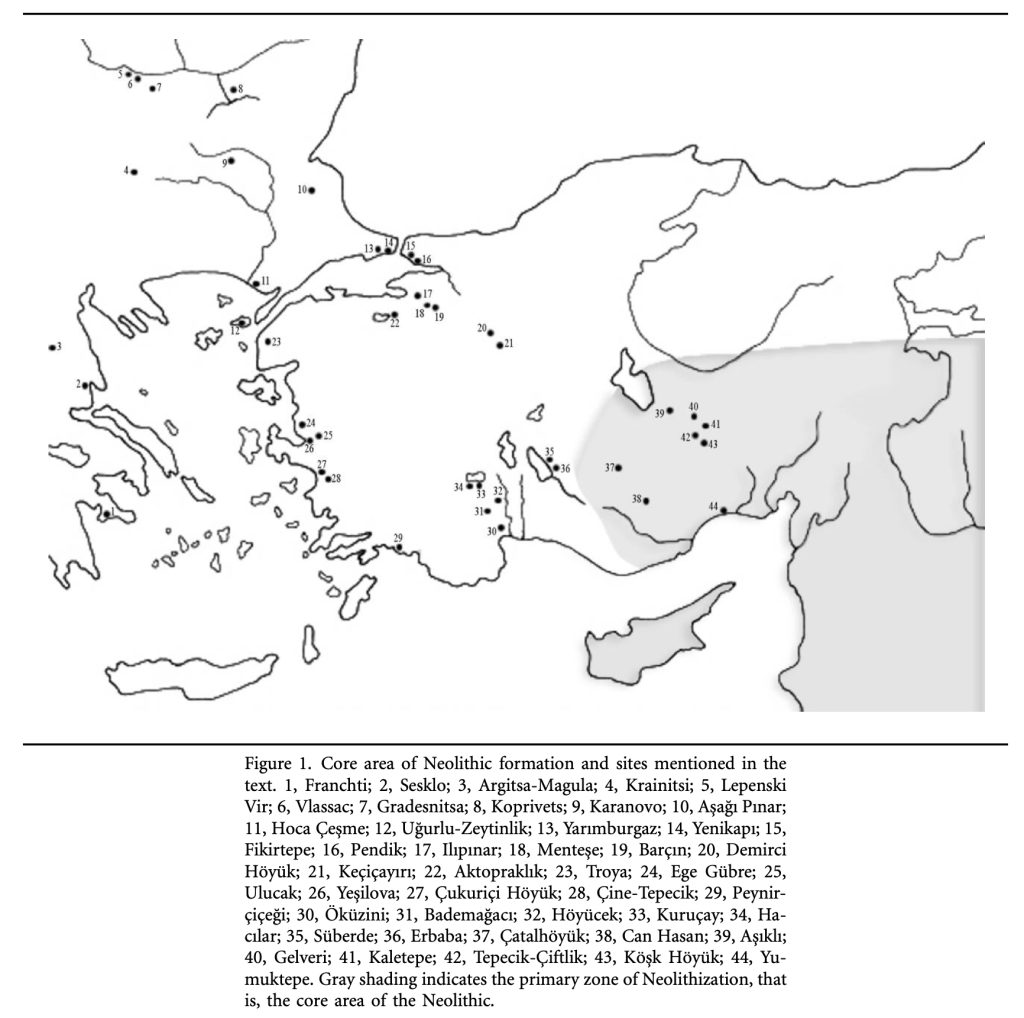
 This genetic lineage is defined by specific mutations on the Y-chromosome, particularly the P15 marker. The G-P15 haplogroup is an ancestral group of my more historically immediate haplogroups. Current research indicates that G-P15 represents one of the main Neolithic genetic links connecting early farmers who migrated across different European routes, including the northern route through the Balkans to Central Europe and the western maritime route to the Western Mediterranean. [51]

Weaving Genealogical Stories Across the Three Layers of Time

This story provdes a model to explain the connectiveness of three different genealogical time layers and associated contextual sources of evidence for developing genealogical stories. The combination of traditional genealogical research with genetic genealogical analysis offers several powerful benefits for extending research through three layers of genealogical time. While the terminology, the objects of research and reseach methods are differenet, there is coherence between the two approaches to tie family history across the time layers. Haplogroup testing can help overcome genealogical dead ends or birckwalls by offering clues about ancestral origins beyond documented records, providing direction for research when traditional records are unavailable, and connecting genetic matches who share common ancestors.

Haplogroups enhance location-based research. They point to specific geographic regions where ancestors lived. They can confirm family origins and migration patterns. They also provide insights about ancestral locations from thousands of years ago that are not documented in historical records.

The combination of research through the three genealogical time layers helps validate genealogical research. DNA testing can confirm or disprove suspected family connections. Haplogroups can verify heritage claims that are too distant for autosomal DNA testing or beyond the reach of traditional research. Y-DNA patterns can help confirm surname connections and lineages.

The combination research across the three time layers provides a deeper historical understanding by revealing ancient migration patterns of family lines. It connects family history to broader historical movements. It provides insights about ancestors’ lives thousands of years before written records.

Each time layer provides valuable clues and they should be used as a unique source of evidence in our genealogical research.

Source:

Feature Banner: The banner at the top of the story is a depiction of the two models associated with the three layers of genealogical time with the four social structural levels of historical context and other factors. .

[1] I have used 31 or 33 years as a rough estimate of a generation. This estimate has been ‘deduced’ after reading through the research and opinions about what is a generation in terms of years.

The conversion from generations to years typically uses a generation interval of approximately 30 years, rather than the previously assumed 20-25 years. This longer interval has been validated through extensive genealogical studies and population registers. For the mosst accurate calculations, it is recommended that an interval of 28-31.5 years be used.

Tremblay M, Vézina H. New estimates of intergenerational time intervals for the calculation of age and origins of mutations. Am J Hum Genet. 2000 Feb;66(2):651-8. doi: 10.1086/302770. PMID: 10677323; PMCID: PMC1288116, https://pmc.ncbi.nlm.nih.gov/articles/PMC1288116/

Also, see for example:

“But just how long is a generation? Don’t we all know as a matter of common knowledge that it generally averages about 25 years from the birth of a parent to the birth of a child. …

“I’ve shaded my earlier preferred number, 34, down a bit, to 33 or 32 but varying with the ethnicity, place, and period of the population.

(Based on a study of family documentation) For a total of 21 male-line generations among five lines, the average interval was close to 34 years per generation. For 19 female-line generations from four lines, the average was an exact 29 years per generation.”

John Barrett Rob, How Long is a Generation?, https://www.johnbrobb.com/Content/DNA/How_Long_Is_A_Human_Generation.pdf

“For the Y chromosome these rates assume a 31 year generation.”

J. Douglas McDonald, TMRCA Calculator, Oct 2014 version, Clan Donald, USA website, Https://clandonaldusa.org/index.php/tmrca-calculator

Richard J Wang, Samer I. Al-Saffar, Jeffery Rogers and Mathew W. Hah,  Human generation times across the past 250,000 years, Science Advances, 6 Jan 2023, Vol 9 Issue 1, https://www.science.org/doi/10.1126/sciadv.abm7047

“(T)he accepted 25-year average has worked quite acceptably, and birth dates too far out of line with it are properly suspect.”

“As a check on those values, which are based on extensive data and rigorous mathematical analysis, although rounded off for ease of use, I decided to compare the generational intervals from all-male or all-female ranges in my own family lines for the years 1700 to 2000, and was pleasantly surprised to see how closely they agree. For a total of 21 male-line generations among five lines, the average interval was 34 years per generation. For 19 female-line generations from four lines, the average was 29 years per generation.”

“However, to convert generations to years and probable date ranges, use a value for the generational interval that is soundly based on the best currently available evidence.”

Donn Devine, How Long is a generation? Science Provides an Answer, International Society of Genetic Genealogy (ISOG) Wiki, This page was last edited on 16 November 2016, https://isogg.org/wiki/How_long_is_a_generation%3F_Science_provides_an_answer. This article was originally published in Ancestry Magazine, Sep-Oct 2005, Volume 23, Number 4, pp51-53.

Marc Tremblay et al., “New Estimation of Intergenerational Time Intervals for the Calculation of Age and Origin of Mutations,” American Journal of Human Genetics 66 (Feb. 2000): 651-658.

Nancy Howell calculated average generational intervals among present-day members of the !Kung tribe. The !Kung are a contemporary hunter-gatherer group currently living in Botswana and Namibia. Their way of life mirrors the nomadic hunting and gathering lifestyle thqat is similar to pre-agricultural ancestors. The average age of mothers at birth of their first child was 20 and at the last birth 31, giving a mean of 25.5 years per female generation. Husbands were six to 13 years older, giving a male generational interval of 31 to 38 years. 

Nancy Howell, The Demography of the Dobe !Kung (1979; second edition New York: Walter de Gruyter, 2000).

Archaeologist Kenneth Weiss questioned the accepted 20 and 25-year generational intervals, finding from his analysis of prehistoric burial sites that 27 years was a more appropriate interval. 

Kenneth M. Weiss, “Demographic Models for Anthropology,” American Antiquity 38 No, 2 (April 1979): 1-39.

With an average depth of nine generations, but extending as far back as 12 or 13 generations, Trembley and Vézina’s sample included 10,538 generational intervals. They took as the interval the years between parents’ and children’s marriages, which averaged 31.7 years

Marc Tremblay, H. Vézina H,  New estimates of intergenerational time intervals for the calculation of age and origins of mutations. Am J Hum Genet. 2000 Feb;66(2):651-8. doi: 10.1086/302770. PMID: 10677323; PMCID: PMC1288116. https://pubmed.ncbi.nlm.nih.gov/10677323/

Ingman and associates used 20-year generations to place “mitochondrial Eve” 171,500 +/- 50,000 years before present, a probability range broad enough to cover underestimation.

Max Ingman et al., “Mitochondrial Genome Variation and the Origin of Modern Humans,” Nature 408 (2000): 708-713, 8,575,

Thomason and associates used 25-year generations (although noting Weiss’s 27-year estimate) to place the most recent common male-line ancestor of all living men about 50,000 years before the present. 

Russell. Thomson et al., “Recent Common Ancestry of Human Y Chromosomes,” Proceedings of the National Academy of Science USA 97 (20 June 2000): 7360-7365

Fenner, Jack N., Cross-cultural estimation of the human generation interval for use in genetics-based population divergence studies (American Journal of Physical Anthropology 128(1Jan2005):415-423)

Generation, Wikipedia, This page was last edited on 15 January 2024, https://en.wikipedia.org/wiki/Generation

Richard J. Wang et al. ,Human generation times across the past 250,000 years. Science Advances Vol 9 No 1, 2023. DOI:10.1126/sciadv.abm7047

The concept of a ‘generation takes on different meaning from a purely historical or sociological view.


Kertzer, David I. “Generation as a Sociological Problem.” Annual Review of Sociology, vol. 9, 1983, pp. 125–49. JSTOR, http://www.jstor.org/stable/2946060 

“The scope of future generational studies may be somewhat restricted by limited the concept of generation to relations of kinship descent. But such restrictions do to entail any limitation of substantive or theoretical inquiry; rather, they email a more precise use of concepts.”  Page 143 

“What is crucial … is that generational processes be firmly placed in specific historical contexts – ie, that they reanalyzed in conjunction with the concepts of cohort, age, and historical period.” P  143

“Examining generation in conjunction with age opens up a research agenda that may be obscured where age, cohort, and generation are used interchangeably. The issues likely to be of greatest interest depend on the theoretical orientation of the researcher. From a sociobiological viewpoint, generational relations are central to society, for they underlie the transmission of genes … . . “ Page 144

“I advocate a role of the concept of generation more restricted than that championed by many other social scientists, but a role nonetheless important.” Page 144


Jansen, Nerina. “Definition of Generation and Sociological Theory.” Social Science, vol. 49, no. 2, 1974, pp. 90–98. JSTOR, http://www.jstor.org/stable/41959796 

There are two methodological prerequisites for the identification of the generation in the social structure: (a) a particular time dimensions and(b) a particular historical context.”  Page 93


Spitzer, Alan B. “The Historical Problem of Generations.” The American Historical Review, vol. 78, no. 5, 1973, pp. 1353–85. JSTOR, https://doi.org/10.2307/1854096 


See also:

Carlsson, Gosta, and Katarina Karlsson. “Age, Cohorts and the Generation of Generations.” American Sociological Review, vol. 35, no. 4, 1970, pp. 710–18. JSTOR, https://doi.org/10.2307/2093946  

Julián Marías, Generations: A Historical Method, Alabama: Alabama University Press, 1970

For a psychological perspective, see: Bettelheim, Bruno. “The Problem of Generations.” Daedalus, vol. 91, no. 1, 1962, pp. 68–96. JSTOR, http://www.jstor.org/stable/20026698  

[2] The following are definitions of the terms used in this sentence.

A terminal SNP (Single Nucleotide Polymorphism) is the defining SNP of the most recent known subclade on a person’s Y-DNA haplogroup tree based on their current testing level1. It represents the furthest tested branch position on the Y-chromosome tree of human ancestry. Terminal SNPs are considered “once in the lifetime of mankind” mutations that are stable and unique genetic markers. They help define different haplogroups and subclades on the paternal line. The terminal SNP designation can change over time as different testing companies may identify different terminal SNPs based on their testing coverage. More extensive testing may reveal additional downstream SNPs. New SNPs are discovered through advanced testing like the FamilyTreeDNA Big Y700.

Terminal SNPs are valuable for determining the precise placement of DNA test results on the human paternal and maternal family tree. They are also useful for identifying genetic relationships between different family lines. Two individuals cannot be closely related within the past 1,000 years if they belong to different haplogroups, even if their other genetic markers appear similar. [a]

The Most Recent Common Ancestor (MRCA), also known is the most recent individual from whom all members of a specified group are directly descended. The MRCA represents the point where specific genealogical lines of a group converge to a single ancestor. While it is often impossible to identify the exact MRCA of a large group, scientists can estimate when this ancestor lived using DNA tests and established mutation rates. [b]

A subclade is a subgroup within a larger genetic haplogroup that represents a more specific and detailed classification of genetic lineages. A subclade is defined by specific genetic markers, particularly Single Nucleotide Polymorphisms (SNPs), that distinguish it from other branches within the same haplogroup. Subclades form nested hierarchies within haplogroups, with each subclade representing a more recent branch of the genetic family tree.

The classification of subclades can change as new SNPs are discovered. More extensive testing may reveal additional downstream markers. Different testing companies identify new genetic markers. [c]

A haplotype is a group of alleles inherited together from a single parent. These genetic variations are located on the same chromosome and pass down as a unit through generations. [d]

A modal haplotype is the most commonly occurring set of genetic markers (STR values) found within a specific group of people. It represents the predominant pattern in a population but may not necessarily be the ancestral pattern. [e]

FeatureHaplotypeModal Haplotype
OriginIndividual inheritancePopulation statistics
RepresentationActual genetic sequenceMost frequent pattern
ScopeIndividual levelGroup or population level

The modal haplotype functions as a theoretical construct composed of the most frequent value for each marker among members of the same lineage. This creates a reference point that is useful for groups sharing common ancestry within the past several hundred years.

Modal haplotypes are useful in surname DNA projects by helping researchers analyze genetic relationships within family groups. Modal haplotypes help project administrators that manage Y-DNA results for DNA companies to determine genetic families within surname projects by providing a reference point for comparison. When comparing participants’ DNA results, the modal haplotype serves as a baseline to identify related individuals.

The modal haplotype represents the most commonly occurring genetic marker values within a specific group, though it may not exactly match the ancestral haplotype due to sampling bias, genetic drift, or founder effects.

Project administrators use modal haplotypes to compare marginal members against the core genetic family; resolve conflicting matches between participants; adnd group test results without initially relying on paper trail genealogy. When working with modal haplotypes in surname projects, administrators can help identify genetic families within the same surname group. They also can be used to evaluate potential new members and compare participants with different testing resolutions.

[a] Estes, Roberta, Glossary – Terminal SNP, 29 Nov 2017, DNAeXplained – Genetic Genealogy, https://dna-explained.com/2017/11/29/glossary-terminal-snp/

Most Recent Common Ancestor, Wikipedia, This page was last edited on 6 January 2025, https://en.wikipedia.org/wiki/Most_recent_common_ancestor

Most Recent Common Ancestor, International Society of Genetic Genealogy Wiki, This page was last edited on 31 January 2017, https://isogg.org/wiki/Most_recent_common_ancestor

[c] Subclades, Wikipedia, This page was last edited on 24 May 2024, https://en.wikipedia.org/wiki/Subclade

[d] Haplotype, Wikipedia, This page was last edited on 19 September 2024, https://en.wikipedia.org/wiki/Haplotype

Haplotype / Haplotypes, Scitable, https://www.nature.com/scitable/definition/haplotype-haplotypes-142/

[e] Modal Haplotype, Wikipedia, This page was last edited on 10 May 2024, https://en.wikipedia.org/wiki/Modal_haplotype

Matching and grouping in surname DNA projects, International Society of Genetic Genealogy Wiki, This page was last edited on 28 January 2021, https://isogg.org/wiki/Matching_and_grouping_in_surname_DNA_projects 

[3] Estes, Roberta, Glossary – Terminal SNP, 29 Nov 2017, DNAeXplained – Genetic Genealogy, https://dna-explained.com/2017/11/29/glossary-terminal-snp/

[4] Polymorphism (biology), Wikipedia, This page was last edited on 14 December 2024, https://en.wikipedia.org/wiki/Polymorphism_(biology)

Fan H, Chu JY. A brief review of short tandem repeat mutation. Genomics Proteomics Bioinformatics. 2007 Feb; 5(1):7-14. doi: 10.1016/S1672-0229(07)60009-6. PMID: 17572359; PMCID: PMC5054066. https://pmc.ncbi.nlm.nih.gov/articles/PMC5054066/

Estes, Roberta, STRs vs SNPs, Multiple DNA Personalities, 10Feb 2014, DNAeXplained – Genetic Genealogy, https://dna-explained.com/2014/02/10/strs-vs-snps-multiple-dna-personalities/

Single-nucleotide polymorphism, Wikipedia, This page was last edited on 6 January 2025, https://en.wikipedia.org/wiki/Single-nucleotide_polymorphism

[5] John M. Butler, Michael D. Coble, Peter M. Vallone, STRs vs. SNPs: thoughts on the future of forensic DNA testing, Forensic Sci Med Pathol (2007) 3:200–205. DOI 10.1007/s12024-007-0018-1, https://strbase-archive.nist.gov/pub_pres/FSMP_STRs_vs_SNPs.pdf

Norrgard , Karen & Schultz, JoAnna, Using SNP data to examine human phenotypic differences. Nature Education 1(1):85, 2008, https://www.nature.com/scitable/topicpage/using-snp-data-to-examine-human-phenotypic-706/

Fan H, Chu JY. A brief review of short tandem repeat mutation. Genomics Proteomics Bioinformatics. 2007 Feb;5(1):7-14. doi: 10.1016/S1672-0229(07)60009-6. PMID: 17572359; PMCID: PMC5054066, https://pmc.ncbi.nlm.nih.gov/articles/PMC5054066/

Estes, Roberta, STRs vs SNPs, Multiple DNA Personalities, 10 Feb 2014, DNAeXplained, https://dna-explained.com/2014/02/10/strs-vs-snps-multiple-dna-personalities/

Phillips C, García-Magariños M, Salas A, Carracedo A, Lareu MV. SNPs as Supplements in Simple Kinship Analysis or as Core Markers in Distant Pairwise Relationship Tests: When Do SNPs Add Value or Replace Well-Established and Powerful STR Tests? Transfus Med Hemother. 2012 Jun;39(3):202-210. doi: 10.1159/000338857. Epub 2012 May 12. PMID: 22851936; PMCID: PMC3375139, https://pmc.ncbi.nlm.nih.gov/articles/PMC3375139/

[6] The number 10 in mutation rates represents scientific notation, which is used to express very small probabilities of mutations occurring. A mutation rate (per base per generation) of ~10^-8 means 0.00000001. In humans, a mutation rate of 10^-8 means one mutation occurs per hundred million base pairs per generation. With 3 billion base pairs in the human genome, this results in approximately 30-100 new mutations per generation. [a]

A mutation rate of 10^-8 represents the probability of a mutation occurring at a specific nucleotide site per generation in humans. [b][c]To put this in practical terms this mutation rate means approximately 2.5 × 10^-8 mutations occur per nucleotide site per generation.[d] With a human genome of about 3 billion base pairs, this results in roughly 60-100 new mutations in each person’s genome per generation. This mutation rate means that in a human population every possible single base-pair mutation exists somewhere in the current human population. For any specific site in the genome, dozens of humans may carry a mutation at that location. [c] Two-base-pair specific mutations would require approximately 10^7 generations to occur by chance. 

[a] Sanjuán R, Nebot MR, Chirico N, Mansky LM, Belshaw R. Viral mutation rates. J Virol. 2010 Oct;84(19):9733-48. doi: 10.1128/JVI.00694-10. Epub 2010 Jul 21. PMID: 20660197; PMCID: PMC2937809.

What is the Mutation Rate During Genome replication, Cell Biology by the Numbers, https://book.bionumbers.org/what-is-the-mutation-rate-during-genome-replication/

[b] Adam Eyre-Walker, Ying Chen Eyre-Walker, How Much of the Variation in the Mutation Rate Along the Human Genome Can Be Explained?, G3 Genes|Genomes|Genetics, Volume 4, Issue 9, 1 September 2014, Pages 1667–1670, https://doi.org/10.1534/g3.114.012849

[c] What is the Mutation Rate During Genome replication, Cell Biology by the Numbers, https://book.bionumbers.org/what-is-the-mutation-rate-during-genome-replication/

[d] Nachman MW, Crowell SL. Estimate of the mutation rate per nucleotide in humans. Genetics. 2000 Sep;156(1):297-304. doi: 10.1093/genetics/156.1.297. PMID: 10978293; PMCID: PMC1461236. https://pmc.ncbi.nlm.nih.gov/articles/PMC1461236/

Mutation rate, Wikipedia, This page was last edited on 7 November 2024, https://en.wikipedia.org/wiki/Mutation_rate

[7] Estes, Roberta, STRs vs SNPs, Multiple DNA Personalities, 10 Feb 2014, DNAeXplained – Genetic Genealogy, https://dna-explained.com/2014/02/10/strs-vs-snps-multiple-dna-personalities/

[8] Estes, Roberta, Y DNA: Step-by-Step Big Y Analysis, 30 May 2020, DNAeXplained – Genetic Genealogy, https://dna-explained.com/2020/05/30/y-dna-step-by-step-big-y-analysis/

[9] John M. Butler, Michael D. Coble, Peter M. Vallone, STRs vs. SNPs: thoughts on the future of forensic DNA testing, Forensic Sci Med Pathol (2007) 3:200–205. DOI 10.1007/s12024-007-0018-1, https://strbase-archive.nist.gov/pub_pres/FSMP_STRs_vs_SNPs.pdf

[10] Estes, Roberta, STRs vs SNPs, Multiple DNA Personalities, 10 Feb 2014, DNAeXplained – Genetic Genealogy, https://dna-explained.com/2014/02/10/strs-vs-snps-multiple-dna-personalities/

[11] Norrgard , K. & Schultz, J. (2008) Using SNP data to examine human phenotypic differences. Nature Education1(1):85 https://www.nature.com/scitable/topicpage/using-snp-data-to-examine-human-phenotypic-706/

[12] John M. Butler, Michael D. Coble, Peter M. Vallone, STRs vs. SNPs: thoughts on the future of forensic DNA testing, Forensic Sci Med Pathol (2007) 3:200–205. DOI 10.1007/s12024-007-0018-1, https://strbase-archive.nist.gov/pub_pres/FSMP_STRs_vs_SNPs.pdf

[13] Fan H, Chu JY. A brief review of short tandem repeat mutation. Genomics Proteomics Bioinformatics. 2007 Feb;5(1):7-14. doi: 10.1016/S1672-0229(07)60009-6. PMID: 17572359; PMCID: PMC5054066, https://pmc.ncbi.nlm.nih.gov/articles/PMC5054066/

[14] Rob Spencer, STR Clades, Tracking Back: a website for genetic genealogy tools, experimentation, and discussion, http://scaledinnovation.com/gg/gg.html?rr=strclades

[15] Rob Spencer, Why use STR data and not SNP data?, Tracking Back: a website for genetic genealogy tools, experimentation, and discussion, http://scaledinnovation.com/gg/gg.html?rr=whystr

[16] Katy Rowe-Schurwanz, Learn about the significance of mtDNA haplogroups and how your mtDNA test results can help you trace your maternal ancestry back to Mitochondrial Eve, 19 Jul 2024, FamilyTreeDNA Blog, https://blog.familytreedna.com/interpreting-mtdna-test-results/

[17] Haplogroup, Wikipedia, This page was last edited on 12 January 2025, https://en.wikipedia.org/wiki/Haplogroup

[18] Rowe-Schuranz, Katy, Interpreting Y-DNATest Results: Y-DNA Haplogroups, 2 Jul 2024, FamilyTreeDNA Blog, https://blog.familytreedna.com/interpreting-y-dna-test-results-haplogroups/

Rowe-Schuranz, Katy, Big Y Lifetime Analysis: The Myth of the Manual Review, 22 Nov 2023, FamilyTreeDNA Blog, https://blog.familytreedna.com/big-y-manual-review-lifetime-analysis/

Y-DNA project help, International Society of Genetic Genealogy Wiki, This page was last edited on 28 October 2022,, https://isogg.org/wiki/Y-DNA_project_help

[19] Rowe-Schuranz, Katy, Interpreting Y-DNATest Results: Y-DNA Haplogroups, 2 Jul 2024, FamilyTreeDNA Blog, https://blog.familytreedna.com/interpreting-y-dna-test-results-haplogroups/

[20] Hallast P, Batini C, Zadik D, Maisano Delser P, Wetton JH, Arroyo-Pardo E, Cavalleri GL, de Knijff P, Destro Bisol G, Dupuy BM, Eriksen HA, Jorde LB, King TE, Larmuseau MH, López de Munain A, López-Parra AM, Loutradis A, Milasin J, Novelletto A, Pamjav H, Sajantila A, Schempp W, Sears M, Tolun A, Tyler-Smith C, Van Geystelen A, Watkins S, Winney B, Jobling MA. The Y-chromosome tree bursts into leaf: 13,000 high-confidence SNPs covering the majority of known clades. Mol Biol Evol. 2015 Mar;32(3):661-73. doi: 10.1093/molbev/msu327. Epub 2014 Dec 2. PMID: 25468874; PMCID: PMC4327154, https://pmc.ncbi.nlm.nih.gov/articles/PMC4327154/

[21] Several key methods exist for calculating Time to Most Recent Common Ancestor (TMRCA), each with distinct advantages and limitations. Recent developments have led to tree-based methods using Y-SNPs, which offer improved phylogenetic tree construction, better handling of sub-clade relationships and more accurate mutation counting between nodes.

McDonald I. Improved Models of Coalescence Ages of Y-DNA Haplogroups. Genes (Basel). 2021 Jun 4;12(6):862. doi: 10.3390/genes12060862. PMID: 34200049; PMCID: PMC8228294 https://pmc.ncbi.nlm.nih.gov/articles/PMC8228294/

Hallast P, et al, The Y-chromosome tree bursts into leaf: 13,000 high-confidence SNPs covering the majority of known clades. Mol Biol Evol. 2015 Mar;32(3):661-73. doi: 10.1093/molbev/msu327. Epub 2014 Dec 2. PMID: 25468874; PMCID: PMC4327154, https://pmc.ncbi.nlm.nih.gov/articles/PMC4327154/

Boattini, A., Sarno, S., Mazzarisi, A.M. et al. Estimating Y-Str Mutation Rates and Tmrca Through Deep-Rooting Italian Pedigrees. Sci Rep 9, 9032 (2019). https://doi.org/10.1038/s41598-019-45398-3

Basu A. and Majumder P. P. 2003 A comparison of two popular statistical methods for estimating the time to most recent common
ancestor (TMRCA) from a sample of DNA sequences. J. Genet., 82, 7–12, https://www.ias.ac.in/article/fulltext/jgen/082/01-02/0007-0012

Zhou J, Teo YY. Estimating time to the most recent common ancestor (TMRCA): comparison and application of eight methods. Eur J Hum Genet. 2016 Aug;24(8):1195-201. doi: 10.1038/ejhg.2015.258. Epub 2015 Dec 16. PMID: 26669663; PMCID: PMC4970674, https://pmc.ncbi.nlm.nih.gov/articles/PMC4970674/

Estes, Roberta, Haplogroups: DNA SNPs are Breadcrumbs – Follow Their Path, 10 Aug 2023, DNAeXplained – Genetic Genealogy, https://dna-explained.com/2023/08/10/haplogroups-dna-snps-are-breadcrumbs-follow-their-path/

[22] Most recent recent common ancestor, Wikipedia, This page was last edited on 20 January 2025, https://en.wikipedia.org/wiki/Most_recent_common_ancestor

[23] Spencer, Rob, Data Source and SNP Dates, Discussion, SNP Tracker, http://scaledinnovation.com/gg/snpTracker.html

Rob Spncer alludes to YFull’s operational definition of tMRCA’s inception date. YFull is a specialized DNA analysis service that focuses on interpreting Y-chromosome and mitochondrial DNA sequences. YFull analyzes raw data files (BAM and CRAM) obtained from next-generation sequencing (NGS) to study origins in both direct paternal line (Y DNA) and direct maternal line (Mitochondrial DNA).

What is YFull, Tutorial, YFull, https://www.yfull.com/tutorial/

What is YFull’s age estimation methodology?, FAQ, YFull, https://www.yfull.com/faq/what-yfulls-age-estimation-methodology/

Estes, Roberta, Data Mining and Screen Scraping – Right or Wrong?, 6 Apr 2014, DNAeXplained – Genetic Genealogy, https://dna-explained.com/category/yfull-company/

Jonas, Linda, Advantages of submitting to YFull, 14 Oct 2019, The Ultimate Family Historians, http://ultimatefamilyhistorians.blogspot.com/2019/10/advantages-of-submitting-to-yfull.html

[24] Generation, Wikipedia, This page was last edited on 18 January 2025, https://en.wikipedia.org/wiki/Generation

[25] Lohmueller KE, Bustamante CD, Clark AG. Methods for human demographic inference using haplotype patterns from genomewide single-nucleotide polymorphism data. Genetics. 2009 May;182(1):217-31. doi: 10.1534/genetics.108.099275. Epub 2009 Mar 2. PMID: 19255370; PMCID: PMC2674818, https://pmc.ncbi.nlm.nih.gov/articles/PMC2674818/

[26] Yunusbaev, U., Valeev, A., Yunusbaeva, M. et al. Reconstructing recent population history while mapping rare variants using haplotypes. Sci Rep 9, 5849 (2019). https://doi.org/10.1038/s41598-019-42385-6

[27] Halpogroup, International Society of Genetic Genealogy Wiki, This page was last edited on 1 November 2024, https://isogg.org/wiki/Haplogroup

[28] Choudhury A, Hazelhurst S, Meintjes A, Achinike-Oduaran O, Aron S, Gamieldien J, Jalali Sefid Dashti M, Mulder N, Tiffin N, Ramsay M. Population-specific common SNPs reflect demographic histories and highlight regions of genomic plasticity with functional relevance. BMC Genomics. 2014 Jun 6;15(1):437. doi: 10.1186/1471-2164-15-437. PMID: 24906912; PMCID: PMC4092225, https://pmc.ncbi.nlm.nih.gov/articles/PMC4092225/

Yunusbaev, U., Valeev, A., Yunusbaeva, M. et al. Reconstructing recent population history while mapping rare variants using haplotypes. Sci Rep 9, 5849 (2019). https://doi.org/10.1038/s41598-019-42385-6

Zurel, H., Bhérer, C., Batten, R. et al. Characterization of Y chromosome diversity in newfoundland and labrador: evidence for a structured founding population. Eur J Hum Genet 33, 98–107 (2025). https://doi.org/10.1038/s41431-024-01719-3

[29] Generation, Wikipedia, This page was last edited on 18 January 2025, https://en.wikipedia.org/wiki/Generation

[30] McDonald I. Improved Models of Coalescence Ages of Y-DNA Haplogroups. Genes (Basel). 2021 Jun 4;12(6):862. doi: 10.3390/genes12060862. PMID: 34200049; PMCID: PMC8228294, https://pmc.ncbi.nlm.nih.gov/articles/PMC8228294/

[31] McDonald I. Improved Models of Coalescence Ages of Y-DNA Haplogroups. Genes (Basel). 2021 Jun 4;12(6):862. doi: 10.3390/genes12060862. PMID: 34200049; PMCID: PMC8228294, https://pmc.ncbi.nlm.nih.gov/articles/PMC8228294/

Irvine, James, Y-DNA SNP-Based TMRCA Calculations for Surname Project Administrators, Journal f Genetic Genealogy, Volume 9, Number 1 (Fall 2021), Reference Number: 91.007, https://jogg.info/wp-content/uploads/2021/12/91.007-Article.pdf

Mullen, Pierre, 16 Feb 2023, Introducing the New FTDNATiP™ Report for Y-STRs, FamilyTreeDNA Blog, https://blog.familytreedna.com/ftdnatip-report/

[32] McDonald I. Improved Models of Coalescence Ages of Y-DNA Haplogroups. Genes (Basel). 2021 Jun 4;12(6):862. doi: 10.3390/genes12060862. PMID: 34200049; PMCID: PMC8228294, https://pmc.ncbi.nlm.nih.gov/articles/PMC8228294/

[33] Human Y-chromosome DNA haplogroup, Wikipedia, This page was last edited on 31 December 2024, , https://en.wikipedia.org/wiki/Human_Y-chromosome_DNA_haplogroup

Cloud, Janine, Y-DNA Haplotree Growth and Genetic Discoveries in 2024, 16 Jan 2025, FamilyTreeDNA Blog, https://blog.familytreedna.com/y-dna-haplotree-growth-2024/

Haplogroup, Wikipedia, This page was last edited on 12 January 2025, https://en.wikipedia.org/wiki/Haplogroup

[34] Y Chromosome Consortium. A nomenclature system for the tree of human Y-chromosomal binary haplogroups. Genome Res. 2002 Feb;12(2):339-48. doi: 10.1101/gr.217602. PMID: 11827954; PMCID: PMC155271, https://pmc.ncbi.nlm.nih.gov/articles/PMC155271/

[35] Estes, Roberta, Y DNA Tree of Mankind Reaches 50,000 Branches, 7 Dec 2021, DNAeXplained – Genetic Genealogy, https://dna-explained.com/2021/12/07/y-dna-tree-of-mankind-reaches-50000-branches/

[36] Williams, Edison,A Brief History of the yDNA Haplotree, 18 Feb 2024,  Wikitree G2G, https://www.wikitree.com/g2g/1706781/a-brief-history-of-the-ydna-haplotree

[37] Cloud, Janine, Y-DNA Haplotree Growth and Genetic Discoveries in 2024, 16 Jan 2025, FamilyTreeDNA Blog, https://blog.familytreedna.com/y-dna-haplotree-growth-2024/

[38] van Oven M, Kayser M. 2009. Updated comprehensive phylogenetic tree of global human mitochondrial DNA variation. Hum Mutat 30(2):E386-E394. http://www.phylotree.org. doi:10.1002/humu.20921

[39] Estes, Roberta, What is a Haplogroup, 24Jan 2013, DNAeXplained – Genetic Genealogy, https://dna-explained.com/2013/01/24/what-is-a-haplogroup/

[40] Private variants are newer mutations that have not yet been officially named or placed on the haplotree. They are specific to particular family lines and must be found in multiple testers before receiving official designation.

A terminal SNP represents the most recently confirmed and named mutation on the Y-DNA haplotree for an individual. It defines the latest known subclade in a person’s lineage.

Both can be distinguished by naming status. Private variants are unnamed mutations waiting to be officially recognized. Terminal SNPs have been officially named and placed on the haplotree.

Verification requirements for both are different. Private variants need confirmation through multiple testers to become named SNPs. Terminal SNPs are already established and confirmed markers.

Both represent different points on a genealogical timeline. Private variants typically represent more recent mutations in a family line. Terminal SNPs can represent older, well-established branch points in the haplotree.

For a private variant to be officially named and placed on the Y-DNA haplotree, it must be found in at least two or more samples with sufficient positive reads; compared against other Big Y DNA test results to verify uniqueness; and reviewed by phylogenetic experts to ensure it hasn’t been discovered by another lab.

Once confirmed, private variants receive specific designations. For Big Y-500 discoveries they get the prefix “BY” followed by a number. For Big Y-700 discoveries they receive the prefix “FT” (or FTA, FTB, FTC, FTD) with a number.

See, for references:

Rowe-Schurwanz, Big Y Lifetime Analysis: The Myth of the Manual Review, 22 Nov 2023, FamilyTreeDNA Blog, https://blog.familytreedna.com/big-y-manual-review-lifetime-analysis/

Private variant vs novel variant vs singleton, 31 May 2015, FamilyTreeDNA Forum, https://forums.familytreedna.com/forum/paternal-lineages-y-dna/y-dna-haplogroups-snps-basics/330714-private-variant-vs-novel-variant-vs-singleton

Estes, Roberta, Glossary  – Terminal SNP, 29 Nov 2017, DNAeXplained – Genetic Genealogy, https://dna-explained.com/2017/11/29/glossary-terminal-snp/

Estes, Roberta, Y DNA: Step-By-Step Big Y Analysis, 30 May, 2020, DNAeXplained – Genetic Genealogy, https://dna-explained.com/2020/05/30/y-dna-step-by-step-big-y-analysis/

Marian AJ. Clinical Interpretation and Management of Genetic Variants. JACC Basic Transl Sci. 2020 Oct 26;5(10):1029-1042. doi: 10.1016/j.jacbts.2020.05.013. PMID: 33145465; PMCID: PMC7591931, https://pmc.ncbi.nlm.nih.gov/articles/PMC7591931/

Yang L. A Practical Guide for Structural Variation Detection in the Human Genome. Curr Protoc Hum Genet. 2020 Sep;107(1):e103. doi: 10.1002/cphg.103. PMID: 32813322; PMCID: PMC7738216, https://pmc.ncbi.nlm.nih.gov/articles/PMC7738216/

Marshall, C.R., Chowdhury, S., Taft, R.J. et al. Best practices for the analytical validation of clinical whole-genome sequencing intended for the diagnosis of germline disease. npj Genom. Med. 5, 47 (2020). https://doi.org/10.1038/s41525-020-00154-9

Angelo Fortunato, Diego Mallo, Shawn M Rupp, Lorraine M King, Timothy Hardman, Joseph Y Lo, Allison Hall, Jeffrey R Marks, E Shelley Hwang, Carlo C Maley, A new method to accurately identify single nucleotide variants using small FFPE breast samples, Briefings in Bioinformatics, Volume 22, Issue 6, November 2021, bbab221, https://doi.org/10.1093/bib/bbab221

Big Y Private Variants Guide, FamilyTreeDNA Help center, https://help.familytreedna.com/hc/en-us/articles/4402695710223-Big-Y-Private-Variants-Guide

de Vere, Lloyd, What Is your template statement for Y DNA proved by Big Y SNPs, 21 Jan 2022, WikiTree G2G, https://www.wikitree.com/g2g/1362001/what-is-your-template-statement-for-y-dna-proved-by-big-y-snps

[41] Cloud, Janine, Y-DNA Haplotree Growth and Genetic Discoveries in 2024, 16 Jan 2025, FamilyTreeDNA Blog, https://blog.familytreedna.com/y-dna-haplotree-growth-2024/

[42] See, for example:

The Braudel Method, The Indian Ocean World Centre, a McGill Research Centre, McGill University, https://indianoceanworldcentre.com/fernand-braudel/

Guldi J, Armitage D. Going forward by looking back: the rise of the longue durée. In: The History Manifesto. Cambridge University Press; 2014:14-37

McNeill, William H. “Fernand Braudel, Historian.” The Journal of Modern History, vol. 73, no. 1, 2001, pp. 133–46. JSTOR, https://doi.org/10.1086/319882 

Dale Tomich, The Order of Historical Time: Longue Durée and Micro-History, Almanack. Guarulhos, n.02, p.52-65, 2o semestre de 2011, https://www.scielo.br/j/alm/a/dF7D8LWPFhCjtjmx7NKbtQk/?format=pdf&lang=en

Smith, Michael, E., Braudel’s Temporal Rhythms and Chronology Theory in Archaeology, in: Knapp AB, ed. Archaeology, Annales, and Ethnohistory. New Directions in Archaeology. Cambridge University Press; 1992:23-34. https://www.public.asu.edu/~mesmith9/1-CompleteSet/MES-92-Braudel1.pdf

[43] The the following influences on gentiic genealogy:

Influence DescriptionExamples in G Haplogroup
MigrationGenetic haplogroup migration is the study of how people with a particular genetic haplogroup have moved over time. By analyzing the distribution of haplogroups in different populations, geneticists can learn about human migration and evolution. [a] The predominant migratory path of the G haplogroup is believed to be from the Middle East, spreading westward across Anatolia into Europe during the Neolithic period, with some branches migrating eastward towards the Iranian plateau and Central Asia, with the highest concentrations currently found in the Caucasus region. [b]
BottleneckIt refers to a drastic reduction in a population size or the decimation of a gene pool (haplogroup) due to a catastrophic event or changes in social customs. The surviving individuals may not represent the full genetic spectrum of the original population. [c] The split between the G1 and G2 subclades, which is believed to have occurred in the region of modern-day Iran around the Last Glacial Maximum (LGM), indicating a period of significantly reduced population size where a small group of individuals carrying the G haplogroup expanded and diversified into the G1 and G2 lineages; this is often observed in the distribution of G2a, which is prevalent in the Caucasus and parts of the Middle East, suggesting a population expansion from a limited founder population. [d]
Founder EventIn a founder event, the founding group inherently carries only a subset of the original population’s genetic variation. [e] A founder event within the G haplogroup could be the migration of a population carrying the G haplogroup from the Caucasus region (where it is believed to have originated) into the Anatolian peninsula, leading to a significant increase in the frequency of G lineages within that region, possibly associated with the spread of early agriculture during the Neolithic period. [f]
AdmixtureThe process where individuals from two or more previously distinct populations interbreed, resulting in a new population with a mixed genetic ancestry, essentially meaning their DNA contains genetic traits from multiple ancestral origins; it’s the mixing of genes from different populations over time, creating a mosaic of genetic heritage within an individual.  [g]An example of admixture in the G haplogroup would be the presence of a significant portion of individuals carrying the G haplogroup in a population that is primarily associated with another haplogroup, like finding a high frequency of G haplogroup carriers in a region historically dominated by people with the R haplogroup, indicating past intermixing between populations from different geographical origins where the G haplogroup is more prevalent, such as the Middle East or the Mediterranean region. [h]
Population IsolationA situation where a group of people are geographically or culturally separated from other populations, leading to limited gene flow and a distinct genetic makeup within that isolated group, often revealing unique patterns in their DNA when compared to broader populations; essentially, it means a population has minimal genetic mixing with surrounding groups due to barriers like distance, language, or social customs, allowing researchers to study specific genetic traits more easily.  [i]
The Caucasus region’s mountainous terrain and historical political boundaries contributed to a degree of isolation, allowing specific G subclades to develop and become more prevalent within those populations. [j]
Natural Selection
Genetic Drift The random change in the frequency of certain genetic variants (alleles) within a population over time, simply due to chance, which can lead to some lineages becoming more prevalent while others become less common, even if those variations have no direct impact on survival or reproduction. It is a process where certain genes are passed on more frequently by random chance, altering the genetic makeup of a population over generations. [k]
Genetic drift has a more significant impact on smaller populations, where random fluctuations in allele frequencies can drastically change the genetic makeup. In Wales, a distinctive G2a3b1 type (DYS388=13 and DYS594=11) dominates and pushes the G percentage of the population higher than in England. [l]
DemeA “deme” refers to a small, localized population of organisms within a species that interbreed primarily with each other, essentially a distinct breeding group with a shared gene pool, often considered a sub-population within a larger population; it’s a key concept in population genetics, particularly when studying how genes evolve within geographically restricted areas. [m]Research demonstrates that patrilineal kinship systems played a crucial role in creating a Y-DNA bottleneck that occurred approximately 5,000-7,000 years ago.
The Y-chromosome bottleneck was a dramatic reduction in male genetic diversity to approximately one-twentieth of its original level, while female genetic diversity remained stable. [n]

[a] Lell JT, Wallace DC. The peopling of Europe from the maternal and paternal perspectives. Am J Hum Genet. 2000 Dec;67(6):1376-81. doi: 10.1086/316917. Epub 2000 Nov 9. PMID: 11078473; PMCID: PMC1287914, https://pmc.ncbi.nlm.nih.gov/articles/PMC1287914/

[b] Balanovsky O, Zhabagin M, Agdzhoyan A, Chukhryaeva M, Zaporozhchenko V, Utevska O, et al. (2015) Deep Phylogenetic Analysis of Haplogroup G1 Provides Estimates of SNP and STR Mutation Rates on the Human Y-Chromosome and Reveals Migrations of Iranic Speakers. PLoS ONE 10(4): e0122968. https://doi.org/10.1371/journal.pone.0122968

[c] Sanders, Robert, Bottlenecks that reduced genetic diversity were common throughout human history, 23 Jun 2022, UC Berkeley News, https://news.berkeley.edu/2022/06/23/bottlenecks-that-reduced-genetic-diversity-were-common-throughout-human-history/

Zeng, T.C., Aw, A.J. & Feldman, M.W. Cultural hitchhiking and competition between patrilineal kin groups explain the post-Neolithic Y-chromosome bottleneck. Nat Commun9, 2077 (2018). https://doi.org/10.1038/s41467-018-04375-6

Tournebize R, Chu G, Moorjani P (2022) Reconstructing the history of founder events using genome-wide patterns of allele sharing across individuals. PLoS Genet 18(6): e1010243. https://doi.org/10.1371/journal.pgen.1010243 

[d] Burkhard Berger, Harald Niederstätter, Daniel Erhart, Christoph Gassner, Harald Schennach, Walther Parson, High resolution mapping of Y haplogroup G in Tyrol (Austria), Forensic Science International: Genetics, Volume 7, Issue 5, 2013,Pages 529-536, https://www.sciencedirect.com/science/article/abs/pii/S1872497313001361

[e] Slatkin M. A population-genetic test of founder effects and implications for Ashkenazi Jewish diseases. Am J Hum Genet. 2004 Aug;75(2):282-93. doi: 10.1086/423146. Epub 2004 Jun 18. PMID: 15208782; PMCID: PMC1216062, https://pmc.ncbi.nlm.nih.gov/articles/PMC1216062/

[f] Sims LM, Garvey D, Ballantyne J. Improved resolution haplogroup G phylogeny in the Y chromosome, revealed by a set of newly characterized SNPs. PLoS One. 2009 Jun 4;4(6):e5792. doi: 10.1371/journal.pone.0005792. PMID: 19495413; PMCID: PMC2686153, https://pmc.ncbi.nlm.nih.gov/articles/PMC2686153/

[g] Shriner D. Overview of admixture mapping. Curr Protoc Hum Genet. 2013;Chapter 1:Unit 1.23. doi: 10.1002/0471142905.hg0123s76. PMID: 23315925; PMCID: PMC3556814, https://pmc.ncbi.nlm.nih.gov/articles/PMC3556814/

[h] Haplogroup G (Y-DNA) by country, Wikipedia, This page was last edited on 15 October 2024, https://en.wikipedia.org/wiki/Haplogroup_G_(Y-DNA)_by_country

[i] Killgrove, Kristina, 9 of the most ‘genetically isolated’ human populations in the world, 17 Dec 2024, https://www.livescience.com/health/9-of-the-most-genetically-isolated-human-populations-in-the-world

[j] Sims LM, Garvey D, Ballantyne J. Improved resolution haplogroup G phylogeny in the Y chromosome, revealed by a set of newly characterized SNPs. PLoS One. 2009 Jun 4;4(6):e5792. doi: 10.1371/journal.pone.0005792. PMID: 19495413; PMCID: PMC2686153,https://pmc.ncbi.nlm.nih.gov/articles/PMC2686153/

[k] Genetic Drift and Natural Selection, Population Genetics and Statistics for Forensic Analysts National Institute of Justice , U.S. Department of Justice, https://nij.ojp.gov/nij-hosted-online-training-courses/population-genetics-and-statistics-forensic-analysts/population-theory/hardy-weinberg-principle/genetic-drift-and-natural-selection

[l] Genetic Drift, Wikipedia, This page was last edited on 15 December 2024, https://en.wikipedia.org/wiki/Genetic_drift

[m] Deme (biology), Wikipedia, This page was last edited on 1 May 2023, https://en.wikipedia.org/wiki/Deme_(biology)

[n] Zeng, T.C., Aw, A.J. & Feldman, M.W., Cultural hitchhiking and competition between patrilineal kin groups explain the post-Neolithic Y-chromosome bottleneck. Nat Commun 9, 2077 (2018). https://doi.org/10.1038/s41467-018-04375-6

[44] Rob Spencer, The Big Picture of Y STR Patterns, The 14th International Conference on Genetic Genealogy, Houston, TX March 22-24, 2019,  http://scaledinnovation.com/gg/ext/RWS-Houston-2019-WideAngleView.pdf Page 12

[45] Zeng, T.C., Aw, A.J. & Feldman, M.W., Cultural hitchhiking and competition between patrilineal kin groups explain the post-Neolithic Y-chromosome bottleneck. Nat Commun 9, 2077 (2018). https://doi.org/10.1038/s41467-018-04375-6

[46] Paleogenomics is the scientific field focused on reconstructing and analyzing genomic information from ancient DNA. This cutting-edge discipline has revolutionized our understanding of ancient life through the examination of preserved genetic material. Paleogenomics has made significant contributions to genealogical research by revolutionizing our understanding of human ancestry and migration patterns.

Anthropological genetics has become a fundamental tool in reconstructing human evolutionary histories by combining molecular analysis with traditional anthropological approaches. The field combines insights from genomics, archaeology, and anthropology to understand transformative processes like migration and colonization1. This multidisciplinary approach provides a more comprehensive understanding of human evolutionary history.

The integration of historical analysis and ancient DNA research has revolutionized our understanding of human migration patterns and cultural development. This integrated approach continues to provide new insights into human history, demonstrating that cultural and biological histories are deeply intertwined. For example, archaeological evidence has helped interpret genetic data by providing crucial temporal and spatial frameworks. For example, the discovery of pottery in Anatolia coincided with genetic signatures from Levantine farmers, indicating a migration associated with technological advancement.

Paleaognomics, Wikipeda, This page was last edited on 16 December 2023, https://en.wikipedia.org/wiki/Paleogenomics

Hassler, Margaret, Genetic Lab to Revisit the Past, College of Liberal Arts, anthropology, University of Minnesota, https://cla.umn.edu/anthropology/news-events/story/genetics-lab-revisit-past

Gokcumen, Omer, “Evolution, Function and Deconstructing Histories: A New Generation of Anthropological Genetics” (2017). Human Biology Open Access Pre-Prints. 124.
http://digitalcommons.wayne.edu/humbiol_preprints/124

Pickrell JK, Reich D. Toward a new history and geography of human genes informed by ancient DNA. Trends Genet. 2014 Sep;30(9):377-89. doi: 10.1016/j.tig.2014.07.007. Epub 2014 Aug 26. PMID: 25168683; PMCID: PMC4163019, https://pmc.ncbi.nlm.nih.gov/articles/PMC4163019/

Skourtanioti, E., Ringbauer, H., Gnecchi Ruscone, G.A. et al. Ancient DNA reveals admixture history and endogamy in the prehistoric Aegean. Nat Ecol Evol 7, 290–303 (2023). https://doi.org/10.1038/s41559-022-01952-3

[47] Sources for creating the illustration are from various sources:

[a] Rolf Langland and Mauricio Catelli, Haplogroup G-L497 Chart D: FG4 77 Branch, 2 Aug 2024, FTDNA G-L497 Working Group, https://drive.google.com/file/d/1xuZseoX40tWQhU5TpXZXqD6Y9zI9eqVz/view ;

[b] FTDNA Globetrekker Mapping of migration of the G Haplogroup based on end point for G-Y132505;

[c] Maciamo, Eupedia map of Late Bronze Age Europe (1200 – 1000 BCE), 2009 – 2017, https://www.eupedia.com/europe/neolithic_europe_map.shtml#late_bronze_age ;

[d] “The percentage of haplogroup G among available samples from Wales is overwhelmingly G-P303. Such a high percentage is not found in nearby England, Scotland or Ireland.”

Haplogroup G-P303, Wikipedia, This page was last edited on 10 December 2024, https://en.wikipedia.org/wiki/Haplogroup_G-P303 ;

(e) “In Wales, a distinctive G2a3b1 type (DYS388=13 and DYS594=11) dominates and pushes the G percentage of the population higher than in England.

Haplogroup G-M201, Wikipedia, This page was last edited on 6 January 2025, https://en.wikipedia.org/wiki/Haplogroup_G-M201 and

[f] E.K. Khusnutdinova, N.V. Ekomasova, et al., Distribution of Haplogroup G-P15 of the Y-Chromosome Among Representatives of Ancient Cultures and Modern Populations of Norther Eurasia, Opera Med Physiol. 2023. Vol. 10 (4): 57 – 72, doi: 10.24412/2500-2295-2023-4-57-72

[g] Watkins, Mathew, The migration path for the G-L497 men entering into Britain, 28 May 2024, Activity Feed, G-L497 Y-DNA Group Project, FamilyTreeDNA, https://www.familytreedna.com/groups/g-ydna/activity-feed

[48] FamilyTreeDNA offers a wide variety of Y-DNA Group Projects to help further research goals. The group projects are associated with specific branches of the Y-DNA Haplotree, geographical areas, surnames, or other unique identifying criteria. Based on their respective area of focus, the research groups have access to and the ability to compare Y-DNA results of fellow project members to determine if they are related. These projects are run by volunteer administrators who specialize in the haplogroup, surname, or geographical region that one may be researching. 

For my research on the Griff(is)(es)(ith) family, upon the receipt of my Y-DNA test, I joined five Y-DNA Family Tree DNA based projects to assist in my ongoing research:

The Wales Cymru DNA project collects the DNA haplotypes of individuals who can trace their Y-DNA and/or mtDNA lines to Wales (the reasoning by many researchers being that there was less genetic replacement from invaders there than elsewhere, excepting small inaccessible islands and similar locales). Tradition holds that the Celts retreated as far west in Wales as possible to escape invading populations. This project seeks to determine the validity of the theory. This project is open to descendants from all of Wales. (857 members as of the date of this article.)

The GRIFFI(TH,THS,N,S,NG…etc) surname project is intended to provide an avenue for connecting the many branches of Griffith, Griffiths, Griffin, Griffis, Griffing and other families with derivative surnames. The Welsh patronymic naming system, practiced into the latter 18th century, makes this task more difficult. Evan, Thomas, John, Rees, Owen, and many other common Welsh names may share common male ancestors. (871 members as of the date of this article).

The G-L497 project includes men with the L497 SNP mutation or reliably predicted to be G-L497+ on the basis of certain STR marker values. The L-497 is a branch or subclade of the G-haplogroup (M201+). The project also welcomes representatives of L497 males who are deceased, unavailable or otherwise unable to join, including females as their representatives and custodians of their Y-DNA. The primary goal of the project is to identify new subgroups of haplogroup G-L497 which will provide better focus to the migration history of our haplogroup G-L497 ancestors. (2,438 members as of the date of this article.)

The G-Z6748 project is a Y-DNA Haplogroup Project for a specific branch that is a more recent, ‘downstream’ branch from the L-497 branch of the G haplotree. It is a project work group that is a subset of the L497 work group. The G-Z6748 subclade or brand appears to be a largely Welsh haplogroup, though extending into neighboring parts of England. (50 members as of the date of the article)

The Welsh Patronymics project is designed to establish links between various families of Welsh origin with patronymic style surnames. Because the patronymic system (father’s given name as surname) continued until the 19th century in some parts of Wales, there was no reason to limit this study to a single surname. (1,661 members as of the date of this article.)

[49] The tool creates personalized animations spanning 200,000 years of history, tracking ancestral journeys from Y-Adam to an individual’s current Big Y haplogroup. It contains over 48,000 paternal line migration paths covering all populated continents.

Example Used in the Diagram

Click for Larger View | Source: FTDNA Globetrekker Mapping of migration of the G Haplogroup based on end point for G-Y132505

Globetrekker employs sophisticated phylogenetic algorithms that factor in topographical information, historical global sea levels, land elevation, and ice age glaciation. The system combines multiple data types to generate migration paths: archaeological data, earliest known ancestor locations from users and matches, ancient DNA samples, and population genetic studies.

Estes, Roberta, Globetrekker – A New Feature for Big Y Customers from FamilyTreeDNA, 4 Aug 2023, DNAeXplained – Genetic Genealogy, https://dna-explained.com/2023/08/04/globetrekker-a-new-feature-for-big-y-customers-from-familytreedna/

Runfeldt, Goran , Globertrekker, Part 1: A NewFamilyTreeDNA Discover™ Report that Puts Big Y on the Map, 31 Jul 2023, FamilyTreeDNA Blog, https://blog.familytreedna.com/globetrekker-discover-report/

Maier, Paul, Globetrekker, Part 2: Advancing the Science of Phylogeography, 15 Aug 2023, FamilyTreeDNA Blog, https://blog.familytreedna.com/globetrekker-analysis/

[50] Rootsi S, Myres NM, Lin AA, Järve M, King RJ, Kutuev I, Cabrera VM, Khusnutdinova EK, Varendi K, Sahakyan H, Behar DM, Khusainova R, Balanovsky O, Balanovska E, Rudan P, Yepiskoposyan L, Bahmanimehr A, Farjadian S, Kushniarevich A, Herrera RJ, Grugni V, Battaglia V, Nici C, Crobu F, Karachanak S, Hooshiar Kashani B, Houshmand M, Sanati MH, Toncheva D, Lisa A, Semino O, Chiaroni J, Di Cristofaro J, Villems R, Kivisild T, Underhill PA. Distinguishing the co-ancestries of haplogroup G Y-chromosomes in the populations of Europe and the Caucasus. Eur J Hum Genet. 2012 Dec;20(12):1275-82. doi: 10.1038/ejhg.2012.86. Epub 2012 May 16. PMID: 22588667; PMCID: PMC3499744, https://pmc.ncbi.nlm.nih.gov/articles/PMC3499744/

Hay, Maciamo,Haplogroup G2a (Y-DNA), Jul 2023, Eupedia, https://www.eupedia.com/europe/Haplogroup_G2a_Y-DNA.shtml

Haplogroup G-M201, Wikipedia, This page was last edited on 13 January 2025, https://en.wikipedia.org/wiki/Haplogroup_G-M201

Haplogroup G-P303, Wikipedia, This page was last edited on 10 December 2024, https://en.wikipedia.org/wiki/Haplogroup_G-P303

[51] E.K. Khusnutdinova, N.V. Ekomasova, et al., Distribution of Haplogroup G-P15 of the Y-Chromosome Among Representatives of Ancient Cultures and Modern Populations of Northern Eurasia, Opera Med Physiol. 2023. Vol. 10 (4): 57 – 72, doi: 10.24412/2500-2295-2023-4-57-72

Rootsi S, Myres NM, Lin AA, Järve M, King RJ, Kutuev I, Cabrera VM, Khusnutdinova EK, Varendi K, Sahakyan H, Behar DM, Khusainova R, Balanovsky O, Balanovska E, Rudan P, Yepiskoposyan L, Bahmanimehr A, Farjadian S, Kushniarevich A, Herrera RJ, Grugni V, Battaglia V, Nici C, Crobu F, Karachanak S, Hooshiar Kashani B, Houshmand M, Sanati MH, Toncheva D, Lisa A, Semino O, Chiaroni J, Di Cristofaro J, Villems R, Kivisild T, Underhill PA. Distinguishing the co-ancestries of haplogroup G Y-chromosomes in the populations of Europe and the Caucasus. Eur J Hum Genet. 2012 Dec;20(12):1275-82. doi: 10.1038/ejhg.2012.86. Epub 2012 May 16. PMID: 22588667; PMCID: PMC3499744, https://pmc.ncbi.nlm.nih.gov/articles/PMC3499744/

Hay, Maciamo,Haplogroup G2a (Y-DNA), Jul 2023, Eupedia, https://www.eupedia.com/europe/Haplogroup_G2a_Y-DNA.shtml

G-P15 (Y-DNA), Geni, https://www.geni.com/projects/G-P15-Y-DNA/3927

The Need for Standards and Method in Genealogy Research

It has been reported thatgenealogy is the second most popular hobby in the U.S. after gardening … and the second most visited category of websites, after pornography. It’s a billion-dollar industry that has spawned profitable websites, television shows, scores of books and — with the advent of over-the-counter genetic test kits — a cottage industry in DNA ancestry testing. [1]

Since we are talking about the need for method and research standards, the veracity of the above quote has actually been called in to question by amateur genealogists. Time magazine, USA Today, Marist Opinion Polls, ABCNews, and other news sources who quoted this statement do not include general sources to back up their statement of fact about the popularity of genealogy. They also do not define what is a “hobby”, which would then allow one to determine the baseline for their statistics. The popularity claim appears to be an example of an unsourced statement that gained credibility through repeated citation rather than actual evidence. Consequently, the oft quoted statement about the popularity of amateur genealogical research is largely based on conjecture. [2]

“Observations about an American genealogy or family history boom have, however, been made many times before, such as in the 1920s and 1970s. Given its impact and longevity, it is safe to say that genealogy constitutes one of the most important sociocultural pursuits in modern U.S. history.” [3]

It is safe to say since the 1990’s there has been an appreciable increased interest in genealogy. The popularity of genealogy has been overstated, though it remains a significant interest, with seventy percent of Americans considering it important to know their family history. A recent poll finds that 7 in 10 Americans think it is important to know their family’s history. The poll also finds that older generations are more likely than younger generations to say that knowing their ancestry is important. [4]

More folks are interested in finding out about the past, their family ties and DNA connections. Much of the interest is attributed to access to digitalized genealogical records on the internet. The interest in genealogy is also the result of the availability of various DNA genetic tests to locate relatives and gain estimates of one’s purported ethnicity.

Consequences of Genealogy’s Popularity

The democratization of genealogical research has indeed created significant research quality concerns. It represents a double-edged sword – while making family research more accessible, it has also created significant challenges in maintaining research standards and accuracy. [5]

Amateur genealogists often perpetuate debunked theories and transcription errors through online sharing. The proliferation of undocumented genealogical research spreads like a virus as people incorporate unverified information into their family trees. An example of this is depicted in an online threaded discussion on John ap Gruffudd (Pengruffwnd) – Wales, an individual I will discuss below. One of the commentators of this ongoing discussion has labeled these family trees as “The Welsh Trees R Us”[6]

The relationship between academic historians and amateur genealogists became strained, with some scholars dismissing genealogical research as lacking academic rigor. The “free and public” nature of online genealogy has led to concerns about the quality of historical material being co-opted by commercial sites. [7]

While digital technologies have made genealogy more accessible and affordable, this has created issues with data validation and verification. The genealogical industry’s promotion of easy access has contributed to a “genealogical craze” that sometimes prioritizes quantity over quality. [8]

A major challenge for genealogists is to avoid falling into a trap of forcing facts, evidence of ‘common descendants’ into their desired view of the past and into their genealogical trees. There is a tendency among amateur genealogists to latch on to those few sources of available information about individuals in the distant past and attach them to their genealogical lineage without critical analysis.

These ‘common family’ ancestors become the ‘Adam or Eve’ of many family trees. This is especially the case with internet based family trees. This tendancy, howver, existed before the advent of commerical based family trees. Prior to the emergence of internet based family research, amateur genealogists would latch onto ‘prominent individuals’ that were mentioned in published manuscripts of families or surnames to build out their family histories.

The predominant reason why these individuals are referenced in so many disparate, unrelated family trees is mainly due to the simple archival fact that specific documents about these individuals have withstood the test of time and have not perished. Conversely, there is an absence of information on the other countless souls with similar names. Rather can declare that there is no evidence and that there is a brick wall in their family trees, researchers grab onto facts that provide no evidence of what they are attempting to prove.

The Griffis(ith)(es) Family Name from Huntington, New York

Reviewing and analyzing evidence found in genealogical work on the family surname through Griffin(th)(ths)(es)(ing)(s) family lineages in America had led me to question the validity and veracity of many of the genealogical stories, family trees, unpublished manuscripts, and published documents. [10]


Derivative Source of the Baptism of William Griffis, My ‘Brick Wall’ for the Griffis Family

Click for Larger View | Source: Rev Ebenezer Prime, M.L. Scudder (pub), Records of the First church in Huntington, Long island, 1723-1779. Being the record kept by the Rev. Ebenezer Prime, the pastor during those years, Huntington, N. Y., Printed for M. L. Scudder, 1899, https://archive.org/details/recordsoffirstch00hunt_0/page/n5/mode/2up

The Need for Verifying Evidence for Family Ancestors

The author of one self published manuscript on a Griffith family claimed: To my knowledge this is the first book published with a complete pedigree of this Griffith lineage from year 100 through 1979. [11]

Tracing one’s ancestors back to the year 100 CE is indeed a daunting and remarkable task that perhaps raises more questions concerning the veracity of sources. Many of the documented pedigrees of Welsh families in the medieval times that family genealogists rely upon were of gentry and nobility. Most of the ‘common folk’ were tenant farmers and while many took the names of the gentry that they worked for or lived nearby, it is highly likely the documented pedigrees are not their pedigrees. 

It is a good example of why research standards should be followed when conducting genealogical research. The Genealogical Proof Standard (GPS) embodies the general research standards that conform to my personal research standards when conducting genealogical research.

The Genealogical Proof Standard (GPS) was developed by the Board for Certification of Genealogists (BCG) in the 1990s and was first formally published in 2000 in “The BCG Genealogical Standards Manual”. The standard was created in response to the booming internet era to help researchers navigate the challenges of online genealogical research and establish reliable proof standards. Before 2000, genealogists, such as myself, borrowed standards from other professions until BCG published their own list of genealogical standards. [12]

It serves as a methodology for both professional and amateur genealogists to validate their research findings. [13] As discussed in a prior story on genealogical facts and evidence, It consists of five elements:

  1. Reasonably exhaustive research;
  2. Complete and accurate source citations;
  3. Thorough analysis and correlation of evidence;
  4. Resolution of conflicting evidence; and
  5. Soundly reasoned and coherently written conclusion

Illustration One: The Genealogical Proof Standard

Click for Larger View | Source: The map was created in 2008 by Mark Tucker as a visualization of the genealogical proof standard. It is meant as a tool for genealogists and family historians. It combines concepts from the Board for Certification of Genealogists and the works of professional genealogist, Elizabeth Shown Mills. https://www.familysearch.org/en/wiki/Genealogy_Research_Process_Map

Common Myths and Unsubstantiated ‘Facts’

One of the common ‘myths’ or unsubstantiated series of facts that has repeatedly been used to build American Griff(is)(ith)(es) family trees is tying their family stories to the lives of Edward Griffin(en)(th) (born around 1602) and his brother John (born around 1608) from Walton, Pembrokeshire, South Wales. Depending on historical references, Edward and brother John’s last name is spelled Griffen, Griffith or Griffin. Both brothers purportedly traveled in 1635 from Wales on the ships Abraham and Constance respectively, landing on Kent Island off the coast of Virginia.  They have been mentioned in various family manuscripts and published genealogies. If you start to research on any variant of the ‘Griff-‘ name in America, you will eventually be brought to these brothers. [14]

Many of the family histories also trace the purported family lineage backward from Edward Griffiin(en)(th) to Richard Pengruffwnd. This link is largely based on the research by Zeno Griffen. The common theme of this genealogical story is: Richard or Richiart’s descendancy purportedly is to a Gruffydd Pengruffwnd (Griffith Griffith) his son, who had a son John Griffith (who married Ann Langfort(d), who had Edward (b. 1602) and John (b. 1608).  [15]

As Theresa Griffin, an amateur genealogist, has exhaustively and methodically documented in her research of the Griffin family, there were more than twenty Griffin family histories at the time of her critical analysis of Griffin family research that tie Pengruffwnd [Pengriffin] and his descendants with the Edward Griffith(in) who arrived in Virginia in 1635, and who ended his days as Edward Griffin(en)(th), in Flushing, New York.  Almost all of these publications and family trees cite the written work of Zeno T. Griffen or can be traced back to his research. [16]

Through her methodical research Theresa Griffin cogently calls to question many of the assumptions, historical narratives, and family ties associated with Edward Griffin(en)(th), particularly the influence of the writings of Zeno Griffin. However, she perceptively acknowledges the limitations that professional and amateur genealogists faced before the advent of the internet and the digitalization of records, and the search accessibility of records that are common today.

It is not my intention to condemn the work of Zeno T. Griffen, or any Griffin family historian. According to Zeno, he had relied upon his father’s unpublished, handwritten manuscript which was written circa 1830. The fact that Zeno was able to locate as much correct information as he did, without the use of the computer, Internet, easy travel, or on-demand access to documents from all over the world, is to be admired. I do not believe Zeno intended to deceive anyone with his suppositions, only that he had access to a small pool of documents and he drew his conclusions solely from that pool. … Although Zeno often gave specific dates for the events he reported, which was probably enough to convince early 20th century readers of his conclusions, with few exceptions he did not accurately cite his references. Because the current conventions for documenting sources are much more rigorous than they were in 1906, and access to ancient documents is on the rise, it is time to authenticate the facts presented in previous Griffin family histories.[17]

Quality of Evidence in Family Trees and Manuscripts

There are a number of web based family trees, unpublished personal manuscripts and published sources that directly reference William Griffis(th)(in)(ths) of Huntington, New York. Five notable limitations for all of these web based trees and the family manuscripts are: 

  • None of the family trees provide complete lines of descendants for William’s twelve children that had families;
  • All of the family trees lack sound, corroborating facts that support the linkages to William’s purported parents or grandparents and other ancestors;
  • There is a general lack of citations for sources of evidence;
  • Many of internet based family trees contain inconsistent or contradictory facts; and
  • All of the family trees list family members with the same uniform surname with no substantiation of facts regarding discrepancies in spelling or that a given family member used a specific spelling of Griffis, Griffith, Griffies, or Griffes. 

There are three genealogical manuscripts that explicitly mention William Griffi(th)(is) of Huntington, New York. Two of the manuscripts are unpublished. The third has been published by third party companies and may have been used to document facts in one of the other two manuscripts. [18]

Table One: The Three Manuscripts Related to William Griffis

ManuscriptDescription
Peets – Welsh
Manuscript
Undocumented references to ancestors of William Griffis.
Lists William and Abiah and 12 children, and descendants of second oldest son James.
M. K. Hall manuscriptUndocumented references to ancestors of William Griffis.
Lists William and Abiah and 12 children, limited information on descendants of second son James.
Jones – Welch ManuscriptThe Jones-Welch manuscript provides a wealth of information on the family tree of the fourth child of William Griffis: William Griffis who was born in 1763.

Similar to the other manuscripts and published works about the Griffin family surname previously mentioned, they exhibit similar patterns of linking individuals without genealogical proof or citations prior to the early 1700’s.

One of the three manuscripts, which I refer to as the “Peets-Welch manuscript“, based on the author’s names, gives credit to the work of Martha K Hall. Hall was the historian for the Huntington Historical Society when Mildred Griffith Peets was writing her manuscript. Much of her research on the early descendants relies on Hall’s research and manuscript. The Peets-Welch manuscript provides information found in earlier “Griff-” family manuscripts about the purported origins of the family as well as more detailed information on James Griffis, the second oldest child of William, and his descendants.

The Peets-Welch manuscript relies on the purported ‘facts’ that were referenced in prior published Griffin family research, attempting to tie the family lineage back to Edward Griffiin(en)(th) to Richard Pengruffwnd (see below). In addition, the principal author, Mildred Griffith Peets, attempts to link an Edward Griffith(in) with a Richard Griffith who in turn purportedly had a son named Samuel Griffith(in).  Her documentation is sketchy, disjointed, and citations for linking each of the individuals is absent. The manuscript is written in a fashion that resembles working notes for research leads.

Pages from the Peets-Welch Manuscript Illustrating ‘Leaps of Faith’ Regarding Family Ancestors

“Griffith – Their Welsh History”

Click for Larger View | Mildred Griffith Peets, Griffith Family History in Wales 1485–1635 in America from 1635 Giving Descendants of James Griffis (Griffith) b. 1758 in Huntington, Long Island, New York, compiled by Capitola Griffis Welch, 1972

“Griffith of Flushing and Huntington”

Click for Larger View | Mildred Griffith Peets, Griffith Family History in Wales 1485–1635 in America from 1635 Giving Descendants of James Griffis (Griffith) b. 1758 in Huntington, Long Island, New York, compiled by Capitola Griffis Welch, 1972

Another manuscript, the ‘Jones-Welch manuscript‘, provides a wealth of information on the family tree of the fourth child of William Griffis: also named William Griffis who was born in 1763 and died in 1847. What is interesting about William Griffis is after serving in the American Continental Army in the American Revolution, he emigrated to Canada as a loyalist.

While these Griffis(ith) manuscripts may have certain limitations or gaps in facts and documentation, they are useful documents that provide insight into our Griffis family from Huntington, New York. They document specific branches of the family tree not only in New York state but in other parts of the country as well as Canada. They, however, have no information on my specific branch of the Griffis(th)(es) family ( the descendants of Daniel Griffis) or other branches of the family.

I continue to rely upon the above mentioned manuscripts for further leads in research. Their intentions for genealogical research were genuine but their ability to seek answers to their research questions were limited and perhaps were justifiably focused on a particular branch of the Griff(is)(ith)(es) family.

Access to genealogical sources were much more limited prior to the advent of the internet era and digital records. However, the conventions for documenting and citing sources, which are much more rigorous than simply citing an assertion or hearsay quote from a relative, call for the need to validate, in some fashion, the facts presented in previous family histories. 

In Support of Research Standards

The lack of critical analysis, citations for facts and evidence in manuscripts, books and online research about the Griff(is)(ith)(es) family underscores the need for an increased emphasis upon documentation, adherence to research standards, an analysis of facts and evidence, and record interpretation. A critical eye, a set of research principles to guide you and various methodologies to objectively analyze the facts are needed to sift through all that is posted on the internet and found in paper documents.

Guided by research standards resembling the above mentioned Genealogical Proof Standards and using traditional genealogical and historical methods, combined with Y-DNA genetic testing and methods:

  • there is documented evidence of the existence of three variants of the Griff(is)(ith)(es) surname for the descendants of William Griffis in America;
  • there is a possibility that William’s ancestors used Griffis, Griffith or Griffiths as a surname in Wales
  • there is evidence of genetic patrilineal descendants in Wales that used other surnames; and
  • there is strong evidence that the Griff(is)(ith)(es) patrilineal lineage came from the southern area of Wales and had been in Wales for a substantial period of time.

These new family research breakthroughs are partly the result of relying on the aforementioned work done by others and that facts about the family are discovered by building on previous discoveries. The results are also attributed to the ability to discover new evidence in digital form, published research on the Welsh patrilineal naming system and utilizing new discoveries and methodologies produced by contemporary researchers in traditional and genetic genealogy.

The Use of Surnames Based on Historical Documentation

If one understands the history behind the emergence of family names in Wales and the research benefits of Y-DNA tracing of the patrilineal line back through time, one should be receptive to the idea that surnames are not fixed and they are fluid through time. In fact, it is not uncommon to have different surnames associated with the same Welsh Y-DNA patrilineal family lines.

The use of surnames did not become widespread in Wales until the late eighteenth century. In the greater part of Wales, the ancient patronymic naming system continued: having children identified in relation to their father. This meant that surnames in the 1600’s and 1700’s, and even as late as the 1800’s, did not take on the weight of significance that they have for present generations. [19]

Map One: Patronymic Decay and the Rise of Surnames in Wales

Source: John and Sheila Rowlands, The Use of Surnames, Chapter 4, Patronymic Naming – A Survey in Transition, Llandysul, Ceredigion: Gomer Press, 2013, Figure 4-3: Decay in the use of patronymic naming to the 10% level, Page 56 | Click for Larger View

The map above (Map One), reveals the wide variation when surnames were adopted in various parts of Wales. Surnames became the norm by 1750 across the coastal plain of south Wales and along the eastern border with England. The Griff(is)(ith)(es) family line was probably from the blue circled area on the southern coast of Wales. The evidence that supports this supposition is discussed below.

It was not until the mid-nineteenth century that the Patronymic system was fully replaced in Wales. When the Welsh immigrated to America in the sixteenth and seventeenth centuries, the patronymic pattern on both sides of the Atlantic was in stages of decay. It is not uncommon to find variations of surname spellings within and between family generations. The use of surnames was, compared to the curing of concrete, “wet cement” in the 1600’s and 1700’s.

It was in this historical context that it was not a total surprise to document the use of three different spellings of the family surname in the mid to late 1700s. A review of the historical documentation and evidence associated with the different surname spellings can be found in a prior story. [20]

A variety of Federal, state and local records were used to determine the spelling patterns among the twelve children of William Griffis and their respective families. Baptismal records, marriage records, family manuscripts, burial records, cemetery records, church records, tax records, Federal and state census records, and revolutionary war records were used to document naming patterns.

Government records often can contain errors associated with names, dates and other information, so multiple pieces of corroborating evidence were gathered to assess naming patterns for each sibling of William Griffis and their respective family members. A strong genealogical proof relied on finding consistent information across multiple independent sources, not just relying on a single document.


An example of the variability in transcribing individual information can be found in the Huntington, New York Tax Rolls. The surname is spelled as Griffeth, Griffeths, and Griffiths. In 1799, the tax assessors located three of the brothers. I imagine the enumerator of the tax information probably knew the three ‘Griffis’ brothers since it was a small community. Nonetheless their names were spelled three different ways: Stephen Griffeths, Epenetus Griffeth, and James Griffiths! [21]

Huntington, New York Tax Rolls, 1799

1799 Huntington New York Tax Rolls


Various ‘correlation tools or methods’ were used to analyze and compare different pieces of information from various sources to identify patterns and confirm relationships between individuals and family members. The approach was essentially piecing together a family tree by looking for consistent details like names, dates, locations, and other identifying factors across multiple records, using tables, timelines, maps, and lists to visualize these connections. [22]

Illustration Two: William and his Twelve Children

The variations of spelling the Griff(is)(es)(th) surname in the first two generations of the family. Click for larger view.

The chart to the left (illustration two) reflects the variations in spelling in the family surname among William’s 12 children.

Based on my assessment of genealogical evidence, seven of the children used the ‘Griffis’ surname, three used the ‘Griffith’ surname and one used the ‘Griffes’ surname.

The third generation of the family reflects a continuation of various spellings of the surname. The descendants of William’s second child, James Griffis, reverted back to the ‘Griffith’ surname. The descendants of the third son, William Griffis, used both Griffis and Griffith. Three of his four sons used ‘Griffis’ while a fourth son used ‘Griffith’.

The fifth son, Stephen Griffis, appeared to have used or was recorded as a Griffith and Griffis but it is not entirely certain what he actually used as a last name.

Nathaniel Griffes, the sixth son, was the only child that spelled his name as an adult with an ‘es’ on the end, Griffes. His descendants continued the tradition.

While it is not entirely certain, Joel Griffith probably spelled his name with a ‘th’ on the end.

Little is known of the second daughter of William, Esther Griffis, but she probably spelled her last name as Griffis.

Epenetus and John used Griffith and Daniel and Jeremiah used Griffis.

Using Traditional Genealogical Methods and Evidence: The Origin of the Patrilineal Family Line

Family oral history and family genealogy manuscripts suggest that the Griff(is(ith)(es) surname is of Welsh origin. There is a lack of solid traditional evidence that William’s ancestors were from Wales.

It appears based on oral history that either father or grandfather of William Griffis were the original family emigrants to the colonies. Contrary to a wide range of Griffin(th)(ths)(is)(es)(in)(ins)(ing) American family genealogies, William’s ancestors were probably not descendants of a Edward Griffin or a Richard Griffin. There are references to a Samuel Griffin (Grffing)(Greffith) (Griffith) who lived and owned land in Huntington Long Island in the late 1600’s but there is no definitive proof that he is William’s grandfather or father or was related to the family.

Oral history can be a powerful tool for historical research, if it is combined with other sources and methods. It is a form of evidence rather than an absolute truth. It can be used to complement and enrich other sources, such as documents or artifacts, by providing personal and contextual details. It can also challenge other sources by exposing gaps or contradictions, or by offering different interpretations or explanations. Oral history can create and contribute new sources by documenting and preserving the voices, stories, and experiences of people who may not be remembered otherwise. 

There are also limitations that should be taken into consideration when evaluating the facts obtained through oral or written interviews:

  1. Memory and Recall Issues: Oral history relies on the memory of individuals, which can be influenced by time, age, trauma, bias, and other factors.
  2. Subjectivity: The formation is subjective and influenced by personal biases, which may lead to distortions or inaccuracies.
  3. Verification Challenges: There can be a lack of corroborating evidence, making it difficult to verify or cross-check information.
  4. Single Perspective: Oral histories often represent a single person’s viewpoint, which can lead to an incomplete or biased historical record.
  5. False Memories: Individuals may recall memories that actually different from what actually occurred, especially for events that occurred many years ago.
  6. Interview Dynamics: The relationship between the interviewer and interviewee can create dynamics that affect the narrative, the nature of questions asked and how answers are provided based on the context of the interview.

Family folklore indicates that Albert Buffet Griffith told his daughter-in-law, Lillian, that his great, great grandfather’s name was Samuel. [23] Albert was a descendant of William’s fourth child, William Griffith. If Albert Griffith’s recollections are true, then William’s father was perhaps Samuel Griffith(is).

I obtained copies of handwritten notes on the descendants of Daniel Griffis, William’s tenth child and my direct descendant. This branch of the Griffis family lived in Niskayuna and then Mayfield, New York in the mid 1800s through the 1930s. [24]

The three pages of handwritten notes were kept by a former Town of Mayfield, New York Historian, the Reverend Edward Ruliffson. Ruliffson’s notes were based on information he received in 1935. He interviewed William J. Griffis. William’s grandfather was Daniel Griffis and his great grandfather was William Griffis from Huntington. [25]

In his notes, Rulifson indicated The name is Welsh, the same as Griffin. A Daniel Griffis came from Wales. About 1830 a Daniel Griffis, some generation or generations removed from the first Daniel came to Mayfield from Niskayuna where he married a Miss Gates and where he lived some years following his marriage.” [26]

What is telling from the oral history transcribed by the local historian Rulifson is that purportedly a Daniel Griffis came from Wales and some generation or generations removed ,William’s son Daniel Griffis moved from Niskayuna to Mayfield, New York. This piece of oral history implies there is a generation or two prior to William Griffis that immigrated from Wales. It also implies there are two Daniel’s in he family tree.

If Albert Griffith’s recollections are true, then William’s father was perhaps Samuel Griffith. This does not refute Ruliffson’s statement that a Daniel Griffis came from Wales. Perhaps the father of Samuel, who purportedly was William’s father, was Daniel. This would imply that William Griffis(th)’s grandfather was the first generation to arrive in the colonies.

However, we have no corroborating proof to substantiate whether a Daniel Griffis(ith) came from Wales. We also do not have corroborating proof that William’s father was Samuel Griff(is)(ith).

Based on historical documents associated with colonial migratory patterns, William’s father or grandfather possibly came from Bristol, which is close to the southern border of Wales, to Boston or another northern port. They initially settled in Massachusetts or Connecticut as early as 1630-1640. The family then emigrated to Huntington as part of a series of emigrant waves to populate newly established English towns on Long Island.

The Use of Griffis(ith)(iths) Surname in Wales

The Griffis(ith)(iths) surname was used by families in various parts of the British Isles. The ancestors of William Griffis could conceivably have been from anywhere in Great Britain given the prevalence of the Griffi(th)(ths)(es)(s) surnames. Based on an analysis of census data in Wales in 1850, the top ten most common names represented approximately 80 percent of the Welsh population. While these names were common, it does not imply they were related. The result of using similar names as surnames resulted in the lack of diversity in surnames in Wales. [27]

A review of data from the 1881 census of Great Britain and Griffith’s Valuation in Ireland 1853-1865, indicate that the surname of Griffith and Griffiths is found in a large number of countries throughout Great Britain and Ireland. There is a good chance that the ancestors of William Griffis were from Wales and from southern Wales. Of course, this statement is based on the assumption that the 1853-65 and 1881 data sets may illustrate enduring trends in the distribution of surnames from the time William’s ancestors left Great Britain.

Four counties in Wales represent more than a majority of households with the name of Griffiths or Griffith. Perhaps William’s ancestors were from GlamorganPenbrokeCaernafon or Carmarthen counties. These four of the twelve counties represent 63 percent of Welsh households that have the name Griffith or Griffith. Glamorgan has the largest proportionate presence of the Griffith(s) surnames (27%). PenbrokeCaernafon and Carmarthen are the second, third and fourth largest in representation of Griffith(s) households (15.7%, 10.4% and 10.0% respectively). While these four counties contain the largest concentration of Griffith and Griffiths households, the Griffith(s) surnames are represented in all of the Welsh counties. These two surnames are in the top ten of most popular surnames in seven of the twelve counties. [28]

Map two provides a graphic representation of where the top four counties are located. Three of the four reside on the southern coastal border of Wales. Monmouth county, which is also on the southern border, also had a sizable proportion of households that had the Griffiths name.

Map Two: Welsh Counties with Concentrations of Griffith and Griffiths Surnames

Click for Larger View | Source: Modified version of a map created by: XrysD, Map of the historic counties of Wales, 5 Nov 2009, Wikimedia Commons,https://commons.wikimedia.org/wiki/File:Wales_Historical_Counties.png

Not only should variants of the spelling of a surname be considered when reviewing various census repositories of information, different surnames should also be considered in specific geographical areas. It is not inconceivable that individuals who were related at specific historical times may have decided to use different surnames when these of surnames became popular.

There are a number of Welsh surnames that are geographically similar to where Griffith(s) surnames were found in 1881. The common Welsh surname of Roberts, Owens, Williams, Hughes, Pritchard and Jones are found 80 percent of the time in counties where the Griffith(s) households resides (see below). This is not surprising given the that these surnames were found in most of the Welsh counties. What should be kept in mind is many of these families with these different surnames could be genetically related.

Source: Rob Spencer County Clustering by Surname, Britain and Ireland SNP and Surname Mapper, https://scaledinnovation.com/gg/biMapper.html

The following information was obtained from the innovative research strategies and tools of Rob Spencer, whose main interests are the exploration of genetic genealogy and population genetics. Rob Spencer’s Britain and Ireland SNP and Surname Mapper is a genealogical mapping tool that combines Y-DNA haplogroup analysis with 19th-century census data to visualize surname distributions and genetic ancestry across Britain and Ireland.

The tool is especially valuable for genealogists and researchers trying to trace Scottish, Irish, English, or Welsh paternal ancestry through a combination of genetic and historical data. The Mapper is particularly useful for identifying patrilineal origins when multiple surnames share common Y ancestry.

Looking at data for the ‘Griffis’ and Griffith’ surname distribution on map three, one can see that households with the Griffiths and Griffith surnames are located throughout Wales. Where the two surnames are relatively larger in specific counties, a small pie chart appears in Spencer’s Surname Mapperand portions of the pie reflecting areas proportionate to prevalence of the two surnames. Counties that have a lessor presence of the surnames are reflected with small dots. The Griffith and Griffiths surnames were present in small varying degrees in many of the counties of Great Britain and Ireland.

Map Three: Census Prevalence of Griffith & Griffiths Surnames in England and Ireland, Mid to late 1800s

Source: Rob Spencer, Britain and Ireland SNP and Surname Mapper | Click for Larger View

The results of my traditional research of Welsh surnames indicate that there is compelling evidence that the Griff(is)(ith)(es) family line lived in the southern coastal region of Wales. There was also a strong possibility that ancestors related to the Griffis(ith(iths) family used other surnames such as Roberts, Owen, Owens, Williams and Hughes.

Using Genetic Genealogical Methods and Evidence: The Origin of the Patrilineal Family Line

The lack of tangible leads through traditional genealogical research sources and the advances of commercial direct-to-consumer DNA genealogical tests lead me to looking into Y-DNA genetic tests as a possible avenue to gain insights and possible leads on identifying information about the Griff(is)(ith)(iths)(es) line of descendants. [29]

Based on the limitations and the realistic expectations of what Y-DNA tests can find [30], I completed a Y-700 DNA test. [31] I had a few expectations of what I might be able to find by taking a Y-700 DNA test. Based on my traditional genealogical research I knew the Griffis family line had three spellings of the surname (Griffis, Griffith, and Griffes) in America and the use of a surname In Wales could also reflect variable spellings.

Two kinds of mutations make Y DNA genealogically useful for looking at the question of migration of a patrilineal line. They are short tandem repeat markers (STRs) and single nucleotide polymorphisms (SNPs). Both have their unique advantages in tracing Y-DNA mutations. [32]

SNP mutations occur rarely and are more stable across generations. They represent single point mutations in DNA sequence and rarely mutate back to their original form. SNPs are more reliable for determining deep ancestral lineage and can provide a basis for tracking migration patterns of genetic groups. [33]

STRs mutate rapidly (approximately one mutation every 20 generations). STRs are useful for examining recent ancestry within hundreds of years. [33] The configuration of STR mutations varies between individuals, creating unique Y-DNA haplotypes or genetic groupings among individuals. [34]

As indicated in a prior story, [35] the “One-Two” punch of testing involves using SNPs to provide a general location of Y-DNA testers on the Y-DNA haplotree based on nested haplogroups. Then, ‘the second punch’ uses Y-STR test results to group test results within recent haplogroup branches and assist in analyzing potential individual matches. The analysis and comparison of individual Y-STR haplotypes can help delineate lineages and tease out branches within the haplotree, fine-tuning relationships between people within the tree.

While STR tests are used by individual testers to discover possible Y-DNA genetic matches with other testers, the results of STR tests can also provide insights into macroscopic demographic properties that can shed light on lineages and clans – well before the time of surnames. Y- STRs have a time window that runs back to the late Bronze Age. 

STRs … tell us about demography — specifically about bottlenecks and subsequent expansions, namely “founder events.” While SNPs tell us when they were created, STRs tell us about when the population burgeoned after a founding mutation. That SNP and STR clades have a fundamentally different interpretation has caused considerable confusion, but once understood, the methods are very useful complements.” [36]

For genealogy within the most recent fifteen to twenty generations (about 500 to 660 years ago), STR markers help define paternal lineages and patterns around the advent of the use of surnames. STR analysis is an excellent approach to document genetic lineages before the use of surnames and into a period in which surname of genetically matched test kits could be different. For patrilineal lines a descent with Welsh surnames, this is important. The likelihood of finding genetic matches with test kits associated with different surnames is highly likely!  [37]

I have used a number of Y-SNP and Y-STR tools and reports to help with my process of discovery. In addition to the FamilyTreeDNA reports, I have used tools created by individual genealogists that provide creative renditions of the data. For example, assuming there are sufficient testers to compare STR results, mutation history trees and dendrograms can be created illustrate genetic distance and graphically reveal genetic branches from hundreds of years back to the recent past ( fine-tuning the smaller branches, ‘twigs’, in a genetic tree). The STR tools are highly effective if used in tandem with SNP data and traditional genealogical information). [38]

Genetic Proof of Griffi(s)(th)(es) Family Paternal Line in Wales Through the Analysis of Y-DNA SNPs

The use of SNPs are a fairly straightforward process of figuring out where a male lands on a current or possibly new branch of the Y-DNA haplotree. The results of SNP tests are intuitive and easy in analyzing a group of other Y-DNA testers because they uniquely identify the haplogroup branches of descent. You can group testers in branches of a haplotree depending on whether their tests confirm or predict specific SNP mutations that represent specific branches of the haplotree. The Y-DNA haplotree allows individuals to trace their paternal ancestry and understand their place in human genetic history. [39]

The results of my Y-DNA analysis indicate the Griffis paternal line is part of a particular Y-DNA genetic branch that is not common among contemporary males in Europe. We are a minority genetically speaking and reflect the vestiges of a once dominant Y-DNA group.

Illustration three provides an example of some of the major branches or subclades (SNP mutations ) of the G haplogroup of which the Y-DNA of Griff(is)(es)(ith) family can be traced. The illustration also indicates the sampled number of variant or equivalent SNPS associated with a particular branch. [40] Illustration three also indicates the approximate date of when the branch occurred (e.g. when a male exhibited a specific the SNP mutation).

Illustration Three: SNP mutations and the Patrilineal Line for Griffis Family

Adapation of Illustration from J David Vance, The Genealogist Guide to Genetic Testing, 2020 , page 23. Click for larger view.

The Griff(is)(ith)(es) patrilineal line is part of the G Haplogroup and part of a major subbranch – the G2a-Haplogroup. A distinctive quality of the G2a-Haplogroup is it now appears at low frequencies across most of Europe, typically between one to ten percent of male lineages, with some notable exceptions. Higher concentrations are found in specific mountainous and isolated regions in Europe. [41]

Haplogroup G was associated with the spread of agriculture in Europe. It originated in West Asia and entered Europe during the Neolithic period. The highest genetic diversity of haplogroup G is in the northern Fertile Crescent, which suggests that this is where it originated. At one point it was the predominant haplogroup in Europe. While the G2a subbranch was once dominant among early European farmers, subsequent migrations and demographic changes have significantly altered its distribution. [42]

My Y-DNA test results indicate my terminal SNP value reflects a branch in the G Haplgroup that was located in an area that we now call Wales. A terminal SNP is the defining SNP (Single Nucleotide Polymorphism) that marks my placement on the most recent known branch of the Y-DNA haplotree. It represents the furthest down the tree branch where a positive result is obtained. [43]

Illustration three depicts the SNP Y-DNA mutation lines of descent from the Haplogroup G-L497 branch of the G-haplogroup to my terminal SNP branch. The illustration indicates the approximate dates of the Most Recent Common Ancestor (tMRCA) associated with each of these specific SNP branches. By viewing the approximate dates of each of the MRCAs for each of the branches, we can vaguely estimate when a Y-DNA ancestor possibly crossed from the European continent to the British Isles.

Illustration Three: Estimating When tMRCA Crossed the English Channel

Source: Estimates for MRCA birth and confidence ranges are from Rob Spencer, SNP Tracker |. Click for Larger View.

My ‘terminal STR’ has been labeled as BY211678 or by FamilyTreeDNA as G-FT40897. [44] As reflected in the following chart, based on tracing the past sequence of SNP mutations, my common Y-DNA ancestors came to the English Isles about 1,050 years before the present. [45]

Chart One: Branches of the G Haplogroup from the G-FGC477 Sub-branch or Subclade

Click for Larger View | Source: Chart D of the FCC477 Branch, G-L497 Y-DNA Project, FamilyTreeDNA

The large encircled area on the above graph represents G – haplogroup branches of Y-700 DNA test results that represent individuals whose ancestors inhabited the contemporary area of Great Britain. Their test results, including mine, can be traced to the most recent common ancestor (tMRCA) that lived around 1300 years before present (ybp). The yellow encircled branch that identifies the Y132505 subclade iis identified because it is the end point in map four below. The third yellow circle shows where my results reside in the context of common ancestors that branch off about 600 years ago – note the different surnames: Williams and Walters.

The following map four is a graphic portrayal of the migratory path of my Y-DNA genetic lineage produced through Globetrekker. Globetrekker is a mapping feature from FamilyTreeDNA for Big Y DNA test customers that traces paternal ancestral migration paths from Y-Adam in Africa (approximately 200,000 years ago) to recent times. The tool combines genetic data with geographical and historical information to map likely migration routes.

The map is generated through the use of software, that estimates geographical ancestor locations and migrations across the world based on the largest database of high-coverage Y-DNA sequences, ancient DNA results from archaeological remains, and user-reported ancestral locations. These are best estimates and will change over time as more people test their Y-DNA and provide information about their paternal line ancestry. [46]

Map Four: The Ancestral Migratory Path of the Griff(is)(ith)(es) Patrilineal Genetic Line

Click for Larger View | Source: Globetrekker, mapping software program from FamilyTreeDNA for Big Y DNA test customers

The general time periods associated with each of the subclades or the Most Recent Common Ancestors (tMRCAs) identified in the map are provided below. The end point of the migration follows subclade G-Y132505 which was referenced in chart one above.

Illustration Four: General Timelines Associated with tMRCAs

Click for Larger View | Source: Globetrekker, mapping software program from FamilyTreeDNA for Big Y DNA test customers

The map and related time frames associated with the Haplogroup subclades associated with my genetic lineage indicate ancestors of the family patrilineal genetic line came to the English Isles around 1000 CE and eventually inhabited an area that is now known as Wales. The analysis of SNP variants associated with my Y-700 DA test results provide strong evidence that my ancestors associated with my patrilineal line of descent lived in the geographical area that is Wales for about 500-600 years prior to the migration to the American Colonies.

A Welsh Connection Through the Analysis of Y-DNA STRs

There are a few STR markers that suggest the Griff(is)es)(ith) genetic line is Welsh. Haplogroup G-P303 (G2a2b2a) is a branch of haplogroup G (M201) that is a few branches pror to the G-L497 branch. This older haplogroup represents the majority of haplogroup G men in most areas of Europe west of Russia and the Black Sea. There are also some short tandem repeat (STR) findings among G-P303 men which help in subgrouping them.

The percentage of haplogroup G among available samples from Wales is overwhelmingly G-P303. Such a high percentage is not found in nearby England, Scotland or Ireland. The STR Marker DYS594=12 subgroup has an unusually high percentage of Welsh surnames with the rest mostly of English ancestry based on available samples. (Red highlighted in Table Three). [47]

Many of the men have an unusual value of 13 for Y-STR marker DYS388 ( I also have a 13 value for this marker which is yellow highlighted in Table Three), and some also have 9 at DYS568 (my value is 11). STR marker oddities are often different in each G-P303 subgroup, and characteristic marker values can vary by subgroup. Often the values of STR markers DYS391, DYS392 and DYS393, are respectively 10, 11 and 14 or some slight variation on these for all G-P303 men (all of these values of these markers I also have which are highlighted in blue in Table Three). [48]

In addition the DYS594 STR marker + 12 is a subgroup that has an unusually high percentage of Welsh surnames and to a lesser number of English ancestry. My value for this marker is 11.

Table 3 : FTDNA Y-111 STR Test Results for James Griffis – Markers 1 – 60

Source: FTDNA Y-DNA Results for Y-111 STR Test | Click for Larger View.

Another piece of evidence which supports the link between the surname and Wales is evidence I obtained from work with a FamilyTreeDNA working work, G-Z6748. Through initial research, the G-Z6748 appears to be a largely Welsh haplogroup.

The Project Administrator of the group produced an interesting map that shows all known Z6748+ participants (and Y-Matches) who have traced their ancestor to a specific town in Wales. As can be seen below in map five, the majority of the group are tracing their ancestors to coastal southern Wales.

Map Five: Locations of Ancestor Origins of Z6748 DNA Testers

Click for Larger View | Source: Research conducted by the FTDNA G-Z6748 Project

A third piece of evidence comes from the analysis of STR clusters between Y-DNA test kits within the Z6748 G subclade. The following Dendrogram [49] is from my analysis of test kits from the G-Z6748 Haplogroup Project. The dendrogram is the result of utilzing an innovative online program created by Rob Spencer that creates a graphic portrayal of data from FamilyTreeDNA. [50]

The dendrogram is similar to a family tree. The individual DNA testers are the dots at the right of the diagram. On a traditional family tree, branch points are ancestors. On the dendrogram branch points are not people but points in time when genetic changes occurred.

Time moves backward to the left. Time is measured in generations which roughly equates to 31 years per generation. I have added how many years before present (ybp) and the approximate year each given generation mark represents. Each Line represents a Y-DNA test kit. The defined haplogroup for each test kit is listed. Depending on the type of D-DNA test completed, some of the haplogroups are very detailed while others are very general. The name of the paternal ancestor that was provided by each individual who completed the Y-DNA test is also listed.. I have also highlighted an area that depicts the range of time where the use of surnames became part of family tradition.

Illustration Five: Dendrogram of Y-DNA Test Kits in the Z6748 Subclade

Click for Larger View | Source: Using FamilyTreeDNA data for the G-Z6748 Subsclade and using the program of Spencer, Rob, Y STR Clustering and Dendrogram Drawing, Dec 2024, https://scaledinnovation.com/gg/clustering.html

The dendrogram graphically reflects the genetic closeness of test kit results that share Y-DNA mutations within the G-Z6748 branch. The Dendrogram shows my test kit (that is highlighted in yellow) and my geneetic relationship with the other test kits. I share a common paternal genetic ancestor with a test kit that has an ancestor named William D. Walters. Our common ancestor lived about 10 generations ago or about 300 years ago – before William’s ancestors immigrated to the colonies. I also share common genetic paternal ancestors with 14 other test kits with a most recent common ancestor that lived around 20 generations ago or about 600 years ago. What is noteworthy with these common paternal genetic ties is the variability of surnames: Walters, Lewis, Rees, Jones, Howard, Harvard and Sapp.

The Use of Research Standards and Methods from Different Disciplines

 All genealogists strive to reconstruct family histories or achieve genealogical goals that reflect historical reality as closely as possible. [51] This general goal and standard requires the adherence to and application of standards for conducting sound, reliable research and utilizing various research methods to obtain and analyze facts and evidence.

Crisis being the twin of opportunity, the field (of genealogy) has accepted the challenge of educating such massive numbers outside any institutional system of education. That exigency has generated a scrutiny of almost all precepts by which families are studied and evidence is analyzed—much of that effort being made by the Board for Certification of Genealogists. The result has been another marked advance in the maturity of the field, beginning with an increased emphasis upon documentation, methodology, and record interpretation—and drawn from the interdisciplinary study of economics, genetics, geography, law, medicine, military and monetary systems, politics, and psychology, as well as all aspects of history.[52]

For me, similar to Elizabeth Mills’ statement above, these ‘standards’ for conducting research and the ‘various methods’ for analyzing genealogical facts and evidence come from various disciplines. In addition to genealogical standards and methods, various fields of social and historical research and journalism have standards and approaches that have influenced my approach in conducting genealogical research.

Each discipline has their unique view and advantages. The standards for various professional organizations essentially require exhaustive research, citation and documentation of sources, analysis and correlation of data, resolution of conflicting evidence, and soundly written conclusions.

My formal research training was in the social sciences. I have acquired a formal and practical understanding and application of various approaches for collecting and analyzing facts and evidence. I have an understanding of how to use various qualitative and quantitative research methodologies to analyze genealogical facts and evidence. [53]

I have also been influenced by social historians that have employed innovative methods that characterized the “new social history” approach that emerged during in the 1970s. Social historians shifted away from studying “great men” and larger historical forces to examine the lives and experiences of ordinary people. This “history from below” approach aimed to reconstruct the perspectives of common people throughout history. [54] Social Historians and professional Genealogists have increasingly documented the benefits of genealogy as a source of historical information and research methods associated with records and archival-research skills. [55]

While my goal is not to obtain professional credentials in the area of genealogical research, I share and utilize many of the standards espoused by organizations that are associated with genealogical research. There are two main organizations in the United States that award credentials to professional genealogists: the International Commission for the Accreditation of Professional Genealogists (ICAPGen℠) and The Board of Certification for Genealogists (BCG). While both credentials demonstrate a high level of genealogical research ability, there are some key differences between the two programs. [56]

Development of Genealogical Standards

Genealogical organizations developed research standards over the last century to improve the quality, reliability, and credibility of genealogical research. As genealogy transitioned from a niche hobby to a massive popular pursuit over the last century, major genealogical organizations developed research standards to maintain ‘rigor and credibility’. [57]

Several key factors drove this evolution.

Increasing Popularity and Accessibility of Genealogy: As interest in genealogy exploded in the 20th century, fueled by more available books, records, and later the Internet, genealogical organizations saw a need for standards to guide the growing ranks of both professional and amateur researchers. Standards would help genealogists, regardless of background, “get their genealogy right” and avoid inaccuracies and myths. [58]

Need for More Rigorous Proof Standards: Genealogists initially borrowed the legal principle of “preponderance of evidence” to justify conclusions. However, it became clear that simply having more evidence for a conclusion was not sufficient for sound genealogical proof. More analysis of the quality of sources and information and resolution of conflicts was needed. Prominent genealogists pushed for “convincing arguments and clearly stated conclusions, including reasoned explanations of any conflicting evidence”. [59]

Cover of American Genealogist

Drive to Improve Genealogy’s Scholarly Reputation: Scholarly genealogy journals in the late 20th century began expecting research articles to demonstrate high standards of evidence and reasoning. Genealogical organizations like the Board for Certification of Genealogists took the lead in defining research standards, publishing the first Genealogical Standards Manual in 2000. The goal was to establish genealogy as a rigorous field of historical research. [60]

Advent of Technology and Big Genealogy Databases: The rise of computerized genealogy databases and Internet genealogy companies in recent decades made standards even more crucial. Genealogists needed to understand the coverage and limitations of these massive but incomplete data sources. Standards provided a basis for evaluating the reliability of database information and online trees. [61]

Current Genealogy Standards

Major genealogical organizations have established research and ethical standards to promote accuracy and credibility in the field. By documenting sources well, sound reasoning, and acknowledging the limits of evidence, genealogists can produce more reliable family histories. [62]

For example: the Board for Certification of Genealogists (BCG) has published “Genealogy Standards” detailing standards for documenting, researching, and writing family histories. The National Genealogical Society (NGS) has also published “Standards for Sound Genealogical Research” outlining best practices.

These standards cover issues like thoroughly documenting sources, analyzing and correlating evidence, resolving conflicts, and accurately reporting findings. They aim to uphold the integrity of the field. 

Some of the notable objectives are:

Original Records and Proper Documentation: Genealogical standards emphasize using original records whenever possible, rather than relying solely on compiled works or online trees. Genealogists are expected to document their sources thoroughly so others can evaluate the evidence.

Transparency and Openness: Standards encourage genealogists to make their research transparent, sharing their sources, analysis, and reasoning. This allows the genealogical community to scrutinize conclusions and keeps researchers accountable.

Citing Sources in Compiled Works: When publishing family histories, genealogists should cite their sources using standard citation formats. Endnotes or footnotes are preferred over simply listing sources at the end. This allows readers to easily connect specific facts to the evidence supporting them.

Separating Facts from Hypotheses: Genealogical writing standards call for clearly distinguishing proven facts from theories or possibilities. Genealogists should explain their reasoning and acknowledge the limits of indirect evidence.

Parting Words

Genealogical research prior to the technological advances of the internet and the increased accessibility of historical data faced several significant challenges despite growing popularity during this period. Research required extensive travel to private and governmental repositories, government county clerks offices, and libraries and archives. Not only was it often cost-prohibitive to travel, the ability to access and transcribe information was challenging and time consuming. Geographic and political boundaries frequently prevented access to crucial records. Researchers had to rely primarily on family oral history and family documents, vital records, city/county directories, church and cemetery records, local newspapers and periodicals.

In the 20th century, most genealogists conducted their research by interviewing relatives and visiting repositories to inquire about their ancestors. Travel to these sites was almost a necessity, but genealogists were often hindered by the geographic (and sometimes political) boundaries in which they lived. Travel out of their region was also cost prohibitive. When they could access original documents, they relied on vital records, city/county directories, and church/cemetery records to reveal new information or provide a clue to a new individual or branch of their family tree. Old newspapers and periodicals could also reveal the socio-economic reasons of an era for migration to, and around, the United States. Additionally, books and journals would inform a genealogist on how to research their roots and organize the data.” [63]

Primary source documents were difficult to access as they were not originally created for genealogical purposes and often lacked proper indexing or organization. Census records had strict access restrictions, requiring approved researchers to conduct their work at National Archives facilities with limited reproduction permissions. [64]

Only wealthy and noble families traditionally maintained detailed documentation of their ancestry.  Record-keeping was inconsistent, and many documents were scattered across multiple locations and not properly indexed or organized [65]

Genealogists faced barriers in technically accessing historical records. Record linkage between censuses was extremely labor-intensive, with researchers having to manually search through microfilmed listings. The Soundex indexing system, while helpful, was organized state-by-state on microfilm, making interstate migrant searches expensive and often unsuccessful. Success rates for tracking individuals between censuses (known as “persisters”) were typically under 40 percent. [66]

The field of genealogy faced skepticism from academic historians, who did not view genealogists as serious researchers until the rise of social history in the late 1960s. This attitude began to shift as social history topics gained popularity, leading to increased interest in genealogical research methods. [67]

The research process was extremely time-consuming. It involved writing and receiving letters from county clerks and other officials if one were limited by travel. A lot of time was spent on manual searching through unindexed records. Typing family histories on typewriters with frequent corrections was the norm. This methodical pace, however, had one advantage – researchers spent more time analyzing each record and understanding its context within the broader historical picture. [68]

The advent of accessible, digital records on the internet, the commercialization of genealogical research data, and the introduction of search capabilities of the digital data have made it much easier to research large amounts of evidence and document our genealogical discoveries.

In this age of all these emerging technologies, genealogists’ information seeking behaviors and needs are evolving and adapting at a greater speed than ever before. Genealogists can locate information relevant to their family search with just a few clicks on a website. They can download and/or purchase digital images of documents such as birth records, cemetery records, and census records. The number of online resources can be overwhelming, and care must be taken to ensure the provenance and authenticity of the information they discover.[69]

While it is easier to find data and evidence, the tedious and hard work associated with critically analyzing all the available data and evidence does not become easier. Research and analysis of evidence becomes more challenging. The results of our research, whether it is meticulous or casually produced, can have more pronounced impact since information travels more freely in the digital era.

This is why the use of genealogical research standards and the understanding of the benefits and limitations of various research methodologies and aproaches to gatehring and analyzing evidence is so important.

Sources

Feature Image: The map was created in 2008 by Mark Tucker as a visualization of the genealogy research process. It is meant as a tool for genealogists and family historians from beginner to professional. It combines concepts from the Board for Certification of Genealogists and the works of professional genealogist, Elizabeth Shown Mills. https://www.familysearch.org/en/wiki/Genealogy_Research_Process_Map

Behind the diagram of the genealogy research process are examples of evidence used in the story..

[1] For additional reading on this subject, see the following references:

Gregory Rodriguez, How Genealogy Became Almost as Popular as Porn, May 30, 2014, Time, https://time.com/133811/how-genealogy-became-almost-as-popular-as-porn/#

Maya Jasanoff, Our Obsession with Ancestry Has Some Twisted Roots, The New Yorker, May 2, 2022, https://www.newyorker.com/magazine/2022/05/09/our-obsession-with-ancestry-has-some-twisted-roots-maud-newton-ancestor-trouble

Rebecca Dalzell, Genealogy: the Second Most Popular Hobby in the US?, April 27, 2017, Ancestry.com Blog, https://blogs.ancestry.com/cm/genealogy-second-most-popular-hobby-us/

Maud Newtown, America’s Ancestry Craze, Harpers, https://harpers.org/archive/2014/06/americas-ancestry-craze/

[2] Andy Lee, Family Fanatics History, Blog, https://www.familyhistoryfanatics.com/genealogy-isnt-that-popular

James Tanner, Hobby Claims about Genealogy are Unfounded, June 4, 2014, Genealology’s Star, Blog, https://genealogysstar.blogspot.com/2015/06/hobby-claims-about-genealogy-are.html

James Tanner, Is Genealogy a hobby or pastime?, 10, 2016, LDS Blogs, https://rejoiceandbeexceedingglad.blogspot.com/2016/11/is-genealogy-hobby-or-pastime.html

How Popular is Genealogy?, Genealogy inTime Magazine, Blog, Page accessed on Jan 7, 2024, http://www.genealogyintime.com/articles/how-popular-is-genealogy-page01.html

Genealogy is NOT the Second Most Popular Hobby in the US https://www.familyhistoryfanatics.com/genealogy-isnt-that-popular

Is Genealogy Growing? http://www.genealogyintime.com/articles/how-popular-is-genealogy-page06.html

Genealogy: the Second Most Popular Hobby in the US? https://blogs.ancestry.com/cm/genealogy-second-most-popular-hobby-us/

Hobby Claims about Genealogy are Unfounded  https://genealogysstar.blogspot.com/2015/06/hobby-claims-about-genealogy-are.html

[3] Hjorthén Adam , Reframing the History of American Genealogy: On the Paradigm of Democratization and the Capitalization of Longing. Genealogy. 2022; 6(1):21. https://doi.org/10.3390/genealogy6010021

[4] Jackson, Chris, Majority of Americans think knowing their ancestry is important, 25 Jun 2021, IPSOS, https://www.ipsos.com/en-us/majority-americans-think-knowing-their-ancestry-important

[5] Scholars have written about the “democratization of genealogical research” (Lenstra 2015, p. 203), a “democratize[d] access to the past” (De Groot 2015, p. 119), “a democratization of sources” for genealogical research (Tucker 2016, p. 165), “a democratic and expanded notion of relatedness” (Creet 2020, p. 168), a “democratic interest in family history” (Weil 2013, p. 181), and “the development of public interest in genealogy could be highlighted as popular, and democratic” (Hering 2009, p. 5)

De Groot, Jerome. 2015. On Genealogy. The Public Historian 37: 102–27.

Tucker, Susan. 2016. City of Remembering: A History of Genealogy in New Orleans. Jackson: University Press of Mississippi.

Creet, Julia. 2020. The Genealogical Sublime. Amherst: University of Massachusetts Press.

Weil, François. 2013. Family Trees: A History of Genealogy in America. Cambridge: Harvard University Press.

Hering, Katharina. 2009. “We Are All Makers of History”: People and Publics in the Practice of Pennsylvania-German Family History, 1891–1966. Ph.D. thesis, George Mason University, Fairfax, VA, USA.

See other writings for example:

Lenstra, Noah , ‘Democratizing ‘ Genealogy and Family Heritage Practices: theView from Urbana, Illinois, In Encounters wth Popular Pasts: Cultural Heritage and Popular Culture, Mike Robinson and Helaine Silverman, eds., NewYork: Springer 2015, Page 203

De Groot, Jerome, On Genealogy, The Public Historian, Volume 37, Issue 3, August 2015, Page  119, https://online.ucpress.edu/tph/article-abstract/37/3/102/89479/International-Federation-for-Public-History?redirectedFrom=fulltext

Tucker, Susan. 2016. City of Remembering: A History of Genealogy in New Orleans. Jackson: University Press of Mississippi, 2016, Page 165

Creet, Julia, The Genealogical Sublime, Amherst: University of Massachusetts Press, 2020, Page 168

Weil, François. 2007. John Farmer and the Making of American Genealogy. New England Quarterly 80. Pages 408–34., Page 181, https://direct.mit.edu/tneq/article-abstract/80/3/408/15801/John-Farmer-and-the-Making-of-American-Genealogy?redirectedFrom=fulltext

Hareven, Tamara, K., The Search for Generational Memoriy: Tribal Rites in Industrial Society. Daedalus, 107, 1978, Pages 137 – 149

Taylor, Robert M. 1982. Summoning the Wandering Tribes: Genealogy and Family Reunions in American History. Journal of Social History 16, Pages 21–35, https://academic.oup.com/jsh/article-abstract/16/2/21/1031592?redirectedFrom=fulltext

Bidlack, Russell E. 1983. Librarians and Genealogical Research. In Ethnic Genealogy: A Research Guide. Edited by Jessie Carney Smith, Westport: Greenwood Press.1983, Page 9

Morgan, Francesca. 2010a. A Noble Pursuit? Bourgeois America’s Uses of Lineage. In The American Bourgeoisie: Distinction and Identity in the Nineteenth Century. Edited by Sven Beckert and Julia Rosenbaum. New York: Palgrave, 2010

[6] I have provided four PDFs of the entire discussion thread since, as the last comment declares, “wow what an….. interesting discussion I’ve stumbled upon“.

PDF One | PDF Two | PDF Three |PDF Four

John Stephen Saponaro, Discussion Thread on John ap Gruffudd (Pengruffwnd) – Wales in April 2020, Gene Collaboration Website, Thread started 14 Feb 2020. Discussion Thread accessed 7 Jan 2022. https://www.geni.com/discussions/208254

Ann Brannen, Discussion Thread on John ap Gruffudd (Pengruffwnd) – Wales in April 2020, Gene Collaboration Website, Thread started 14 Feb 2020. Page 2 of the discussion Ms. Brannen’s post was on 25 Feb 2020 7:55 am, Discussion Thread accessed 7 Jan 2022.

[7] O’Hare, Sheila, Genealogy and History, April 2002, Common Place, https://commonplace.online/article/genealogy-and-history/

[8] Adam Hjorthén, Genealogy from a distance: the media of correspondence and the Mormon church, 1910–45, Historical Research, Volume 94, Issue 263, February 2021, Pages 117–135, https://doi.org/10.1093/hisres/htaa034

[9] Elizabeth Shown Mills, Working with Historical Evidence: Genealogical Principles and Standards, Vol 87, No. 3, Sep 1999, Evidence, A special Issue of the National Genealogical Society Quarterly, Pages 169, https://www.historicpathways.com/download/workwthhistevidence.pdf

[10] See my story: Griffis, Jim, Griff(is)(in)(ith)(iths)(es)(in)(ins)(ing) Surname and American Genealogies: Part One, Feb 17, 2022, Griffis Family: Selected Stories from the Past, https://griffis.org/griffisinththsesininsing-surname-and-american-genealogies-part-one/

[11] Griffith, Laura, The Griffith’s of Wales and America, Self published Mayfield, KY: 1979, reprinted 1982. Page IV,

[12] The Genealogical Proof Standard – International Institute, FamilySearch Wiki, This page was last edited on 27 April 2023, https://www.familysearch.org/en/wiki/The_Genealogical_Proof_Standard_-_International_Institute

Morton, Sunny Jane, The Genealogical Proof Standard: An Expert Explanation for Guiding Your Research, FamilyTree, https://familytreemagazine.com/strategies/genealogical-proof-standard/

Chapter 1: The Genealogical Proof Standard, Family History and Genealogical Research, https://books.byui.edu/fhgen_110_textbook_/chapter_1__the_genealogical_proof_standard

[13] Genealogical Proof Standard, Wikipedia, This page was last edited on 11 November 2024 , https://en.wikipedia.org/wiki/Genealogical_Proof_Standard

Genealogical Proof Standard, FamilySearch Wiki, FamilySearch, This page was last edited on 30 April 2023, https://www.familysearch.org/en/wiki/Genealogical_Proof_Standard

McDermott, Marc, Genealogical Proof Standard, 12 Feb 201 8, updated 11 Oct 2024, GenealogyExplained, https://www.genealogyexplained.com/basics/genealogical-proof-standard/

Stahle, Tyler, Understanding the Genealogical Proof Standard, 9 Mar 2016, FamilySearch Blog, https://www.familysearch.org/en/blog/understanding-the-genealogical-proof-standard

Understanding Genealogical Proof, National genealogical Society, https://www.ngsgenealogy.org/going-to-the-next-level/understanding-genealogical-proof/

[14] Zeno Griffin, Richard Pengruffwnd , New York Genealogical and Biographical Record vol. 37 , 1906. p. 54-55. 

[15] Griffin, Paul, Annotated Bibliography of the Griffin/Griffen Family, Freepages Rootsweb.com, 27 Feb 1995, Revised Dec 1999, page accessed 6 Jun 2015. Paul Griffin provides an excellent bibliography of published and unpublished books, articles or manuscripts about Griffin(th)(ths)(is) families. His genealogical focus concerns the descendants of Edward Griffin purportedly born around 1602 in Wales and his siblings. For a PDF copy of the annotated bibliography click here.

Hugh Lavry,  Edward Griffin (abt. 1602 – abt. 1706), WikiTree.com, Profile last modified 28 Aug 2020, Created 27 Jan 2011, Accessed 12 Dec 2021.

 The Flushing Remonstrance, 1657, Historical Society of the new York Courts, Page accessed 05 Dec 2021

Kristina Wheeler, , Edward Griffin (abt. 1648 – abt. 1742), Wikitree.com, Profile last modified 12 Apr 2019, Created 27 Jan 2011, Accessed 12 Dec 2021.

Susannah (Griffin) Barnett (abt. 1662 – 1742), WikiTree.com, Profile last modified 19 Jun 2020, Created 27 Jan 2011, Accessed 12 Dec 2021.

Hugh Lavry,  Richard Griffin (abt. 1670 – 1723), WikiTree.com, Profile last modified 24 Dec 2017, Created 27 Jan 2011, Accessed 12 Dec 2021.

John Thompson, Deborah Griffin (abt. 1662), Wikitree.com, Profile last modified 1 Jul 2020 | Created 27 Jan 2011, Page accessed 12 Dec 2021.

Theresa Griffin, Debunking the Published Griffin Family Myths: Edward Griffin of Flushing was not Edward Pengruffwnd (Pengriffin) of Walton West, Pembrokeshire, Wales, freepages.rootsweb.com, Page last edited September 2009, page accessed 9 Dec 2021.  For a PDF version of the website citation, provided in the event the website version is discontinued.

Z T Griffen and Rev Duane N Griffin,  Sgt. John Griffin of Simsbury Conn , The New York Genealogical and Biographical Record Vol XLIX No 1 , January 1918, Page 23-26

[16] Theresa Griffin, Debunking the Published Griffin Family Myths: Edward Griffin of Flushing was not Edward Pengruffwnd (Pengriffin) of Walton West, Pembrokeshire, Wales, freepages.rootsweb.com, Page last edited September 2009, page accessed 9 Dec 2021.  For a PDF version of the website citation, provided in the event the website version is discontinued.

[17] Ibid

[18] The three manuscripts are:

The Peets-Griffith manuscript: Mildred Griffith Peets, Griffith Family History in Wales 1485–1635 in America from 1635 Giving Descendants of James Griffis (Griffith) b. 1758 in Huntington, Long Island, New York, compiled by Capitola Griffis Welch, 1972 . PDF copy of the manuscript can be found here.

The Jones-Welch manuscript: Mary Martha Ryan Jones and Capitola Griffis Welch, compiled by, Griffis Sr of Huntington Long Island and Fredericksburg, Canada 1763-1847 and William Griffis Jr, (Reverend William Griffis) 1797-1878 and his descendants. A self published genealogical manuscript, 1969. PDF copy of the manuscript can be found here.

The Hall manuscript: M.K. Hall, Griffith Genealogy: Wales, Flushing, Huntington, Unpublished Manuscript 1929, originally published 1937,  https://archive.org/details/griffithgenealog00hall/page/n3/mode/2up

[19]  See :

Welsh Surnames, Genealogy Today, Page accessed 1 November 2021.

John and Shiela Rowlands, The Surnames of Wales: For Family Historians and Others, Baltimore, MD: Genealogical Publishing Co. 1966

John and Shiela Rowlands, ed, Stages in Researching Welsh Ancestry. England: The Federation of Family History Societies Publications Ltd., 1999

John Davies; Nigel Jenkins; Menna Baines; Peredur I. Lynch, eds. (2008). The Welsh Academy Encyclopedia of Wales. Cardiff: University of Wales Press. p. 838.

Welsh Surnames, Wikipedia, Page edited 3 Oct 2021, page accessed 9 Dec 2021

Wales Personal Names, FamilySearch.org , this page was last edited on 17 August 2021, page was accessed 7 Jan 2022.

Craig L. Foster, Welsh Naming Patterns, FamilySearch.org, 2015, PDF accessed 12 Dec 2021 

Ben Johnson, The History of Welsh SurnamesHistoric UK: The History and Heritage Accommodation Guide, page accessed 11 Nov 2021 

Welsh Surnames: Why are there so many Joneses in Wales?, Amgueddfa Cymru — National Museum Wales, page accessed 9 Sep 2021 

Tamie Dehler, Before fixed surnames, Welsh followed a Celtic naming system, Tribunte-Star: Terre Haute and Wabash Valley, Nov 28, 2010 Updated Aug 6, 2014, page accessed 20 Nov, 2021 

Donald Moore, The Indexing of Welsh Names, The Indexer, Volume 17, Number 1, April 1990, accessed 06 Apr 2020 

Welsh Patronymics Group Project, FamilyTreeDNA

Rowlands, Shiela, The Surnames of Wales, Chapter 7, in John & Shiela Rolands, Welsh Family History: A Guide to Research, Second Edition, Baltimore: Genealogical Publishing Company, 1998, page 62

Shiela Rowlands, Sources of Surnames in John and Shiela Rowlands, ed, Stages in Researching Welsh Ancestry. Bury, England: The Federation of Family History Societies Publications Ltd., 1999. Pages 153 and 159

Durie, Bruce, Welsh Genealogy, Stroud, United Kingdom: The History Press, 2013, Page 27

John Rowlands, The Homes of Surnames in Wales, in John and Shiela Rowlands, ed, Stages in Researching Welsh Ancestry. Bury, England: The Federation of Family History Societies Publications Ltd., 1999. Page 162-164

John and Sheila Rowlands, The Use of Surnames, Chapter 4, Patronymic Naming – A survey in Transition, Llandysul, Ceredigion: Gomer Press, 2013, Pages 50-57

[20] Griffis, Jim, Part Three: How Do You Spell Griffis?, April 2, 2022, Griffis Family: Selected Stories from the Past , https://griffis.org/part-three-how-do-you-spell-griffis/

[21] 1799 New YorkTax Assessment Rolls of Real and Personal Estates, 1799 – 1804, Suffolk County, 1801, Huntington, Image 8, Lines 30, 31 and 37.

Data source: New York State Archives, Ancestry.com. New York, U.S., Tax Assessment Rolls of Real and Personal Estates, 1799-1804 [database on-line]. Provo, UT, USA: Ancestry.com Operations, Inc., 2014. Original data: New York (State), Comptroller’s Office. Tax Assessment Rolls of Real and Personal Estates, 1799–1804. Series B0950 (26 reels). Microfilm. New York State Archives, Albany, New York.

[22] Correlation tools verify the accuracy of information by comparing details across different sources and identifying consistent patterns to confirm family relationships.

Some of the common methods or tools are: 

  • Comparison tables: Creating tables to directly compare information like names, birth dates, marriage dates, and locations from multiple records side-by-side. 
  • Timelines: Visualizing events in chronological order to identify potential connections between individuals based on their life stages and locations. 
  • Maps: Using geographical information to pinpoint locations mentioned in records and see if they align with known family patterns. 
  • Cluster research: Identifying associated individuals (neighbors, friends) around a potential ancestor to gather more context and potentially uncover missing information.

The problem is that in genealogy, we are not always handed a 100% match, there are discrepancies concerning a person’s facts in the sources we collect. Sometimes there are larger discrepancies, such as of three major pieces of information in a genealogical profile: names, dates, and location. Individuals may have used a certain alias or alternated one of their given names as their first name. Dates are even shakier because our ancestors may not correctly remember the birth date. They may also enact leniency on their true age, so they state they are younger than they actually are. Of these, the one part of our ancestor’s profile that is the most important is the location. Our ancestors could not clone themselves, so while they could change the facts about their life to assume a new identity, it’s very hard to discredit evidence concerning location.”

Fletcher, Jake, Is it a Match: Ways to Correlate Evidence and Identify Ancestors, 15 May 2016, Legacy Family Tree Software, https://legacyfamilytree.com/blog/2016/05/is-it-a-match-ways-to-correlate-evidence-and-identify-ancestors/

Jones, Thomas, Using “Correlation” to Reveal Facts that No Record States, 2012, FamilySearch, https://cms-b-assets.familysearch.org/4b/71/a2f6de0e0aa0b1347419c72020d7/course-handout.pdf

[23] The story is attributed to Albert Buffet Griffith (18 Sep 1826 Huntington NY – 24 Mar 1901 Huntington NY). His lineage in the Griffis(th) family reflects the changes in the spelling of the surname. His father was Peter Griffith (1792 Huntington NY – 1864 Huntington NY), his grandfather was James William Griffis (04 Jun 1758 Suffolk Co – 21 Nov 1838 Suffolk Co) and his great grandfather was William Griffis.

See: The Jones-Welch manuscript: Mary Martha Ryan Jones and Capitola Griffis Welch, compiled by, Griffis Sr of Huntington Long Island and Fredericksburg, Canada 1763-1847 and William Griffis Jr, (Reverend William Griffis) 1797-1878 and his descendants. A self published genealogical manuscript, 1969. PDF copy of the manuscript can be found here.

[24] Griffis, Jim, Recent Discoveries from Oral History Compiled by a Local Mayfield Historian – Part I, 28 Mar 2024, Griffis Family: Selected Stories from the Past, https://griffis.org/recent-discoveries-from-oral-history-compiled-by-a-local-mayfield-historian-part-i/

[25] The following is the first page Rulifson’s notes:

[26] Ibid

[27] See: John Rowlands, The Homes of Surnames in Wales in John Rowlands and Shiela Rowlands, ed, Stages in Researching Welsh Ancestry. Bury, England: The Federation of Family History Societies Publications Ltd., 1999. Page 162

[28] Distribution of Griffith and Griffiths Head of Households by Welsh County 1881

CountySur-
name
Griff-
ith/iths
Sur-
name
Rank
of top
300 sur-
Names /
County
Number
of House-
holds in
county
Percentage of
Griffith and
Griffiths
Households
Across
Counties
Percentage of
Griffiths
Households
Across
Counties
Angleseyith14th7222.4 %
iths000
Brecknockith175th243.2%
iths12th9373.9%
Caernarfonith10th295415.7%
iths12th16977.1%
Cardiganith70th254.6%
iths13th13305.6%
Carmarthenith73rd7810.0%
iths8th284211.9%
Denbighith30th2756.8%
iths10th17267.2%
Flinshireith64th1065.8%
iths9th16266.8%
Glamorganith66th64027.0%
iths10th736230.7
Merionethith19th6182.7%
iths12th7873.3%
Monmouthith005.4%
iths19th16056.7%
Montgomeryith84th764.0%
iths14th10957.9
Penbrokeith84th11010.4%
iths6th297412.4
Data from Rob Spencer, Britain and Ireland SNP and Surname Mapper, http://scaledinnovation.com/gg/biMapper.html

[29] See Griffis, Jim, Y-DNA and the Griffis Paternal Line – Part One, 26 Sep 2022, Griffis Family: Selected Stories from the Past, https://griffis.org/y-dna-and-the-griffis-paternal-line-part-one/

[30] Things that DNA tests cannot do:

Y-DNA tests can not tell you if your paternal line was from a particular culture or tribe, or some other group in the past.  If based on the results of your DNA test you connect with another person in a Y-DNA project who had documentation of this knowledge, then indirectly the DNA test can provide leads to document this specific fact. One does not learn about this information through Y-DNA.  Certain genetic configurations of designated markers of Y-DNA have been found in human remains in areas inhabited by specific ancient cultures. The results of various studies indicate that specific Y-DNA spread historically in general geographic areas at certain, general time periods.  The mapping of ancient DNA distributions are more precise in the last ten years but as to whether one’s ancestors spent time among a particular culture is completely unknown.  Current knowledge reflects that we do not know where all the Y-DNA mutations started.  We have an idea of what cultures certain Y-DNA may have traveled with but that does not mean anyone’s specific ancestors traveled with them and did not travel with another culture.  

DNA tests per se can not break brick walls encountered in ancestry research. DNA tests can help to break through brick wall but only with help. Typically the test results will facilitate finding other individuals with knowledge or documentation that helps you break through your own brick wall because they knew something farther back that you did, or you put your two sets of knowledge together and you find discoveries based on common ancestors. 

Y-DNA tests can not identify specific ancestors or where they lived.  The original, geographical locations and names of ancestors can be determined through traditional historical sources based on genetic lines that may be discovered. 

Y-DNA tests can not identify the exact generation of a common ancestor with supporting data. Age estimation of a common ancestor has a large margin of error and is a topic of contention among DNA companies and scientists. 

[31] The best Y-DNA tests at the time of my testing was from FamilyTreeDNA (FTDNA). They are the only company of to offer dedicated Y testing and the only company that provides matching capabilities based on other testers who may post gnealological trees with supporting information. FamilyTreeDNA offers three levels of Y-DNA STR testing: Y-37, Y-111, and Big Y-700 (Big Y also tests SNPs). The numbers refer to how many DNA markers the test examines. The more markers, the more useful the results will be. They also have the largest population of Y-DNA testers.

See: Y-DNA SNP testing chart, Y-DNA SNP testing chart, Y-DNA STR testing comparison chart, International Society of Genetic Genealogy Wiki, This page was last edited on 16 February 2022, page accessed 20 Feb 2022, https://isogg.org/wiki/Y-DNA_SNP_testing_chart

Y-DNA STR testing comparison chart, International Society of Genetic Genealogy Wiki, This page was last edited on 11 July 2022, https://isogg.org/wiki/Y-DNA_STR_testing_comparison_chart

Marc McDermott, Best Y-DNA Test: Everything you need to know about Y-DNA testing for genealogy, 17 Nov 2021, smarterhobby.comhttps://www.smarterhobby.com/genealogy/best-y-dna-test/

Genealogical DNA Test, Wikipedia, This page was last edited on 11 August 2022, page accessed 12 Aug 2022,https://en.wikipedia.org/wiki/Genealogical_DNA_test

Diahan Southard, What’s the Big Y-700 Test? Should I Choose a Y-DNA Test?, Family Tree Magazine, Jan / Feb/ 2018, https://familytreemagazine.com/dna/big-y-700/

Y-chromosome DNA (Y-DNA),FamilyTreeDNA Help Center, Page accessed 14 Aug 2022, https://help.familytreedna.com/hc/en-us/articles/4414463886351-Y-chromosome-DNA-Y-DNA-#y-dna-snps-0-0

2020 Review Of Big Y, FamilyTreeDNA Blog, 1 Feb 2021, https://blog.familytreedna.com/2020-review-of-big-y/

Big Y-700 Tests: Any advice for advanced analysis of results?, WikiTree G2G, 19 Apr 2021, https://www.wikitree.com/g2g/1223388/big-y-700-tests-any-advice-for-advanced-analysis-of-results

Big Y, FamilyTreeDNA Blog, not dated, https://blog.familytreedna.com/wp-content/uploads/2021/05/big-y.pdf

2019 Review Of Big Y, FamilyTree DNA Blog, 27 Dec 2019, https://blog.familytreedna.com/2019-review-of-big-y/

Roberta Estes Y-700: The Forefront of Y Chromosome Testing, 7 Jun 2017, FamilyTree DNA Blog, https://blog.familytreedna.com/human-y-chromosome-testing-milestones/

Roberta Estes, FamilyTree DNA Blog, Why Big Y-700? 21 Oct 2022, https://blog.familytreedna.com/why-big-y-700/

[32] J. David Vance, DNA Concepts for Genealogy: Y-DNA Testing Part 1, 10 Oct 2019, https://youtu.be/RqSN1A44lYU  Part 1 of a 3-part introduction series to Y-DNA for genealogists. This first video focuses on “Why?” use Y-DNA for genealogy – what benefits does it offer and why should genealogists consider using Y-DNA as part of their research?

J. David Vance, DNA Concepts for Genealogy: Y-DNA Testing Part 2, 3 Oct 2019 https://www.youtube.com/watch?v=mhBYXD7XufI&t=355s  Part 2 of a 3-part introduction series to Y-DNA for genealogists. This second video focuses on “What?” for Y-DNA for genealogy – what are STRs and SNPs, what is genetic distance, what is the haplotree, and other related questions

J. David Vance, DNA Concepts for Genealogy: Y-DNA Testing Part 3, 10 Oct 2019  https://www.youtube.com/watch?v=03hRXVg9i1k&t=4sPart 3 of a 3-part introduction series to Y-DNA for genealogists. This third video focuses on “How?” for Y-DNA for genealogy – how do I use the information provided by Y-DNA tests to advance my genealogy and/or my lineages?

J David Vance, The Genealogist Guide to Genetic Testing, 2020 https://www.amazon.com/Genealogists-Guide-Testing-Genetic-Genealogy/dp/B085HQXF4Z/ref=tmm_pap_swatch_0?_encoding=UTF8&qid=&sr=

Michael Hébert, Y-DNA Testing Company STR Marker Comparison Chart,  Last updated on January 08, 2012http://www.gendna.net/ydnacomp.htm

Estes, Roberta, Y DNA: Part 1 – Overview, 2 Jan 2020, DNAeXplained, https://dna-explained.com/2020/01/02/y-dna-part-1-overview/

Roberta Estes,  Working with Y DNA – Your Dad’s Story, FamilyTree DNA Blog. 5 Jun 2017, https://dna-explained.com/2017/06/05/working-with-y-dna-your-dads-story/

Roberta Estes, STRs vs SNPs, Multiple DNA Personalities, DNAeXplained – Genetic Genealogy, 10 Feb 2014https://dna-explained.com/2014/02/10/strs-vs-snps-multiple-dna-personalities/

Y chromosome DNA tests, International Society of Genetic Genealogy Wiki, This page was last edited on 6 September 2024, https://isogg.org/wiki/Y_chromosome_DNA_tests

[33] Chris Gunter, Single Nucleotide Polymorphisms (SNPS), 10 May 2022, National Human Genome Research Institute, https://www.genome.gov/genetics-glossary/Single-Nucleotide-Polymorphisms

What are single nucleotide polymorphisms (SNPs)?, MedlinePlus, National Library of Medicine, https://medlineplus.gov/genetics/understanding/genomicresearch/snp/

Single-nucleotide polymorphism, Wikipedia, page was last edited on 11 November 2022, https://en.wikipedia.org/wiki/Single-nucleotide_polymorphism

SNP’s, Genetics Generation, https://knowgenetics.org/snps/

Making SNPs Make sense, Learn Genetics, Genetic Science Learning Center, https://learn.genetics.utah.edu/content/precision/snips

[34] STRs vs SNPs, Multiple DNA Personalities, DNAeXplained – Genetic Genealogy, 10 Feb 2014, https://dna-explained.com/2014/02/10/strs-vs-snps-multiple-dna-personalities/

STR Analysis, Wikipedia, page was last edited 25 Oct 2022, https://en.wikipedia.org/wiki/STR_analysis

Microsatellite, Wikipedia, page was last edited 25 Oct 2022, https://en.wikipedia.org/wiki/Microsatellite

Terry Taylor, What is STR Analysis?, 2 Mar 2011, This article appeared in NIJ Journal Issue 267, March 2011, as a sidebar to the article Extending the Time to Collect DNA in Sexual Assault Cases by Terry Taylor.

Has Fan, Jai-You Chu, A Brief Review of Short Tandem Repeat Mutation, Genomics Proteomics Bioinformatics. 2007; 5(1): 7–14. Published online 2007 Jun 15. doi: 10.1016/S1672-0229(07)60009-6

Short Tandem Repeat, International Society of Genetic Genealology Wiki, page was last edited on 31 January 2017, https://isogg.org/wiki/Short_tandem_repeat

Michael Hébert, Y-DNA Testing Company STR Marker Comparison Chart,  Last updated on January 08, 2012http://www.gendna.net/ydnacomp.htm

Kayser et al. (2004), A Comprehensive Survey of Human Y-Chromosomal Microsatellites Am. J. Hum. Genet., 74 1183-1197. NB online only data file

Krahn, Thomas. “Y-STR fingerprint – Panels” (PDF). Price List DNA-Fingerprint – Genealogy Testing Services. Retrieved 11 August 2012.

Butler, John M. (9 January 2012). “Y-Chromosome STRs”Short Tandem Repeat DNA. NIST Standard Reference Database SRD 130. Retrieved 11 August 2012.

Butler, John; Kline, Decker (2009-06-29). “Summary List of Y Chromosome STR Loci and Available Fact Sheets”. NIST Standard Reference Database SRD 130. Retrieved 11 August 2012. 

State of the Y-Chromosome for Human Identity Testing: John Butler talk at Canadian Forensic DNA Technology Workshop (June 8, 2005)

Y STR Positions along Y Chromosome, STRBase (SRD-130) National Institute of Standards and technology,, U.S. Department of Commerce, https://strbase.nist.gov//ystrpos1.htm

Y-STR Reference Bibliography, STRBase (SRD-130) National Institute of Standards and technology, U.S. Department of Commerce, https://strbase.nist.gov//ystr_ref.htm

SNP-based age analysis methodology: a summary, Summarised description of the age analysis pipeline — Iain McDonald, June 2017, https://www.jb.man.ac.uk/~mcdonald//genetics/pipeline-summary.pdf

Albers PK, McVean G (2020) Dating genomic variants and shared ancestry in population-scale sequencing data. PLoS Biol 18(1): e3000586. https://doi.org/10.1371/journal.pbio.3000586

National Library of Medicine, Genetics, What are single nucleotide polymorphisms (SNPs)? Page accessed 1 Oct 2022, https://medlineplus.gov/genetics/understanding/genomicresearch/snp/

[35] Jim Griffis, Y-DNA and the Griffis Paternal Line Part Three: The One-Two Punch of Using SNPs and STRs, February 23, 2023, Griffis Family: Selected Stories from the Past, https://griffis.org/y-dna-and-the-griffis-paternal-line-part-three-the-one-two-punch-of-using-snps-and-strs/

[36] Rob Spencer, STR Clades, Tracking Back: a website for genetic genealogy tools, experimentation, and discussion, http://scaledinnovation.com/gg/gg.html?rr=strclades

[37 Rob Spencer, The Big Picture of Y STR Patterns, The 14th International Conference on Genetic Genealogy, Houston, TX March 22-24, 2019,  http://scaledinnovation.com/gg/ext/RWS-Houston-2019-WideAngleView.pdf Page 11

[38] Y-SNP & Y-STR Tools Used in Y-DNA Research:

STR / SNP ToolCreatorDescription
SNP TrackerSpencerCreates a map based on SNP data which traces paternal line from human origins 
Britain & Ireland SNP & Surname MapperSpencerBased on Surname or SNP input, provides historic British census countywide data and maps
Y STR Clustering and Dendrogram DrawingSpencerGenerate circular/ linear dendrograms from FTDNA data. The tool provides quick and incisive graphic depictions of relationships between test kits on STR values and genetic distance.
FTDNA Admin UtilitiesSpencerSNP Breadcrumbs; Find Common Ancestor;  Export Tree Text; ISOGG Y-SNP Synonyms; 
Still Another Phylogeny Program SAPPVanceImport Y-STR and Y-SNP data to create phylogenetic tree. This is a great program to use in conjunction with SNP results that group test results in a major SNP rant. The tool can then map out possible lines between testers based on STR values.
Y-DNA Matches FTDNALists Matches based on Y 12, 25, 37, 67, 111, and Big Y 700 STR tests
Y-DNA Haplotree FTDNALists haplotree based on confirmed terminal haplogroup, lists all SNPs tested positive or presumed positive
Y-STR ResultsFTDNALists the specific test results for Y-111 and Big Y 700 STR tests
Big Y BlockTM TreeFTDNAA vertical-block visual diagram of Y-DNA haplotree showing Big Y testers. This tool helps you visualize how the paternal lineages are related to each other. Also provides Paternal Countries of Origin and other information.
Haplogroup StoryFTDNAPart of FamilyTreeDNA Discover™ series reports. Based on SNP input, provides estimated time of when haplogroup was born. when did your paternal ancestor live and where are his descendants found today.
FTDNATiP™ ReportFTDNAProvides Genetic Distance estimates for potential Y-DNA STR matches

[39] The term “haplotype” refers to the inheritance of a cluster of single nucleotide polymorphisms (SNPs), which are variations at single positions in the DNA sequence among individuals.

A modal haplotype is the most commonly occurring haplotype (a set of STR marker values) derived from the DNA test results of a specific group of people. The modal haplotype does not necessarily correspond with the ancestral haplotype – the haplotype of the most recent common ancestor.

Biesecker, Leslie, Haplotype, National Institute of Human Genome Research Institute, https://www.genome.gov/genetics-glossary/haplotype

Haplotype, Wikipedia, This page was last edited on 19 September 2024, https://en.wikipedia.org/wiki/Haplotype

Genotyping: Terms to know, Integrated DNA Technologies, https://www.idtdna.com/pages/education/decoded/article/genotyping-terms-to-know

Haplotypes: a cut-out-and-keep guide, 12 Mar 2021, Genomics Education Programme, https://www.genomicseducation.hee.nhs.uk/blog/haplotypes-a-cut-out-and-keep-guide/

A haplotree is a branching diagram that shows evolutionary relationships between biological species based on their genetic characteristics. It represents the genetic journey of human populations and illustrates how different groups are related through common ancestors. Each branch represents thousands or tens of thousands of years of genetic changes, helping identify deep ancestral origins.

The Y-DNA haplotree is a phylogenetic tree that represents the evolutionary relationships and genetic diversity of human Y chromosomes. It is a branching diagram that looks like a family tree that shows the inferred evolutionary connections among different Y-DNA haplogroups, which are defined by specific mutations in the SNP portions of the male-specific Y chromosome.

Haplogroups are named using a system developed by the Y Chromosome Consortium (YCC), which uses a combination of letters, numbers, and SNP (Single Nucleotide Polymorphism) markers.

FamilyTreeDNA, in collaboration with the National Geographic Genographic Project, has created one of the largest and most comprehensive Y-DNA haplotrees. This tree is continuously updated as new SNPs are discovered through advanced testing methods like Big Y DNA test, allowing for increasingly detailed branching and more precise placement of individuals within the tree.

See:

Human Y-chromosome DNA haplogroup, Wikipedia, This page was last edited on 5 October 2024, https://en.wikipedia.org/wiki/Human_Y-chromosome_DNA_haplogroup

Y chromosome DNA haplogroup, International Society of Genetic Genealogy, This page was last edited on 1 July 2021, https://isogg.org/wiki/Y_chromosome_DNA_haplogroup

Y-DNA Haplogroup Tree 2019-2020, International Society of Genetic Genealogy, Version: 15.73   Date: 11 July 2020, https://isogg.org/tree/

Estes, Roberta, Family Tree DNA’s PUBLIC Y DNA Haplotree, 27 Sep 2018, DNAeXplained, https://dna-explained.com/2018/09/27/family-tree-dnas-public-y-dna-haplotree/

[40] For a list of all the equivalent SNPs in the Griff(is)(es)(ith) line, see Jim Griffis, Y-DNA and the Griffis Paternal Line Part Three: The One-Two Punch of Using SNPs and STRs, February 23, 2023, Footnote [18] , https://griffis.org/y-dna-and-the-griffis-paternal-line-part-three-the-one-two-punch-of-using-snps-and-strs/

[41] The decline of G2a’s dominance occurred through multiple replacements. Local hunter-gatherers carrying the I2 haplogroup genetic line first replaced many G2a lineages, likely through violent takeover of agricultural societies. The most significant replacement came with Indo-European expansions, primarily through the R1a haplogroup becoming prevalent in Eastern Europe and parts of Scandinavia; and the R1b haplogroup becoming dominant in Western Europe.

Hay, Maciamo, Haplogroup G2a (Y-DNA) Jul 2023, Eupedia, https://www.eupedia.com/europe/Haplogroup_G2a_Y-DNA.shtml

Genetic history of Europe, Wilkpedia, This page was last edited on 8 December 2024, https://en.wikipedia.org/wiki/Genetic_history_of_Europe

A 2022 study on the effect of Y chromosome variation on coronary artery disease and mortality in the United Kingdom documented the fact that the G Haplogroup is a minority Y-Haplogroup in Great Britain. The study gathered data on males from 90 haplogroups to conduct the study.

The following Map reflects the density of representation of the G P15 haplogroup, of which the Griffis family paternal line descends from. It documents the presence of the G haplogroup in the southern region of Wales.

Click for larger View

Timmers, Paul R.H.L and James F Wilson, Limited Effect of Y Chromosome Variation on Coronary Artery Disease and Mortality in the UK Biobank – Brief Report,Arteriosclerosis,Thrombosis, and Vascular Biology, Vol 42, No 9, https://doi.org/10.1161/ATVBAHA.122.317664

[42] The G2a population was severely reduced during the Indo-European expansions, particularly in northern Europe. The decimation was so thorough that modern Neolithic G2a clades or sub-branches now represent only a tiny fraction of G2a lineages in northern Europe.

Hay, Maciamo, Haplogroup G2a (Y-DNA) Jul 2023, Eupedia, https://www.eupedia.com/europe/Haplogroup_G2a_Y-DNA.shtml

Genetic history of Europe, Wilkpedia, This page was last edited on 8 December 2024, https://en.wikipedia.org/wiki/Genetic_history_of_Europe

[43] Estes, Roberta, Glossary – Terminal SNP, 29 Nov 2017, DNAeXplained, https://dna-explained.com/2017/11/29/glossary-terminal-snp/

Y-DNA project help, International Society of Genetic Genealogy Wiki, This page was last edited on 28 October 2022, https://isogg.org/wiki/Y-DNA_project_help

Let’s All Start Using Terminal SNP Labels Instead of Y Haplogroup Subclade Names, Okay?, 20 Sep 2012, Your Genetic Genealogist, http://www.yourgeneticgenealogist.com/2012/09/lets-all-start-using-terminal-snp.html

[44] Terminal SNPs can have different names across platforms because the lab or entity that discovers a SNP gets naming rights, leading to multiple naming conventions. This has resulted in a situation where the same SNP mutation can have several different names.

Each testing company or research organization uses their own prefix when naming newly discovered SNPs. For example:

  • FTDNA uses their own naming convention
  • YFull names SNPs from their interpretation of BAM files
  • Other labs and organizations use their own prefixes.

Sometimes a single SNP mutation is discovered and named by multiple entities around the same time, resulting in dual naming. While some organizations list all equivalent SNP names, FTDNA typically selects just one name to represent the branch on their tree.

Estes, Roberta, Haplogroups, SNPs and Family Group Confusion, 23 Jun 2014, DNAeXplained-Genetic Genealogy, https://dna-explained.com/2014/06/23/haplogroups-snps-and-family-group-confusion/

Estes, Roberta, New Y DNA Haplogroup Naming Convention, 31 Mar 2013, DNAeXplained – Genetic Genealogy, https://dna-explained.com/2013/03/31/new-y-dna-haplogroup-naming-convention/

YFull Tutorial, https://www.yfull.com/tutorial/

[45] The Chart was developed by the FamilyTreeDNA based G-L497 working group. The project includes men with the L497 SNP mutation or reliably predicted to be G-L497+ on the basis of certain STR marker values. The primary goal of the project is to identify new subgroups of haplogroup G-L497 which will provide better focus to the migration history of haplogroup G-L497 ancestors.

[46] Globetrekker is a mapping feature from FamilyTreeDNA for Big Y DNA test customers that traces paternal ancestral migration paths from Y-Adam in Africa (approximately 200,000 years ago) to recent times. The tool combines genetic data with geographical and historical information to map likely migration routes. The system continues to expand, with over 1,000 new migration paths added since its launch in July 2023, bringing the total to more than 49,000 unique paths.

Estes, Roberta, Globetrekker – A New Feature for Big Y Customers From FamilyTreeDNA, 4 Aug 2023, DNAeXplained – Genetic Genealogy, https://dna-explained.com/2023/08/04/globetrekker-a-new-feature-for-big-y-customers-from-familytreedna/

Runfeldt, Goran, Globetrekker, Part 1: A New FamilyTreeDNA Discover™ Report That Puts Big Y on the Map, 31 Jul 2023, FamilyTreeDNA Blog, https://blog.familytreedna.com/globetrekker-discover-report/

Globetrekker, Part 2: Advancing the Science of Phylogeography, 15 Aug, 2013, FamilyTreeDNA Blog, https://blog.familytreedna.com/globetrekker-analysis/

Vilar, Miguel, Globetrekker, Part 3: We Are Making History, 26 Sep 2023, FamilyTreeDNA Blog, https://blog.familytreedna.com/globetrekker-history/

[47] Haplogroup G-P303, Wikipedia, This page was last edited on 30 August 2022, https://en.wikipedia.org/wiki/Haplogroup_G-P303

[48] Ibid

[49] A dendrogram is a tree-like diagram that visualizes hierarchical relationships between objects or data points. It consists of branches (called clades) that stack and break down into smaller branches, with individual elements at the lowest level.

[50] Spencer, Rob, Y STR Clustering and Dendrogram Drawing, Dec 2024,  https://scaledinnovation.com/gg/clustering.html 

[51] First sentence of Chapter One, Board for Certification of Genealogists, Genealogy Standards Nashville: Turner Publishing Co., 2021

[52] Elizabeth Shown Mills, Working with Historical Evidence: Genealogical Principles and Standards, Vol 87, No. 3, Sep 1999, Evidence, A special Issue of the National Genealogical Society Quarterly, Pages 169, https://www.historicpathways.com/download/workwthhistevidence.pdf

[53] The social sciences do have research standards, especially regarding research ethics and understanding the advantages and limitations of using various approaches to gathering information and interpreting research results. These standards are more decentralized across different disciplines and professional bodies compared to the standards in genealogy. Social science standards also tend to be more provisional and debated as the fields grapple with issues of reliability and transparency.

Major social science disciplines have professional associations that establish ethical guidelines and best practices for research and teaching. For example:

  • The American Psychological Association (APA) has an Ethics Code that sets standards for psychologists.
  • The American Sociological Association (ASA) has a Code of Ethics outlining professional responsibilities for sociologists.
  • The American Anthropological Association (AAA) has a Code of Ethics and Principles of Professional Responsibility.

These ethics codes cover issues like protecting research participants, avoiding discrimination, maintaining confidentiality, and representing findings accurately. They aim to uphold the integrity of the disciplines.

If we look at the social sciences as professional organizations, what is firmly grounded in the social sciences is the provision of research training: how to conduct research and how to document research. Universities and colleges become their ‘gatekeepers’ for training prospective members of their organization. Each social science discipline has basic formal core courses in undergraduate and graduate studies in qualitative and quantitative research methods, theory, statistics, and other areas pertinent to each social science discipline.

Social scientists are expected to use rigorous, systematic methods in their data collection, research, and analysis. Quantitative research should follow established statistical practices. Qualitative research should be conducted according to methodological standards for interviews, ethnography and content analysis. There are also general goals for transparency in social science research: making data, materials, and analysis code publicly available to allow others to scrutinize and reproduce findings.

As in other academic fields, social scientists submit their research to peer-reviewed journals, where other experts evaluate the work before publication. Peer review is seen as essential for maintaining standards. Many social scientists also believe findings need to be replicated by other researchers before being considered conclusive. Replication helps guard against false positives and ensures results are reliable. Historically, replication attempts have been relatively rare compared to original studies.

Social scientists use various methods to ensure the accuracy and reliability of their research findings. Social scientists carefully design their studies to minimize potential sources of bias or error. Each social science discipline has established methodological standards and best practices that researchers are expected to follow. This involves:

  • Well-designed studies to provide a strong foundation for accurate results.;
  • Clearly defining the research question and hypotheses;
  • Selecting appropriate sampling methods to ensure the sample is representative of the population of interest;
  • Choosing reliable and valid measurement instruments;
  • Using control groups and randomization in experiments to isolate causal effects; and
  • Collecting data systematically and consistently.

American Sociological Association, Code of Ethics and Policies and Procedures of the ASA Committee on Professional Ethics, Washington: American Sociological Association, 208, 

https://www.asanet.org/wp-content/uploads/savvy/images/asa/docs/pdf/CodeofEthics.pdf

Quick Style Guide, Washington: American Sociological Association 2007,  http://www.asanet.org/students/Quick%20Style%20guide.pdf 

American Educational Research Association, Standards for Reporting on Empirical Social Science Research in AERA Publications,  Educational Researcher, Vol. 35, No. 6, August / September, 2006,  pp. 33–40, https://www.aera.net/Portals/38/docs/12ERv35n6_Standard4Report%20.pdf

American Anthropological Association Policies, https://americananthro.org/about/policies/

APA-approved standards and guidelines, American Psychological Association, https://www.apa.org/research-practice/standards-guidelines

American Economic Association, Best Practices for Economists, https://www.aeaweb.org/resources/best-practices

[54] Historical analysis and methods refer to the techniques and guidelines historians use to research and interpret the past. For historians, the goal is to construct an accurate and reliable account of past events by critically examining and synthesizing evidence from primary and secondary sources.

History is fundamentally about making arguments and interpretations based on the available evidence. Historians situate their arguments within existing scholarship, linking their new interpretations to previous work while noting how new evidence may require revising past narratives.

Well-supported historical arguments consider counter-evidence, multiple causation, and avoid unsupported speculation. Historians explicitly distinguish between opinion and hypotheses grounded in evidence. Historical analysis and methods are the tools historians use to rigorously examine the past and construct meaningful, evidence-based interpretations. It is a complex process requiring research skills, critical analysis, and argumentation to produce works that deepen our understanding of history.

With the risk of over simplification, historians rely on two main types of sources:

  • Primary sources are direct evidence from the time period being studied, such as letters, diaries, artifacts, or eyewitness accounts.
  • Secondary sources are created later by someone who did not experience the events firsthand, such as scholarly books and articles.

Historians must carefully assess the credibility and biases of each source. After collecting evidence, historians analyze the facts to construct a coherent narrative about the past. This involves:

  • Looking for patterns, cause-and-effect relationships, and the influence of individuals, ideas, and chance events;
  • Considering multiple perspectives and motivations of historical figures;
  • Comparing and contrasting differing sets of ideas and institutions; and
  • Drawing comparisons across time periods and regions to identify long-term developments.

Historians use critical textual analysis as a key method in evaluating historical sources and constructing reliable interpretations of the past. This involves carefully examining the content, context, and origins of texts to assess their credibility and meaning. Historians consider who created a source and their potential biases or motivations that could influence the content. Key questions include:

  • What was the author’s background, position, and possible agenda?
  • Did they have firsthand knowledge of the events described or a particular perspective?
  • How might the intended audience have shaped what was written?

Recognizing the “tendency” or bias of a source helps determine its reliability and limitations.

Well-supported historical arguments consider counter-evidence, multiple causation, and avoid unsupported speculation. Historians explicitly distinguish between opinion and hypotheses grounded in evidence.

Historians cross-check sources against each other to assess consistency and reliability. The more independent sources that agree on a fact or event, the more confidence historians can have in that information. However, even a majority of sources agreeing does not guarantee accuracy without passing the test of critical analysis. Historians also consider how the values and ideas of the time period and cultural context may have influenced a source’s content.

See for example:

Gunn, Simon and Lucy Faire, eds,  Research Methods for History, Edinburg: Edinburgh University Press, 2012

Schrag, Zachary, The Princeton guide to historical research, Princeton: Princeton University Press, 2021

Shafer, Robert Jones, A guide to historical method, Homewood, Ill. : Dorsey Press, 1974

Brundage, Anthony, Going to the sources : a guide to historical research and writing, Hoboken, New Jersey : John Wiley & Sons Inc., 2017

Hudson, Pat,  History by numbers : an introduction to quantitative approaches, London : Arnold ; New York : Co-published in the U.S.A. by Oxford University Press, 2000

Todd,Molly, Undergraduate research in history : a guide for students, Abingdon, Oxon ; New York, NY : Routledge, 2022

Dobson, Miriam and Benjamin Ziemann , ed,Reading primary sources : the interpretation of texts from nineteenth and twentieth century history, London ; New York, New York : Routledge, 2020

[55] See for example:

Elizabeth Shown Mills, Bridging the Historic Divide: Family History and “Academic” History, “History or Genealogy? Why Not Both?” presented at the Indianapolis-based Midwestern Roots Conference, Sponsored jointly by the Indiana Historical Society and the Indiana Genealogy Society, August 2004, https://www.historicpathways.com/download/bridghisdivideivide.pdf

Elizabeth Shown Mills, Academia vs. Genealogy Prospects for Reconciliation,  National Genealogical Society Quartrerly, Volume 71 , Number 2, June 1983, Pages 99 – 106 ,https://www.historicpathways.com/download/acadvgenea.pdf

Elizabeth Shown Mills, Genealogy in the “Information Age”: History’s New Frontier?, national Genealogical Society Quarterly 91 (December) 2003, Pages 260-277, https://historicpathways.com/download/genininfoage.pdf

Taylor, Robert & Ralph J. Crandall, Historians and Genealogists: An Emerging Community of Interest, Chapter One in Robert M. Taylor & Ralph J. Crandall, Eds., General and Change: Genealogical Perspectives in Social History, Macon: Mercer University Press, 1986, Pages 3 – 28

Hays, Samuel P., History and Genealogy: Patterns of Change and Prospects for Cooperation, Cahpeter Two in Robert M. Taylor & Ralph J. Crandall, Eds., General and Change: Genealogical Perspectives in Social History, Macon: Mercer University Press, 1986, Pages 29 –

[56] ICAPGen focuses more on demonstrating deep expertise in a specific geographical area, while BCG credentials validate a genealogist’s ability to apply professional research standards across any region. But both credentials mark one as a ‘qualified professional’ genealogist who effecetively can serve clients.

  1. ICAPGen awards the Accredited Genealogist (AG®) credential. BCG offers two credentials: Certified Genealogist (CG℠) and Certified Genealogical Lecturer (CGL℠).
  2. ICAPGen requires applicants to specialize in one of over 25 geographical regions (e.g. Germany, New York, Ireland). BCG does not require regional specialization for the CG credential.
  3. ICAPGen has a multi-step process including a readiness assessment, four-generation project, two timed tests, and an oral review. BCG requires submission of a single portfolio of work samples demonstrating various research skills.
  4. The BCG portfolio includes a code of ethics, development activities, document work, research report, case study, and kinship-determination project. ICAPGen does not have a single portfolio, but incorporates some similar elements across its multi-step process.
  5. BCG places a strong emphasis on adherence to the Genealogical Proof Standard throughout the portfolio. ICAPGen incorporates professional standards like the GPS, but the focus is more on regional expertise.
  6. Those with a CG or AG in one region can apply for the other credential with reduced experience requirements.

See:

Why Become an AG Professional, The International Commission for the Accreditation of Professional Genealogists, https://www.icapgen.org/become-accredited/

Accredited genealogists and certified genealogists: Different credentials that both lead to quality research, Heritage Bridge, https://www.heritagebridge.com/blog/2022/3/9/accredited-genealogists-and-certified-genealogists-different-credentials-that-both-lead-to-quality-research

Credentialing: Accreditation, Certification, or Both?, May 30, 2013, Board for Certification of Genealogists, https://bcgcertification.org/credentialing-accreditation-certification-or-both/

Genealogy Degrees and Accreditations, Legacy Tree Genealogists, https://www.legacytree.com/blog/genealogy-degrees-and-accreditations

[57] Hjorthén Adam , Reframing the History of American Genealogy: On the Paradigm of Democratization and the Capitalization of Longing. Genealogy. 2022; 6(1):21. https://doi.org/10.3390/genealogy6010021

Elizabeth Shown Mills, Working with Historical Evidence: Genealogical Principles and Standards, Vol 87, No. 3, Sep 1999, Evidence, A special Issue of the National Genealogical Society Quarterly, Page 169, https://www.historicpathways.com/download/workwthhistevidence.pdf

Elizabeth Shown Mills, Genealogy in the “Information Age”: History’s New Frontier?, national Genealogical Society Quarterly 91 (December) 2003, Pages 260-277, https://historicpathways.com/download/genininfoage.pdf

[58] Elizabeth Shown Mills, Working with Historical Evidence: Genealogical Principles and Standards, Vol 87, No. 3, Sep 1999, Evidence, A special Issue of the National Genealogical Society Quarterly, Page 167-169, https://www.historicpathways.com/download/workwthhistevidence.pdf

[59] Elizabeth Shown Mills, Working with Historical Evidence: Genealogical Principles and Standards, Vol 87, No. 3, Sep 1999, Evidence, A special Issue of the National Genealogical Society Quarterly, Page 169, https://www.historicpathways.com/download/workwthhistevidence.pdf

[60] The American Genealogist (TAG), founded in 1922 by Donald Lines Jacobus, is a quarterly journal focused on carefully documented genealogical analyses and has been America’s premier independent genealogical journal.

The American Genealogist was begun in 1922 by Donald Lines Jacobus (1887–1970) as the New Haven Genealogical Magazine. The first eight volumes consisted primarily of the editor’s alphabetical compendium of “Families of Ancient New Haven.” When that project was completed, the journal became, with the July 1932 issue, The American Genealogist and New Haven Genealogical Magazine. It was dedicated to the elevation of genealogical scholarship through carefully documented analyses of genealogical problems and through short compiled genealogies. In 1937 the subtitle was dropped, and the journal became simply The American Genealogist, usually abbreviated as TAG.”

The American Genealogist, https://americangenealogist.com

The National Genealogical Society Quarterly (NGSQ), established in 1912, publishes scholarly material covering all US regions and ethnic groups.

Since 1912, the National Genealogical Society Quarterly has published material concerning all regions of the nation and all ethnic groups including case studies, essays on new methodology and little-known resources, critical reviews of current books, and previously unpublished source materials.

National Genealogical Society Quarterly (NGSQ) & Archive, https://www.ngsgenealogy.org/ngsq/

The New England Historical and Genealogical Register, launched in 1847, set the standard for American genealogical writing and continues to publish historical and genealogical materials. American Ancestors set the standard for American genealogical writing in 1847 with  the first issue of its quarterly journal, The New England Historical and Genealogical Register

American Ancestor, A National Center for Family, History, Heritage and Culture, https://www.americanancestors.org/publications

The Genealogist, founded in 1980 by Dr. Neil D. Thompson, publishes high-quality genealogical articles and is now owned by The American Society of Genealogists

Hansen, Charles and Gale Ion Harris, eds, The Genealogist, American Society of Genealogists, https://fasg.org/the-genealogist/

[61] Board for Certification of Genealogists, The BCG Genealogical Standards Manual, Millennium Edition, Provo, Utah: Ancestry Publishing, 2000

Board for Certification of Genealogists, Genealogy Standards, New York: Ancestry Publishing, 2014

Koch, Andrew, 7 Steps for Fact-Checking Online Family Trees, FamilyTree, https://familytreemagazine.com/strategies/fact-check-family-trees/

Cooke, Lisa, How to Use Online Genealogy Trees and Hints Wisely, 21 Jul 2018, Lisa Cooke Blog, https://lisalouisecooke.com/2018/07/21/family-trees-reliable/

The following books are recommended for more information on genealogical research methods and the Genealogical Proof Standard: 

  • Greenwood, Val., The Researcher’s Guide to American Genealogy, Third Edition (Baltimore, Maryland: Genealogical Publishing Company, 2000). 
  • Mills, Elizabeth Shown, Evidence! Citation and Analysis for the Family Historian (Baltimore, Maryland: Genealogical Publishing Company, 1997). 
  • Mills, Elizabeth Shown,Evidence Explained: Citing History Sources from Artifacts to Cyberspace, 2nd Edition (Baltimore, Maryland: Genealogical Publishing Company, 2009). 
  • Mills, Elizabeth Shown, editor, Professional Genealogy: A Manual for Researchers, Writers, Editors, Lecturers, and Librarians (Baltimore, Maryland: Genealogical Publishing Company, 2001). 
  • Mills, Elizabeth Shown, QuickSheet: The Historical Biographer’s Guide to Cluster Research (the FAN Principle) (Baltimore, Maryland: Genealogical Publishing Company, 2012). 
  • Mills, Elizabeth Shown, QuickSheet: The Historical Biographer’s Guide to Individual Problem Analysis (Baltimore, Maryland: Genealogical Publishing Company, 2012). 
  • Mills, Elizabeth Shown,QuickSheet: The Historical Biographer’s Guide to the Research Process (Baltimore, Maryland: Genealogical Publishing Company, 2012). 
  • Rose, Christine, Genealogical Proof Standard: Building a Solid Case, 3rd Edition Revised (San Jose, California: CR Publications, 2009).

[62] Genealogical Standards and Guidelines – International Institute, FamilySearch Wiki, FamilySearch, This page was last edited on 27 April 2023, https://www.familysearch.org/en/wiki/Genealogical_Standards_and_Guidelines_-_International_Institute

Ethics and Standards, Board for Certification of Genealogists (BCG), https://bcgcertification.org/ethics-standards/

Genealogy Research Guide, Smithsoian Libraries, Last Updated October 6, 2023, https://library.si.edu/research/genealogy

National Genealogical Society, NGS Guidelines, https://www.ngsgenealogy.org/free-resources/guidelines/

Genealogical Standards and Guidelines – International Institute, FamilySearch Wiki, FamilySearch, This page was last edited on 27 April 2023, https://www.familysearch.org/en/wiki/Genealogical_Standards_and_Guidelines_-_International_Institute

Ethics and Standards, Board for Certification of Genealogists (BCG), https://bcgcertification.org/ethics-standards/

Genealogy Research Guide, Smithsoian Libraries, Last Updated October 6, 2023, https://library.si.edu/research/genealogy

National Genealogical Society, NGS Guidelines, https://www.ngsgenealogy.org/free-resources/guidelines/

[63] Lucy, Catherine, Research Trends & Emerging Technologies for Genealogists, School of Information Student Research Journal, Volume 5, Issue 2, Article 4, Jan 2015, Page 1, https://scholarworks.sjsu.edu/cgi/viewcontent.cgi?article=1217&context=ischoolsrj

[64] Kratz, Jessie, Census Records: The 72-Year Rule, 20 Jan 2022, Pieces of History, National Archives Blog, https://prologue.blogs.archives.gov/2022/01/20/census-records-the-72-year-rule/

O’Daniel, Patrick, The Primary Source: Issues in the Usability of Genealogical Records, Master of Science Thesis, Dec 2007, https://trace.tennessee.edu/cgi/viewcontent.cgi?article=1213&context=utk_gradthes

[65] Lucy, Catherine, Research Trends & Emerging Technologies for Genealogists, School of Information Student Research Journal, Volume 5, Issue 2, Article 4, Jan 2015, Page 1, https://scholarworks.sjsu.edu/cgi/viewcontent.cgi?article=1217&context=ischoolsrj

Learning and Overcoming the Challenges of Genealogical Research, 18 Jul 2018, Historical Society of Pennsylvania, https://hsp.org/blogs/fondly-pennsylvania/learning-and-overcoming-challenges-genealogical-research

[66] Ruggles S, Fitch C, Roberts E. Historical Census Record Linkage. Annu Rev Sociol. 2018 Jul;44:19-37. doi: 10.1146/annurev-soc-073117-041447. Epub 2018 May 18. PMID: 30369709; PMCID: PMC6200350. https://pmc.ncbi.nlm.nih.gov/articles/PMC6200350/

[67] Kratz, Jessie, Researching the Family Tree, Pieces of History, 25 Oct 2016, National Archives Blog, https://prologue.blogs.archives.gov/2016/10/25/researching-the-family-tree/

O’Hare, Sheila, Genealogy and History, Apr 2002, Common Place, https://commonplace.online/article/genealogy-and-history/

[68] Dyer, Nicole Elder, Genealogy Research in the 21st Century Part I: Genealogy Research is Still Hard, 20 Mar 2020, Family Locket, https://familylocket.com/genealogy-research-is-still-hard/

Mulcahy, Bryan L. How to Evaluate Genealogical Evidence , Illinois Sons of the American Revolution, https://www.illinois-sar.org/uploads/9/7/6/5/97654736/how_to_evaluate_genealogical_evidence.pdf

[69] Lucy, Catherine, Research Trends & Emerging Technologies for Genealogists, School of Information Student Research Journal, Volume 5, Issue 2, Article 4, Jan 2015, Page 2, https://scholarworks.sjsu.edu/cgi/viewcontent.cgi?article=1217&context=ischoolsrj