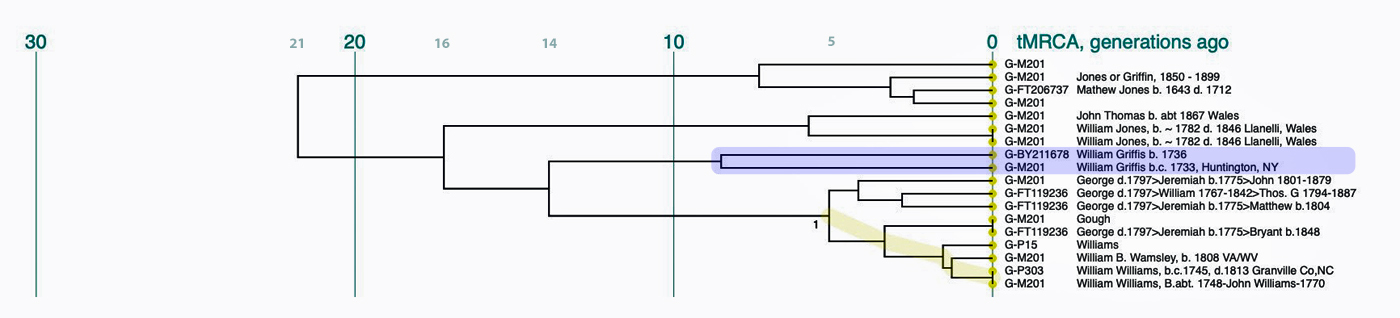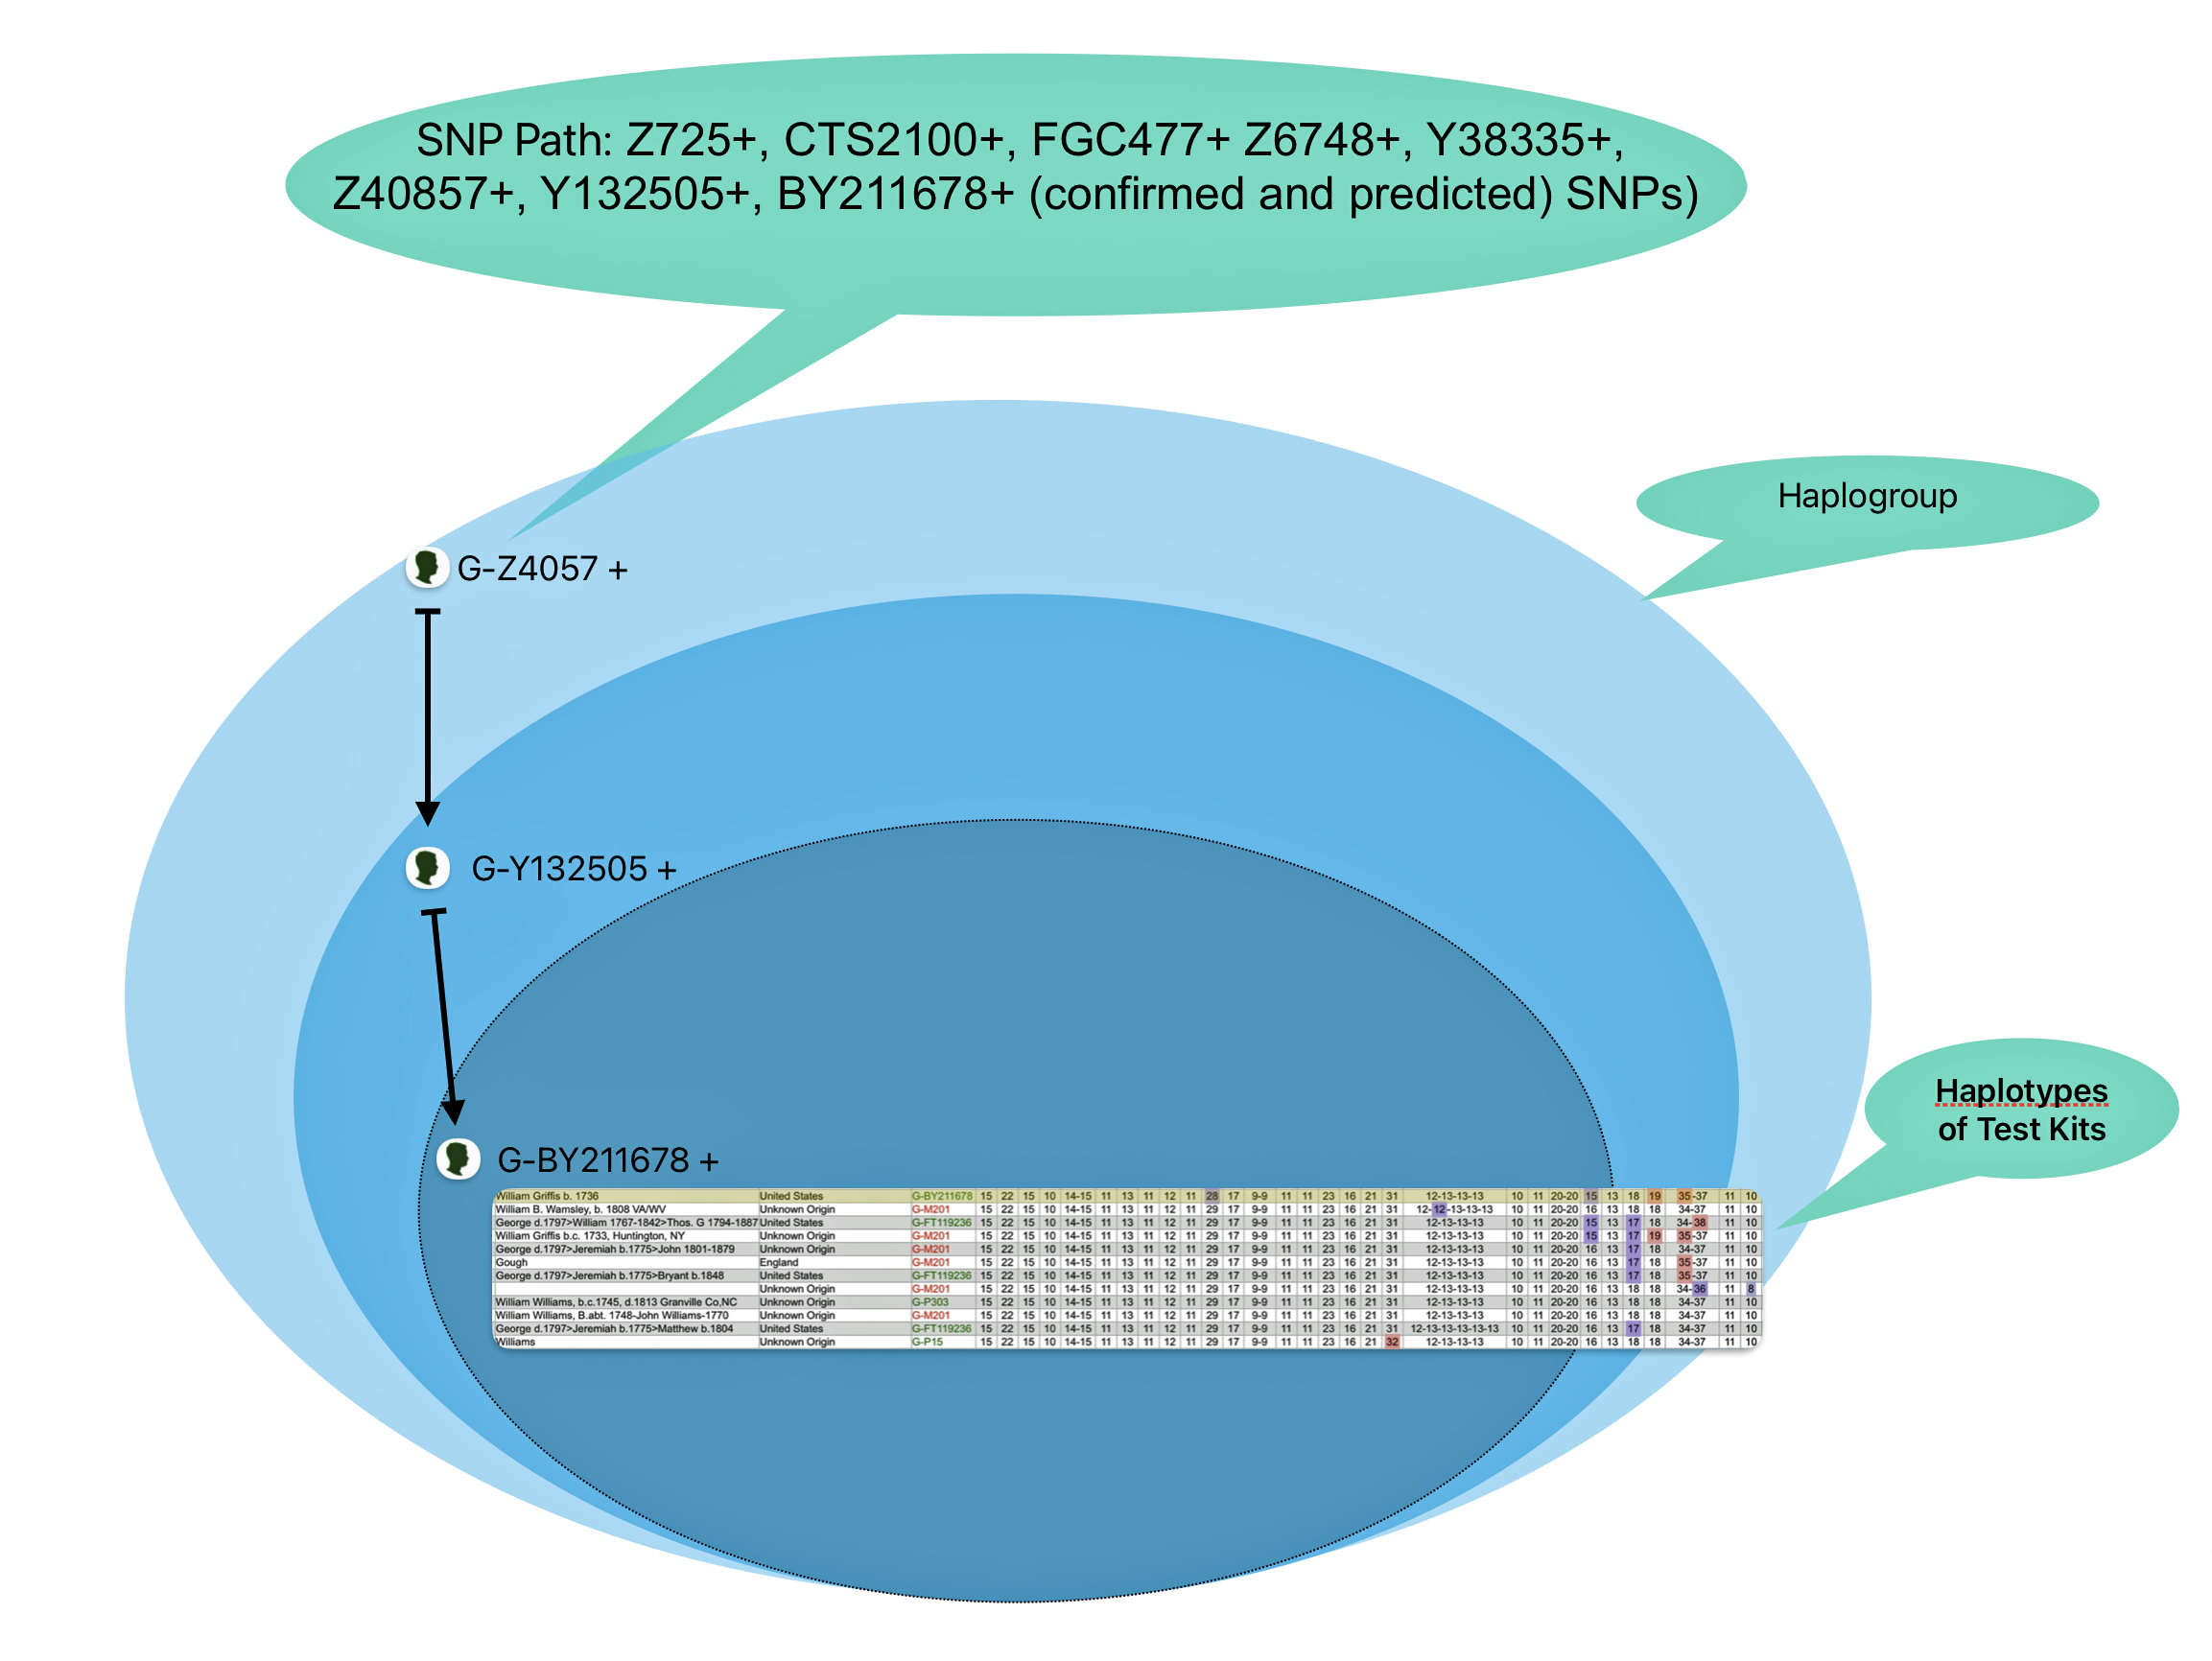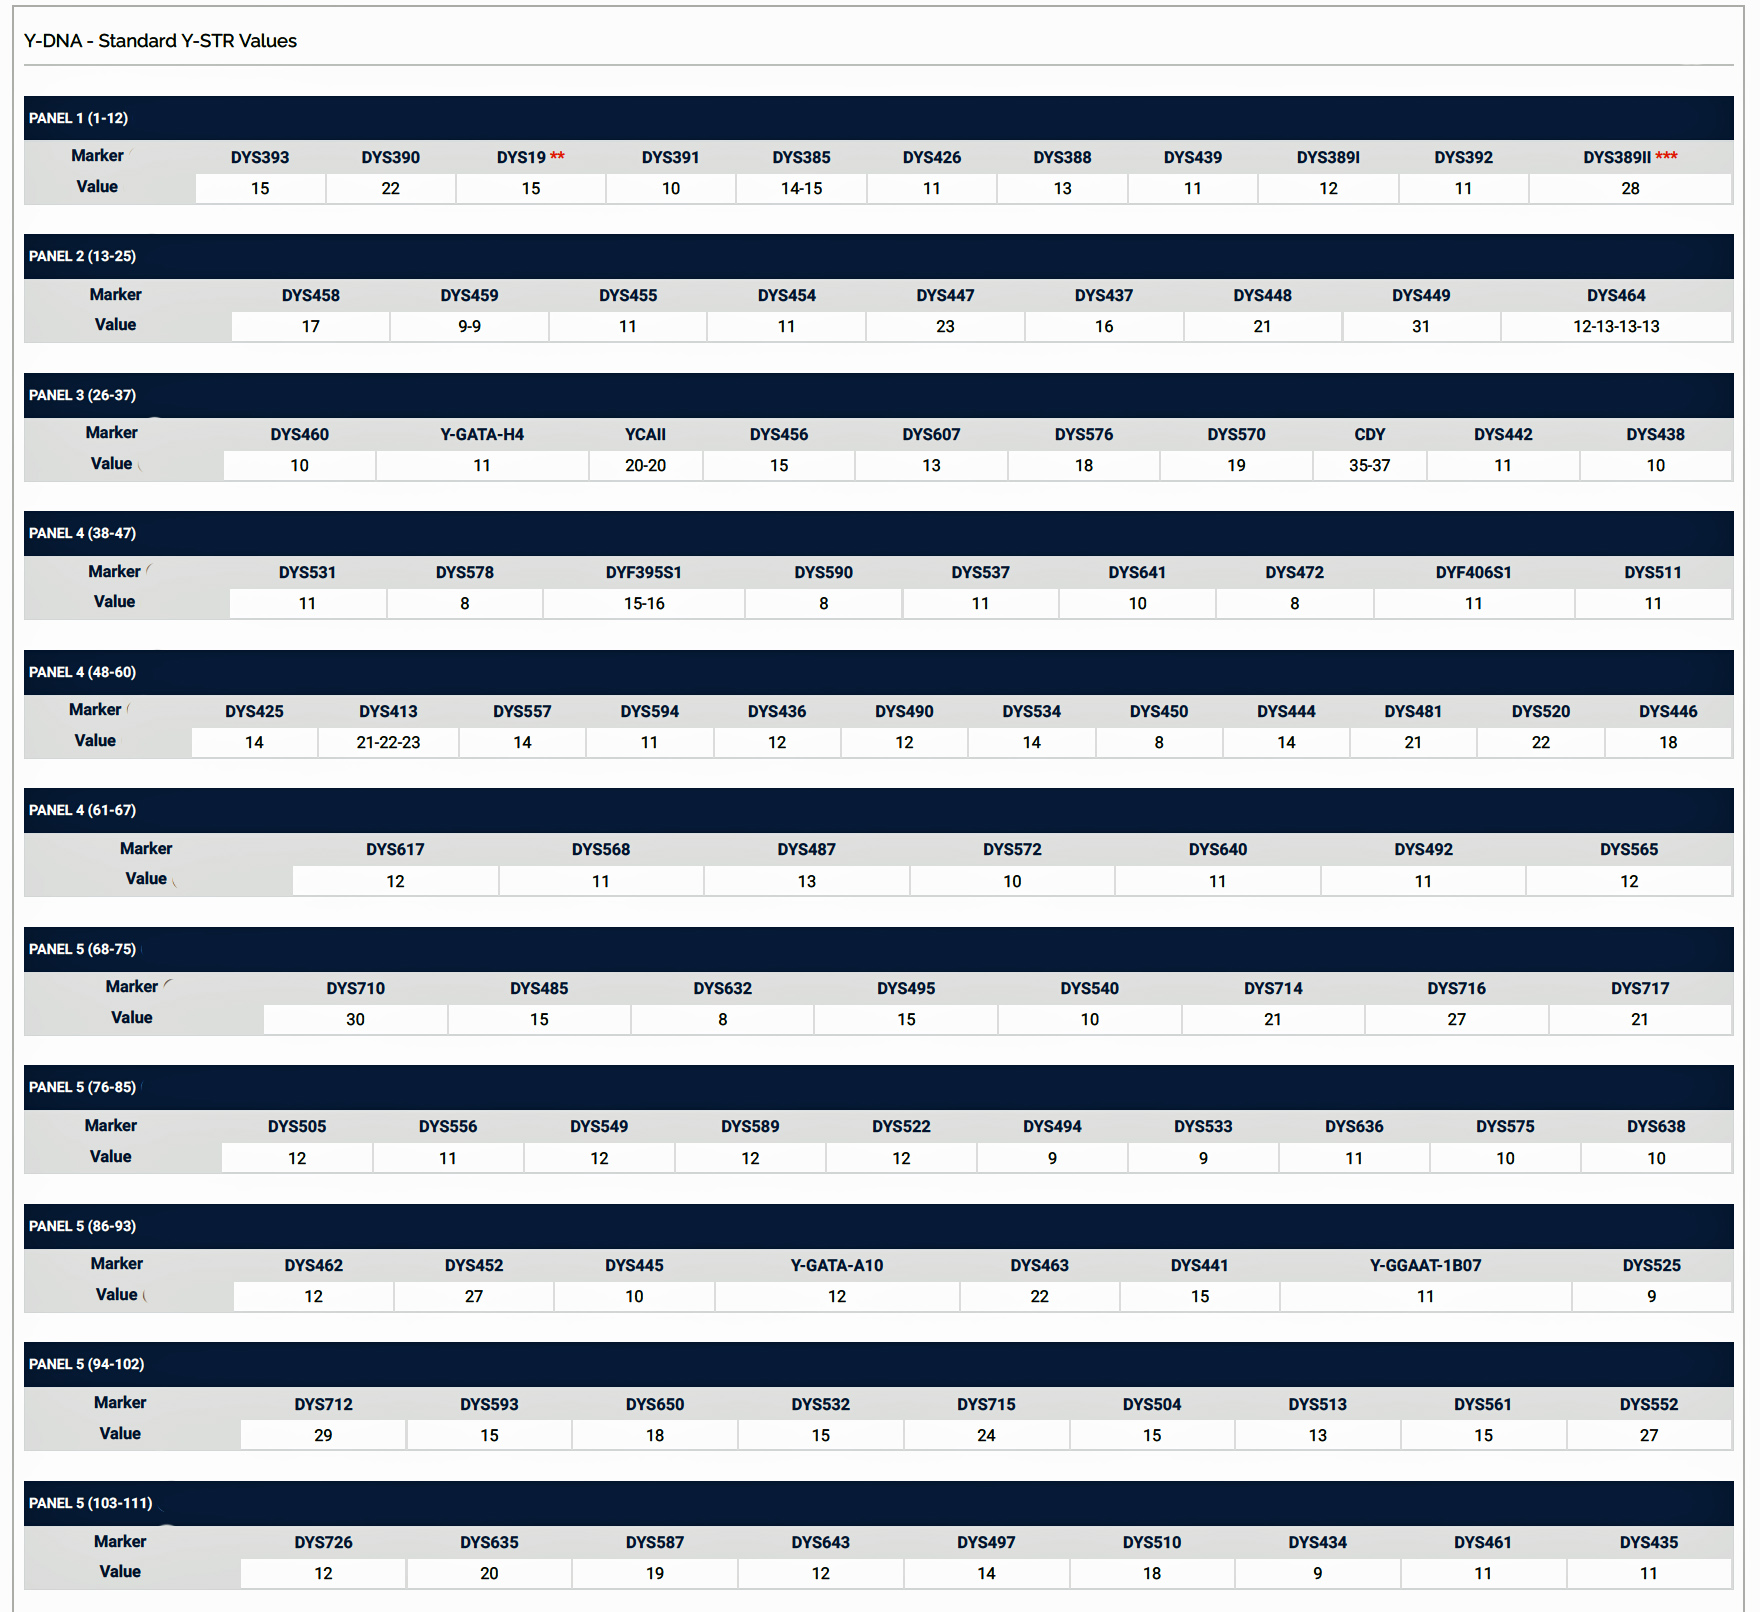


This is the eighth part of long story about a 2,850 year gap or absence of documented YDNA haplogroups in the Griff(is)(es)(ith) genetic YDNA paternal line. Various aspects of this gap have been discussed in the prior seven parts of the story. The gap started with the most common recent ancestor associated with haplogroup G-FGC7516 who was born around 2200 BCE. The next documented genetic ancestor in the Griff(is)(es)(ith) YDNA line is an ancestor associated with the G-Z6748 haplogroup. This gap of undocumented YDNA ancestors represents about 95 generations. It is a relatively big gap that spans a migratory path in a period of wide ranging changes in the environment as well as the social fabric of the landscape in northwestern Europe.
This part of the multi-part story (the eighth part) and the next part (the ninth and final part) focuses on a discussion about the ancestor associated with the G-Z6748 haplogroup and the undocumented generations that may have lived immediately before or after his life.
Specifically this part of the story focuses on the environmental influences and possible soecific migratory paths that might be associated with the generations on the tail end of this phylogenetic gap. The final, ninth part of the story focuses on the possible indigenous socio-cultural groups that might have been associated with these YDNA generations.
As discussed in part six of this story, the estimated possible migratory paths of the approximately 95 undocumented generations that are associated with this phylogenetic gap significantly widens as each successive generation approached and passed through the area that is presently known as the Rhine Meuse delta region. The eventual endpoint of this migratory path is where and when the ancestor associated with haplogroup G-Z6748 may have lived.

- The Turbulent Roman Era – The Griff(is)(es)(ith) Y-DNA Phylogenetic Gap Associated with the Meuse and Rhine River Watershed – Part Seven November 30, 2025
- Looking at the Tail End of the Griff(is)(es)(ith) Y-DNA Phylogenetic Gap Associated with the Meuse and Rhine River Watershed – Part Six October 30, 2025
- Looking at the Griff(is)(es)(ith) Y-DNA Phylogenetic Gap Associated with the Meuse and Rhine River Watershed from the Bronze Age Onward – Part Five October 8, 2025
- Looking at the Griff(is)(es)(ith) Y-DNA Phylogenetic Gap Associated with the Meuse and Rhine River Watershed from the Bronze Age Onward – Part Four September 21, 2025
- Looking at the Griff(is)(es)(ith) Y-DNA Phylogenetic Gap Associated with the Meuse and Rhine River Watershed – Part Three August 29, 2025
- Looking at the Griff(is)(es)(ith) Y-DNA Phylogenetic Gap Associated with the Meuse and Rhine River Watershed – Part Two July 29, 2025
- Looking at the Griff(is)(es)(ith) Y-DNA Phylogenetic Gap Associated with the Meuse and Rhine River Watershed – Part One June 30, 2025
The possible migratory paths of the Griff(is)(es)(ith) YDNA genetic line were Influenced in varying degrees by the geographical and environmental influences impacting changes in the Rhine, Meuse, and other river watershed areas. As generations of the Griff(is)(es)(ith) YDNA lineage migrated northwestward through the lower Rhine and delta region, the marine activity on the north and west coastline and the changing terrain of the peat lowlands, increasingly played an influencing role on their migratory route.
In the late Roman and medieval periods, large parts of the western and northern Netherlands were covered by extensive peat bogs that changed over time. Research increasingly shows that major geographical changes (e.g., changing river courses, an increase of flooded areas and wet areas) occurred during the transition from the late-Roman (around 270 to 450 CE) to early-medieval periods (roughly 450 to 1050 CE). [1] Coinciding with these landscape changes, archaeological evidence in the modrn day Netherlands area points to a severe demographic decline as well as changes in settlement patterns and land use during this period. [2]
“The first millennium AD encompasses the Roman period (12 BC to AD 450) and the Early Middle Ages (AD 450 to 1050). In the Netherlands, this millennium saw population growth, steep decline and subsequent revival. In addition, many changes occurred in the physical landscape, marking a transition from a mainly natural prehistorical lowland landscape to an increasingly human-affected landscape.
“From the late 3rd century AD, . . . depopulation occurred, coinciding with the collapse of the Western Roman Empire and the large-scale migration of tribes throughout NW Europe. This period has traditionally been referred to as the ‘Dark Ages’ . This term on the one hand refers to a period of cultural decline and disorder, and on the other hand it is used for periods in general from which little information is available.“[3]
The Historical and Geographical Context of the Most Recent Common Ancestor (MRCA) of Haplogroup G-Z6748
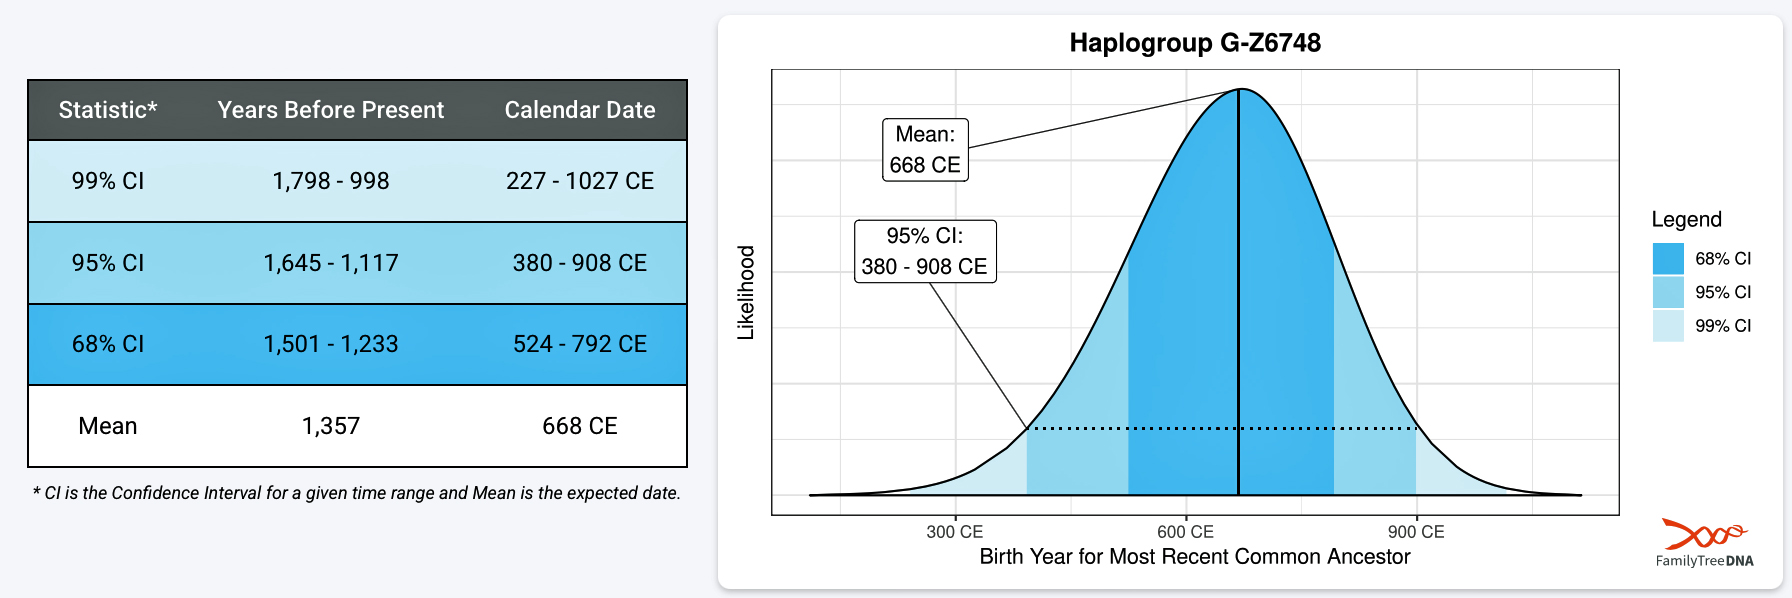
As depicted in illustration one, it is estimated that the ancestor that marks the endpoint of this phylogenetic gap, a male descendant who represents the G-Z6748 haplogroup, was born around 668 CE. There is a 95 percent chance of certainty that he was born within a roughly six hundred year time span, 380 CE to 908 CE. There is a 68 percent chance that he was born between 524 CE and 792 CE, roughly a 275 year range (see illustration two). [4]
Illustration One: Scientific Details of the G-Z6748 Haplogroup
Harm Jan Pierik, a geographer who studies the geology and landscape evolution of the lowland areas, provides an informative illustration that situates two paleogeographical maps in a timeline based on five different time axes: general archaeological time periods, socio-cultural time periods, reforestation and deforestation cycles, climatic periods and geomorphological changes between 100 BCE and 1200 CE (see illustration two).
Illustration Two: Palaeogeographical maps of 100 CE and 800 CE of Netherlands

This illustration provides a wealth of summary and graphic information on the Netherlands in the first millennium CE. The Dutch landscape shifted from mostly natural to an heavily human-altered environment. Changes, however, varied by region due to the nature of the local geography and people’s actions like farming, draining land, and cutting peat for building supplies and fire. Humans slowly weakened landscapes through everyday land use, until big events like storms tipped them into lasting new shapes—worst in peat coasts, milder in rivers and sands areas. By 1000 CE, people had unintentionally remade the Netherlands’ lowlands.
If we assume that the most recent common ancestor of haplogroup G-Z-6748 was born roughly between 525 and 800 CE (within the 68 percent statistical confidence interval reflected in illustration one), we can get an inkling of the general historical context and the physical circumstances he as well as immediate preceding generations experienced when they lived. Illustration three highlights when the Most Recent Common Ancestor (MRCA) of G-Z6748 and immediate generations lived in context of the five time lines found in Harm Jan Pierik’s illustration.
Illustration Three: Most Recent Common Ancestor of G-Z6748 and Five Time Periods

The ancestor lived in what is known as ‘period B’ of the early medieval archaeoogical period. This early medieval period (roughly the fifth through tenth centuries) in Europe, is called the “Dark Ages” and saw the fall of Rome, migrations of various indigenous groups (referred to as ‘the Migration Period‘ [5] ), and the formation of new kingdoms like Frankish Merovingians in the mid to south region, the Frisians in the north and Anglo-Saxons in England. [6] It was a period characterized by fragmented power, cultural shifts, and the rise of Christianity, with later centuries showing increasing stability and development before the High Middle Ages. [7]
Another rendition of the five time lines in context of when the MRCA of G-Z6748 lived is provided in illustration four below. Illustration four is from a study by Rowin J. van Lanen who presents the combined results of several mutlidisciplinary studies, including Pierik’s, that developed landscape-archaeological models of this time period. These models spatially analyze natural and cultural dynamics in five manifestations: route networks, long-distance transport corridors, settlement patterns, palaeodemographics and land-use systems. Van Lenen’s summary study basically ‘repackages’ Pierik’s illusration into a slightly different graphic portrayal. [8]
Illustration Four: The MRCA of G-Z6748 in Context of Cultural and Natural Dynamics During the First Millennium AD

Similar to illustration three, van Lanen’s depiction of the time period suggests that the MRCA of G-Z6748 lived during a period when there was low population density during the Merovingian era that witnessed a period of reforestation. He also lived in the Dark Ages Cold Period (DACP) was a time of widespread cold, particularly in the Northern Hemisphere, roughly from AD 400 to 765 CE, following the Roman Warm Period and overlapping with the Late Antique Little Ice Age (LALIA) around AD 536-660 AD. This cold period was likely triggered by massive volcanic eruptions and low solar activity. [9]
During this period of time, generations of ancesters preceding the MRCA of haplogroup G-Z6748 may have lived in the central area of the lowlands. It is also possible that the MRCA of G-Z6748 migrated to the northern area where remnants of his YDNA have been reportedly located. Depending on the rate and course of migration, preceding generations may have lived in the coastal areas of the central delta and river watershed areas of the Meuse and Rhine Rivers.
“Life Experiences” of MRCA of G-Z6748 and Ancestors Living Between 525 and 800 CE
As mentioned there is a 68 percent chance that the MRCA of G-Z6748 was born between 524 CE and 792 CE. This time span of roughly a 275 years represents about 8 generations of YDNA ancesors, one of which represents the MRCA of G-6748. Using this time span, we can recreate a general protrayal of what these generations experienced based on the time line conditions referenced in illustrations three and four and depending on the geographical location of where they might have lived along the migratory path.
An individual living in the northern coastal Netherlands area between 525 and 800 CE
An individual in the northern Netherlands between 525 and 800 CE would have lived in small, kin-based rural communities in a wet, tidally influenced landscape, with a mixed farming economy and gradually increasing integration into wider Frisian and Frankish trade networks and political structures of emerging elites. Social life was structured around extended households, local assemblies and daily existence was closely shaped by flooding, salt-marsh grazing, and modest climatic variability in the late Holocene North Sea environment. [10]
Much of the northern coastal zone (Friesland, Groningen, north Noord-Holland) consisted of low salt marshes, tidal creeks, and peat hinterlands, with settlements concentrated on artificial dwelling mounds (called terpen/wierden) rising above flood level. Periodic storm surges and high tides inundated surrounding fields and pastures, depositing fertile silt but also posing recurrent risks to people and livestock. The climate in the North Sea region showed phases of increased wetness without the sustained warmth of the later Medieval Climate Anomaly. Inhabitants experienced a cool-temperate, often damp and windy regime with notable year-to-year variability. [11]
The core economic experience was mixed farming, with a strong emphasis on cattle and sheep grazing the salt marshes, supplemented by arable plots on slightly higher or reclaimed ground. Daily labor included tending livestock, managing manure and fodder on restricted dry surfaces, maintaining paths and small embankments, and exploiting marine resources such as fish and perhaps shellfish from creeks and tidal flats. From the later sixth to seventh centuries, coastal communities increasingly tapped into regional exchange networks. Some Frisians gained reputations as merchants and mariners moving goods along the North Sea, though most rural inhabitants remained primarily local farmers with occasional surplus from their labor entering trade. [12]
Politically, the region was characterized by early medieval Frisia: a patchwork of local communities and elites along the North Sea coast, described in later written sources as forming a Frisian “kingdom,” but likely experienced locally as a network of kin groups, chiefs, and regional leaders rather than a centralized state. Social life was organized around extended households and free farming families, with local assemblies and customary law; later codified as Lex Frisionum under Frankish rule, this legal culture emphasized fines, compensation, and gradations of social status. From the seventh to eighth centuries, Frankish expansion brought military pressure and eventual incorporation of much of Frisia into the Carolingian realm, so inhabitants would increasingly encounter Frankish officials, tribute demands, and shifting allegiances of local elites, even as everyday village life remained relatively continuous. [13]
In the earlier part of this period, religious life centered on local pagan cults and rituals, with sanctuaries and offerings embedded in the landscape. Christian missionaries began to work in Frisian territory from the late seventh century onward. Over the eighth century, conversion progressed unevenly. Some communities saw churches established on or beside terpen, while others likely maintained older practices for longer, producing a mixed religious experience with new rites layered onto existing customs. [14]
“Frisian” identity in these centuries was situational and relational, emerging in contacts with Franks, Saxons, and North Sea partners. For most individuals, identity would have been anchored first in kin, settlement, and local region, with broader ethnic labels activated in specific legal, military, or trading contexts. [15]
An individual living in the central delta and river watershed area of the Meuse and Rhine Rivers Between 525 and 800 CE
The daily existence of an individual living in the central delta and river watershed area of the Rhine and Meuse rivers was shaped by mixed farming in a wet, flood‑prone delta landscape. They may have witnessed periodic political and military disruptions over control of the Rhine–Meuse system and a slow Christianization that overlaid older regional cults. The central area (roughly the Rhine–Meuse–Waal–IJssel river district around Utrecht, Nijmegen, and the lower Rhine branches) was a low delta with natural levees, crevasse splays, peat bogs, and backswamps. People concentrated on the slightly higher, drier alluvial ridges along the main channels. [16]
Flooding was a recurring fact of life: around the fifth to sixth centuries. The Waal river branch became more dominant, bringing higher and more frequent floods in parts of the delta, though protective natural levees made the landscape relatively resilient compared to more exposed coastal zones. For inhabitants, this meant managing arable strips and meadows on limited high ground, coping with occasional inundations and sedimentation, and negotiating access to extensive wetland resources (peat, reeds, fishing, fowling) in surrounding lowlands. [17]
Settlement focused on small farm clusters and villages strung along levees and sand ridges, often reusing or near former Roman sites. Early medieval farms at places like De Geer or near Roomburg show continuity and adaptation of earlier settlement structures in the river landscape. [18] Households practiced mixed farming (cattle, sheep, some pigs and horses, with cereals and other crops on better-drained plots), with daily work dominated by tending stock, maintaining fields and drainage, cutting peat or sods, and using the rivers as movement corridors.
Compared to the terp coast, inhabitants here had more direct contact with inland and southern regions through river traffic. Even ordinary villagers would periodically encounter non‑local goods, styles, and people via markets and itinerant traders. [19]
Politically, this was a contested geographical zone: during parts of the seventh century, Frisian rulers extended power into the central river area, while Merovingian and later Carolingian Frankish kings held key strongholds and centers farther south and east.Dorestad, near modern Wijk bij Duurstede, grew into a major trading emporium along the Rhine–Lek fork, so people in its hinterland experienced increased demand for surplus produce, craft goods, and transport services, as well as exposure to coinage and long‑distance merchants.The Frisian–Frankish wars in the seventh to eighth centuries, focused on control of the Rhine delta and brought episodes of campaigning, shifting overlordship, and, for some communities, tribute or military obligations, even if actual battles occurred only intermittently in any given locality. [20]
The central river region retained deep cultural memories of earlier Batavian and Roman cult sites. Early medieval sources and archaeology indicate regional cult places and sacred landscapes persisting into the first Christian centuries. Christianization advanced here earlier and more densely than in the northern coastal zone. Utrecht, built on a former Roman fort, became a missionary center, and churches and cemeteries appeared along the river routes from the seventh century onward. For individuals, this likely meant living through a gradual shift from cremation or traditional burial rites to inhumation in Christian graveyards, new ritual calendars, and the growing authority of priests and ecclesiastical institutions layered onto existing kin and local structures. [21]
The Rhine–Meuse corridor linked the North Sea and Zuiderzee routes with central and southern Frankish regions, so central Netherlands inhabitants were embedded in larger regional exchange systems that carried wine, pottery, textiles, slaves, and other goods. Over the seventh to eighth centuries, Frankish consolidation and the rise of emporia-like Dorestad drew the area more firmly into the Carolingian world, creating opportunities in trade and craft but also greater exposure to taxation, tolls, and elite power struggles. [22]
The enviromental impacts in the coastal, river delta, and sandy uplands areas
From 500 to 900 CE the northern Netherlands shifted from a largely open peat–marsh and barrier-island coast with dispersed terp settlements to a more fragmented, wetter and increasingly human‑engineered tidal landscape with expanding salt marsh ridges, drowned peat interiors, and more structured terp rows and ‘proto‑dike’ systems. The key processes were gradual: relative sea‑level rise, peat subsidence and erosion, salt‑marsh progradation along the Wadden Sea, and locally intensive reclamation and drainage that both created and destroyed land. [23]
In the coastal lowlands, peat bogs were drained for farming and fuel, causing them to sink and become vulnerable to sea floods from storms. Once saltwater rushed in, it carved channels and piled up mud, turning huge bog areas into salty tidal flats that stayed that way for centuries, making much of the land unlivable. [24]
In the river delta areas of the Meuse and Rhine rivers, deforestation upstream dumped more dirt into rivers like the Rhine and Meuse, while sinking peat downstream helped new river branches form and steal water from old ones. People kept living on higher riverbanks despite more floods, adapting by moving uphill, but the area stayed mostly farmable without total collapse. [25]
In the sandy uplands of the northern coast, sands stayed stable overall, with only small patches blowing around near villages due to tree-cutting and overfarming, especially after 900 CE as population grew. Unlike wetter areas, these ‘hills’ bounced back easily from human changes in land management. [26]
The Migratory Path to the Most Recent Common Ancestor of Haplogroup G-Z6748
This mutli-part story relies on the estimated migratory path of the Griff(is)(es)(ith) genetic paternal ancestors. This estimated path was created through the use of the FamilyTreeDNA’s online GlobeTrekker program. The ‘on-the-fly’ map generation program is an innovative, interactive phylogeographic feature within the Discover™ platform that visualizes ancestral Y-DNA migration routes.
GlobeTrekker identifies each designated ancestral haplogroup’s probable position and then connects them backward in time, using ‘cost-efficient‘ routes. These ‘most likely’ or ‘cost-efficient’ routes are estimated within corridor paths or bands, capturing the uncertainty inherent in reconstructing prehistorical movement based on environmental and genetic data. The visible ‘corridor bands’ in GlobeTrekker are explicitly tied to ‘likelihood percentages‘. [27]
If we reduce the visual presence of corridor bands as well as the contrasting colors in the GlobeTrekker interactive map and leave only the estimated migratory path, you obtain a map reflected in illustration five below. The migratory line is the reflection of a ‘minimum-cost path’ within those migratory confidence bands.
Illustration Five: Estimated Migratory Path to Ancestor Associated with Haplogroup G-Z6748

What is noteworthy, when looking at the above map, is the approximate location of where the ancestor of haplogroup G-Z6748 may have lived based on the estimates derived from the Globetrekker program.. The outline of the north coast in illustration four represents the current contours of the northern coast of the Netherlands. The island just north of the Netherlands coastline is Texel Island. It is an island that is part of the West Frisian Islands, a chain of barrier islands in the North Sea. Texel is the largest of the Frisian Islands, including, Vlieland, Terschelling, Ameland, and Schiermonnikoog. [28]
If we compare the GlobeTrekker map in illustration five with palaeogeographical maps between 50 CE and 1460 CE (see maps A, B, and C, in illustration six below), it is evident that the coastal and deltaic plains during the time of this migration witnessed profound ecological changes. The modern day Texal area was attached to the mainland and was charactacterized by having high dunes surrounded by low dunes, beach ridges and valleys in 50 CE and 750 CE. By 1450 CE, the land has been separated and is an island.
Illustration Six: The Changing Landscape of the Netherlands Between 50 CE and 1450 CE in Comparison with the Migratory Paith of the Griff(is)(es)(ith) YDNA LIne

Texel became a distinct island from the North Holland mainland after this ancestor’s existence in 1170 CE due to the devastating All Saints’ Flood. The flood was the result of a massive storm surge that inundated the land, separating it and creating the island’s current form. Before this event, Texel was connected to the mainland. The floodwaters carved channels that isolated it permanently (see illustration seven). [29]
Illustration Seven: Texal Island and the West Frisian Islands

Based on the estimated ‘cost-efficient’ migratory route generated by GlobeTrekker calculations, it is possible that the ancestors of haplogrup G-Z6748 may have migrated to the northwestern point of what we call modern day Netherlands utilizing water and land routes that were used in the Roman and early medieval eras. Illustration eight depicts the general migratory route in context of the paleogeographical characteristics of the environment around 800 CE. It is possible the ancestors of G-Z6748 may have migrated north-westward via water routes, and to a lessor extent roadways, through areas that witnessed environmental changes, such as increased deforestation and geomorphological change in the northern coastal areas. [30]
Illustration Eight: Palaeogeographical Map 800 CE

In the Rhine-Meuse delta, major geomorphological changes [31] occurred during the late Roman Era and the Early Medieval Period. Generations prior to when the most recent common ancestor of G-Z6748 may have migrated along and through the Meuse Rhine watershed area during this time period of geographical change
The Rhine-Meuse delta area was characterized by a relatively high flooding frequency. For example, research conducted by Esther Jansma reconstructs a dense, year‑by‑year history of floods and related hydrological crises in the northwest European Lowlands (mainly the Netherlands) in the first milenium CE. Her research shows that large floods were clustered in particular centuries rather than evenly distributed. These events coincided with major shifts in settlement patterns and river dynamics. [32]
Jansma’s study identifies about 160 to 170 hydrological “events” (floods, prolonged wet episodes) between in the first millenium, of which roughly 20 to 25 qualify as ‘major flooding events’ defined as greater than or equal to 50‑year recurrence‑interval events. One third of all major events fell between roughly 185 to 282 CE. Another pronounced cluster occurs in the later sixth and early seventh century, with the event in 602 CE emerging as the single most severe flood of the millennium in the Dutch dataset. The migratory path of YDNA ancestors of G-Z6748 may have been impacted by both of these two clusters of flooding. [33]
Texal, the Terps and the North Coast – The Possible Home of Generations Associated with Haplogroup G-Z6748
From the later third to fourth century through about 800 CE, the northern Netherlands (roughly Friesland, Groningen, northern Drenthe, north Noord-Holland) was occupied first by remnant and returning Frisian/Chauci-related groups. By the seventh to eighth centuries the area is described in Frankish sources as Frisian territory or a Frisian “kingdom.” (More on ‘the Frisian identity’ is discussed in the ninth and final part of this story. ) [34]
The coastal area of the northern Netherlands where the most recent common ancestor of haplogroup G-Z6748 and related generations may have lived is known as the terp region. It was a region where early inhabitants built artificial mounds called terps (or wierden) on natural salt marshes to survive frequent floods from the rising sea and storm surges, creating a unique landscape of mounds scattered across flat, fertile clay plains. (see illustration nine). This ancient flood protection system allowed permanent settlement from around 600 BCE onwards in an otherwise inhospitable tidal zone. [35]
Illustration Nine: Artistic reconstruction of an early medieval terp settlement

“Initially, a terp might be just large enough for a single farmhouse (house terp), but over time these mounds could be expanded and merged. As population grew, families would enlarge the terp or cluster multiple mounds together, eventually forming a larger village terp hosting several households.” [36]
Illustration ten provides a paleogeographical map of the Texal Island area around 800 CE. This time period was probably after the time when the ancestor of G-Z6748 lived. If we compare this map with map C in illustration five or the map in illustration two, the area where this ancestor may have lived may have been separated by a channel or series of channels from the mainland.
Illustration Ten: The Texal Area around 800 CE

In the post-Roman and early medieval period, the terp zone was a low, tidally influenced salt-marsh landscape punctuated by densely occupied artificial mounds that concentrated settlement, livestock and infrastructure above the flood level while exploiting the surrounding grazing marshes and creeks. Those mounds grew into complex village platforms within a dynamic coastal system of progradation [37], erosion and episodic abandonment. [38]
The broader terp area consisted of wide, regularly inundated salt-marshes intersected by tidal creeks and channels, with only slight natural levees or sandy ridges offering higher ground. Sea-level fluctuations and storm surges repeatedly reworked these marshes, creating phases of marsh formation, local drowning of the land and sediment build-up that conditioned where terps could be founded and expanded (see illustration eleven). [39]
Illiustration Eleven: Schematic Representation of the Development of a Terp

Description of Illustration Ten: 1. First occupation phase on levee (or marsh bar). 2. Formation of house terpen through the accumulation of refuse and intentional raising. 3. Agglomeration of (nuclear) terpen into a larger village terp. 4. Expansion of the terp comes to an end as the salt marsh is dyked in.
From the Iron Age through the early Middle Ages, farms and later villages were raised on fully artificial mounds (terpen / wierden / warften), constructed from clay, sods and refuse to sit just above typical high-tide and surge levels. By the early medieval period individual house-terps (10 to 20 meters across) and larger village-terps (several hectares) formed archipelagos of habitation “islands” within the marsh, often enlarged in phases as population and flood risk increased.
“Terp habitation in the regions of the western Netherlands occurred only on a small scale; early terps in this area did not develop into the large dwelling mounds that we know from the northern coastal area. Despite obvious similarities in the Holocene development of the southern North-Sea coastal areas, there are considerable differences between underlying geological characteristics of the western Netherlands on the one hand, and the northern Netherlands and northwestern Germany on the other hand. A large part of the western Netherlands is sheltered by a coastal barrier dune system, whereas the more northerly coastal areas of the Netherlands and Germany were an open salt marsh landscape, an intertidal area of the Wadden Sea, prior to the large-scale medieval dike building. ” [40] (See illustration twelve.)
Illustration Twelve: Discovered Archaeological Sites of Terps in the Wadden Sea Area Based on Archaeological Time Period

https://www.sciencedirect.com/science/article/pii/S0964569118307348
The surrounding marshes provided highly productive grazing for cattle, sheep and horses, so terp communities practiced a mixed agro‑pastoral lifestyle with livestock on the low ground and arable plots and buildings concentrated on the mound tops and shoulders (see illustration thirteen). Excavations show the integration of the terp dwellings into wider economic networks. Roman and later imported goods, as well as isotope evidence of marine-influenced diets, indicate exchange and use of both marine and terrestrial resources. [41]
Illustration Thirteen: Digital 3D Reconstruction of the Mound Landscape

Between the third and fifth centuries many western terps were thinned out or abandoned, while some eastern terp settlements persisted, reflecting combined environmental stress and shifting socio‑political networks across the North Sea zone (see illustration eleven). Early medieval reoccupation and enlargement of terps, together with new mound building further east and south, created a renewed settlement system that reused earlier structures while adapting layout (larger communal platforms, churches, consolidated farmsteads) to changing social organization. [42]
Terpen typically had linear, lane‑based farm arrangements on a raised platform, with three‑aisled byre‑houses (longhouses) laid out in rows or clusters, often evolving over time from dispersed farmsteads to more nucleated village plans (see ilustration twelve). House plans themselves were usually elongated, tripartite buildings where humans and livestock shared one structure in zoned compartments along a central aisle. [43]
Early terpen often began as one or a few farms on a small, roughly oval or irregular mound, with buildings aligned along the mound’s long axis and oriented to exploit prevailing winds and access to creeks. As terpen were enlarged, houses, outbuildings and paths formed more structured layouts: parallel building rows, narrow lanes and yard spaces on the crown and shoulders of the mound, sometimes creating a ring‑like or fan‑shaped pattern around a central open area (see illustration ten). [44]
Between 400 and 800 CE, terp settlements shifted from a phase of contraction and partial abandonment to renewed occupation, enlargement and into more complex village terpen, part of an increasingly more complex Frisian coastal social organizational structure (see table one). Over these four centuries, the settlement pattern, internal layout, social role and regional extent of terpen all changed in step with demographic recovery, environmental opportunities and emerging power structures in the region. [45]
Table One: Terp settlements in the Northern Frisian Area Between 400 – 800 CE
Terps functioned as ‘nodal points’ linked by seasonal trackways on the marsh, small landing places on creeks and, in some areas, raised routes that later underpinned early medieval road systems. [51] The pattern is best characterised as a multi-centered coastal landscape: multiple terp clusters aligned along former creek systems and lagoon rims, tying maritime access, inland peatlands and higher Pleistocene sands into an highly adapted landscape. [52]
Excavations on Texel (e.g. Den Burg [53]) show early medieval occupation with long continuity of terp‑based and salt‑marsh settlement traditions, but the coastal band between Kennemerland and Westfriesland, including Texel, shows archaeological indications of demographic decline around the fourth century and renewed, denser occupation from the sixth to seventh centuries. For the broader northern Netherlands coast, recent ceramic and settlement analyses indicate relatively thin, scattered habitation in the fifth century, followed by clearer Merovingian‑period rural settlement networks embedded in marsh and tidal landscapes from roughly 600 CE onwards. [54]
The Nature of Road and Waterway Travel Routes that Influenced Migratory Conditions Between 400 and 800 CE
Between 400 and 800 CE the Meuse–Rhine watershed and the coastal Netherlands areas saw a shift from a largely routeless, wetland landscape with localized tracks to a strongly river‑dominated long‑distance network in which fluvial and maritime routes carried the bulk of interregional traffic. Land routes relied on persistent sandy‐ridge paths and levee routes rather than on anything like the earlier Roman road system. [55]
“Water-related routes must have been limited to past rivers, inland seas, and shorelines. Land routes show more divers (sic) patterns for these two periods, with large parts of the southern and eastern Netherlands appearing to have been either highly or reasonably accessible. Here sandy ridges constituted corridors through marshy parts of the landscape. [56]
The lowlands of the Rhine–Meuse delta and the northern Netherlands remained highly dynamic, with channel shifts, peat expansion and erosion shaping where routes could exist at all. Travel networks in this period depended on a mosaic of higher sandy coversands, levees and older beach ridges which provided dry corridors in an otherwise marshy or peat‑dominated terrain. [57]
” (P)eople living here were strongly dependent on local rivers and streams for transport (water-related routes). An interesting exception are the coastal dunes along the North Sea. Both in A.D. 100 and 800, these dunes provided an accessible north–south land connection. The importance of this connection in the Roman period is underpinned by the occurrence of Roman coastal defenses in these areas.” [58]
Formal, stone‑paved Roman roads in the Dutch sector of the limes fell out of regular use after the third to fourth centuries. There is no evidence for a comparable engineered road network in the fifth to seventh centuries. Studies of “landscape prerequisites” and route persistence over time suggests that early‑medieval long‑distance paths, where present, hugged sandy ridges and river levees, forming ‘loose corridors’ or ‘route zones’ rather than ‘single fixed roads’. These lines of movement later underlie parts of the documented medieval route skeleton. [59]
“Roads can be defined as narrow, fixed communication and transport lines connecting different places, whereas routes have been characterized as broad and vaguely delimited zones of communication and transport. Almost all Roman and early-medieval routes were unpaved and hence not rigidly anchored in space. Route zones are spatial zones in which, often unpaved, bundles of tracks, paths or roads are located. These zones formed as a result of travellers frequently shifting to adjacent lanes because of e.g. weather conditions or general wear of the carved-in tracks. Although the general orientation of past roads and routes were similar, route networks spatially were more dynamic and therefore they should be regarded as corridors rather than as single lines.” [60]
As indicated in part seven of this story, the Roman state and military investments led to a dramatic rise in road and waterway connectivity. This is aparent in the middle to upper Rhine river areas. The construction of Roman roads, waterways, and quays greatly increased mobility and integration, particularly from the middle of the second century onward. However, as one traveled northward toward the lower Rhine and Delta areas and northward, it is apparent that there were fewer roads connecting cities, towns and forts with the rural areas (see illustration nineteen in part seven of this story).
” During the RP (Roman Period) an extensive route network developed, connecting many parts of present-day Europe. However in the Netherlands stone-paved Roman roads such as those present in southern Europe are non-existent including the Oude Rijn (The Old Rhine) . . . , was unpaved and consisted of a slightly raised central body hardened with gravel and often encased in wood, flanked by (drainage) ditches. With the exception of this road, built in AD 100 and rebuilt in AD 125, in the Netherlands there is little evidence for the existence of roads dating to the first millennium AD. ” [61]
Rivers, estuaries, and inland waterways such as the Rhine–Meuse system functioned as the main long‑distance transport infrastructure, with rivers offering both opportunities and constraints. They greatly facilitated bulk and high‑volume traffic while making some terrestrial crossings difficult. From the sixth century onward, northern branches of the Rhine in the Netherlands regained geographical importance for transportation, setting the stage for intensified Merovingian river trade and North Sea connections. By the later seventh to eighth centuries, settlements along the Rhine operated within an extensive exchange network. [62]
Along the northern coast (Frisia sensu lato, from Zeeland/North Holland into Groningen and north‑west Germany), terps and levees framed a string of landing places connected by shallow coastal waterways and tidal channels rather than by continuous built roads. Between the 6th and 8th centuries, Frisian communities developed a maritime commercial system whose backbone was seaborne transport and river mouths, tying the coastal Netherlands to England, the Frankish hinterland and up to the Weser–Elbe region. Environmental studies of the Coastal Frisia area and the north seaways indicate ongoing peatland expansion and marine ingressions in parts of the northern Netherlands between about 700 and 1000 CE, which would have both opened and closed local navigable routes and forced shifts in settlement and paths inland. [63]
From the mid‑seventh century, Dorestad at the Rhine bifurcation of the river branches Kromme Rijn and Lek emerged as a major emporium whose position on a high natural levee along a relatively stable Rhine branch offered sheltered harboring and direct access to both inland and North Sea traffic. Dendrochronological and archaeological work shows that Dorestad and earlier coastal sites such as Oegstgeest formed part of a long‑distance network moving timber and other bulk goods along the Rhine–Meuse axis, with riverine transport clearly dominant for heavy cargo. New water routes via branches like the Waal and IJssel gradually shifted the main axes of trade in the late eighth to ninth centuries. In the 400–800 CE time window, river corridors in the Meuse–Rhine basin and coastal inlets were already the critical structuring elements of transport routes and communication, far outweighing any surviving terrestrial “road” infrastructure. [64]
Landscape Archaeological Modeling
The ability to reduce this wide range of possible northward migratory paths is strengthened through the use of results from a growing corpus of interdisciplinary archaeological research that identifies general enduring historical route networks or ‘transport corridors‘. These transport corridors can be viewed as a key to understanding large-scale settlement patterns, possible migratory pattterns, and transportation networks.
This general research approach, refered to as ‘landscape and settlement archaeology‘, presents a general theoretical and methodological perspective in archaeology. This research approach utilizes a number of interdisciplinary methodologies that combine historical environmental and archaeological data with the aim to reconstruct probable routes, called movement zones or corridors (see illustration fourteen in the sidebar discussion). [65]
The research from the landscape archaeological perspective provides historical data to uniquely refine and add geographical and historical context to the estimated genetic migratory path derived from the FamilyTreeDNA Globetrekker program. The Globetrekker program provides a statistically smoothed, large‑scale reconstruction of estimated patrilineal migration paths, while landscape archaeological work on connectivity, historically persistent places, and movement corridors can supply the fine‑grained, time‑specific spatial frameworks needed to interpret those migratory paths in real historical landscapes. Used together, they let you move from an abstract Y‑DNA trajectory to concrete hypotheses about which river valleys, trackways, hubs, and settlement zones specific lineages likely used or avoided in particular periods (see sidebar discussion on Landscape and Settlement Archaeology). [66]
The aim of these studies is to bridge gaps between historical and natural science based approaches in studies of the human past through joint research between archaeologists, historians and geoscientists. They are often framed explicitly as contributions to a broader “landscape‑archaeological” and “connectivity/persistence” program for the Dutch delta in the first millennium CE. [67]
Early medieval land and water transport in the Low Countries emerges from this work as dense, highly structured, and remarkably persistent over the first millennium CE, yet constantly re-routed within a dynamic fluvial landscape and shifting political economy. Together these studies show that a limited set of “movement corridors” along levees and navigable channels dominated connectivity from the Roman period into the Early Middle Ages, with most routes continuing in use for centuries and strongly shaping later medieval and even modern infrastructure. [68]

Landscape and Settlement Archaeology
“Landscape archaeology can be defined as the interdisciplinary investigation of the long-term relation ship between people and their environment.
“Probably the greatest benefit of a landscape – archaeological approach is the way it shifts the focus from a “single-site” perspective to much larger areas that are more closely matched to the physical scale at which human societies operate. Such an approach is in evitably multidisciplinary.
” ‘Landscape’ within this context is defined at a basic level, being “an area, as perceived by people, whose character is the result of the action and interaction of natural and/or human factors.” [69]
Illustration Fourteen: Flowchart of route-persistence calculations

Their work focuses on how environmental factors (like the changing river network) and cultural factors influenced the orientation and use of persistent water and land travel routes or corridors over time.
These researchers utilize a research approach that integrates layers of archaeological settlement data, geomorphological maps, soil and groundwater data and tree ring data within Geographic Information Systems (GIS) models, to understand the long-distance transport routes and their dynamics during the first millennium CE in the Dutch river delta (see illustration two).
This interdisciplinary approach produces predictive models to reconstruct past movement corridors and assess their persistence through time. Route persistence is studied to explain long‑term settlement foci, land‑use patterns, and “persistent places” in cultural landscapes.
Their research uses high‑resolution palaeogeography, geomorphology, soils, elevation and groundwater reconstructions to map where overland movement was physically feasible in different periods. The landscape is treated as a ‘friction surface’ to predict probable corridors rather than single “roads”. They then combine these models with archaeological proxies (settlements, burial grounds, stray finds, shipwrecks, known roads) and dendroarchaeological timber provenance to validate and refine reconstructed networks and identify long‑distance transport zones. [70]
Modelling from these stduies shows that Roman and early medieval transport relied on intertwined road, track and waterway systems, concentrating movement in relatively narrow route zones that together cover just over ten percent of the Dutch surface but contain roughly three quarters or more of known first‑millennium infrastructural and isolated finds. When Roman and early medieval models are compared, around two‑thirds of the reconstructed corridors persist across the entire first millennium CE, and later early‑modern road networks cluster very strongly on these same long‑lived routes, indicating deep historical stability in movement patterns. [71]
The work underlines that Rhine–Meuse–Scheldt lowland rivers were simultaneously prime highways and major constraints. They offered efficient long‑distance water transport but forced terrestrial routes onto specific levee ridges, crevasse splays and sandy outcrops where flooding risk and groundwater conditions allowed year‑round passage. In delta settings minor avulsions and channel shifts might displace paths locally, yet the overall orientation of corridors and the nodal position of certain confluences and crossings remained stable over centuries. [72]
Collectively, these studies argue that the end of Roman rule did not produce a collapse of connectivity in the Low Country. Instead, networks were reorganized within the same physical framework, with many corridors continuing to channel local, regional and long‑distance movement into the Carolingian period. This long‑term route persistence helps explain the endurance of certain settlement locations and the later emergence of medieval towns along these corridors. It demonstrates that any interpretation of early medieval economic or political change in the lowlands must take seriously the constraining and enabling role of the inherited route system and deltaic landscape.
Globetrekker Migratory Paths and Route Persistence in Landscape Archaeology
The methodogical underpinnings of a cost-efficient migratory path associated with the Globetrekker platform is similar to the concept of route persistence found in these paleogeographical studies of the medieval lowlands. Route persistence is defined as the spatial correlation between route sections across different historical periods. It refers to the long-term use of specific movement corridors or locations, not necessarily continuous use, but rather the tendency for routes to reappear in the same general area over centuries (see sidebar discussion). [73]
This concept ‘route persistence’ is used to investigate the stability of historical ‘transport networks’ and the dynamic interaction between human activity (cultural dynamics) and natural landscape changes over time. Route persistence is studied to explain long‑term settlement locations, land‑use patterns, and “persistent places” in cultural landscapes.
The studies use high‑resolution palaeogeography, geomorphology, soils, elevation and groundwater reconstructions to map where overland movement was physically feasible in different periods, treating the landscape as a ‘friction surface’ to predict probable corridors rather than single “roads”. They then combine these models with archaeological proxies (settlements, burial grounds, stray finds, shipwrecks, known roads) and dendroarchaeological timber provenance to validate and refine reconstructed networks and identify long‑distance transport zones.
Network friction is described as the variable that determines regional accessibility based on local and surrounding landscape factors and that locates transport obstacles and possible movement corridors . Through a network-friction analysis, potential movement corridors are determined. [74]
The Key Aspects of ‘Route Persistence’ in Landscape Archaeological Paleogeographic Studies
Spatial Correlation: Persistence is calculated by determining the degree to which route networks from one era (e.g., Roman period) overlap with those from a later era (e.g., Early Middle Ages) using spatial analysis techniques like GIS (Geographic Information Systems).
“Persistent Places”: The term draws on the concept of “persistent places,” locations that were “never” completely abandoned but survived in collective memory or as logical paths dictated by the physical landscape.
Landscape Influence: In dynamic lowland environments such as the Netherlands, the orientation of routes was highly impacted by natural landscape features. Features like rivers, peat marshes, and levees created natural movement corridors, and routes often persisted in these accessible areas unless major landscape changes (like severe flooding or coastline shifts) occurred. Route persistence is framed as part of regional landscape evolution and human–environment interaction.
Dynamic vs. Fixed Routes: Medieval land routes in lowlands were often unpaved “route zones” rather than fixed, narrow roads. Travelers frequently shifted between parallel tracks within a wider corridor due to seasonal conditions (e.g., moisture, wear and tear), contributing to the idea of a persistent corridor rather than a single, rigid line.
Quantifying Stability: Researchers quantify route persistence (as a percentage of overlap) to understand the relative roles of environmental and cultural factors in shaping the landscape over time. For example, studies have shown a high degree of persistence between Roman and early medieval route networks in the Netherlands, indicating the significant influence of the stable environmental conditions of the time. [75]
Possible Migratory Paths for Ancestors of G-Z6748
An interesting 2015 article by Rowin van Lanen, Menne Kosian, Bert Groenewoudt, and Esther Jansma argues that Roman and early-medieval route networks in the Netherlands can be effectively reconstructed by modelling how key landscape characteristics —especially water, peat, and levees—constrained and channelled the movement on land and water around 100 AD and 800 AD . [76] The study’s main goal is to identify landscape prerequisites for route orientation by using spatial modelling of modern and palaeogeographical data for around these two time perods. The researchers calculate network-friction values for different terrain types and hydrological features, producing maps of likely ‘movement corridors’ and incorporating archaeological data on known routes and sites to be integrated and tested against these models.
In this lowland setting, water bodies, peat zones, and river levees emerge as the dominant landscape characteristics structuring where routes could plausibly run, with substantial contrasts between relatively dry Pleistocene sands [77] and wet coastal and deltaic lowlands. The lower western Netherlands is almost impassable in this time period, implying that inhabitants must have relied predominantly on rivers and streams for transport, while levees and better-drained interfluves acted as preferred terrestrial corridors elsewhere.
As depictived in illustration fifteen below, the research by van Lanen and associates show areas that were inaccessible (in red), moderately accessible (in yellow) and accessible (in green) by land.. Based on this integrated method, geoscientific and archaeological data were used to reconstruct Roman and earlymedieval land and water routes.
Illustration Fifteen: Route networks (land and water) overlaid on network-friction maps of the Netherlands: 100 and 800 CE

Research models show that Roman and early medieval transport relied on intertwined road, track and waterway systems, concentrating movement in relatively narrow route zones that together cover just over ten percent of the Dutch surface but contain roughly three quarters or more of known first‑millennium infrastructural and isolated archaeological finds. When Roman and early medieval models are compared, around two‑thirds of the reconstructed corridors persist across the entire first millennium AD, and later early‑modern road networks cluster very strongly on these same long‑lived routes, indicating deep historical stability in movement patterns. [78]
The research underlines that Rhine–Meuse–Scheldt lowland rivers were simultaneously prime highways and major constraints. They offered efficient long‑distance water transport but forced terrestrial routes onto specific levee ridges, crevasse splays and sandy outcrops where flooding risk and groundwater conditions allowed year‑round passage. In delta settings this created a ‘braided but structured mosaic’ in which minor avulsions and channel shifts might displace paths locally, yet the overall orientation of corridors and the nodal position of certain confluences and crossings remained stable over centuries. [79]
In another research study, using dendrochronological provenancing of oak timbers (see side bar dicsussion), Jansma, Van Lanen and colleagues reconstruct shifting regional timber flows linking the Netherlands to the German Rhineland, Ardennes–Meuse basin and Scheldt region, and then overlay these with the route models to infer likely long‑distance transport routes. The timber data show changing “frequent‑travel zones” through the first millennium. The Roman‑period flows heavily Rhine‑oriented, with later early medieval phases indicating re‑routed connections and renewed river trade—yet these shifts still track the same core movement corridors identified by the landscape based models.
Esther Jansma , Rowin Van Lanen and Harm Jan Pierik, have provided a short journal contribution that focuses on the Low Countries, specifically the Dutch river delta, and integrates fluvial history with archaeological evidence to reconstruct transport routes over the first millennium CE. The authors identify major river branches and channels that were navigable or strategically important at different times, showing that shifts in discharge and avulsion altered which routes were most suitable for long‑distance movement. They highlight that the delta landscape, with its alluvial ridges and natural levees, offered persistent corridors for habitation and movement, even as flooding frequency and local conditions changed.
Dendrochronological Provenancing
Dendrochronological provenancing uses tree-ring analysis (dendrochronology) to determine the geographical origin (provenance) of wood in historical artifacts, buildings, or artworks, not just their age. By matching the unique patterns of wide and narrow rings (influenced by local climate) from an unknown sample to established regional chronologies, researchers identify the source area, often combining ring-width data with chemical analysis (like Sr isotopes) for greater accuracy, especially for timber from complex areas like shipwrecks or Roman structures. [80]
“Archaeological remnants of movable wooden objects are well suited for reconstructing past spatial connections because of the following characteristics:
• swift transport and direct application (construction timber);
• river-bound distribution (shipwrecks);
• direct geographical links with the economic hinterland (barrels); and
• high dating precision through dendrochronology.
“Absolutely dated dendrochronological time series derived from such objects can be regarded as an integrator of environmental and cultural information, since archaeological wood is the residue of both the site conditions that governed annual tree growth and human activity such as the felling, transport and application of these trees.“ [81]
Jansma and associates indicate that during this time period several new river branches formed. As a result economic activity shifted from the central and western parts of the delta to the east (see illustrations sixteen and seventeen).
Illustration Sixteen: Long-distance transport routes in the Netherlands during the Roman Period

Illustration Seventeen: Long-distance transport routes in the Netherlands during the Early Middle Ages

In view of the ‘cost-efficient’ migratory path for the Griff(is)(es)(ith) YDNA line generated by the Globetrekker program (illustration five above), one can add historical context to the migratory path using the results of the study by Jansma and associates (illustration seventeen). It is possible that ancestors of the MCRA of haplogroup G-Z6748 migrated through the changing delta and watershed landscape and utilized what is refered to as the north south corridor to migrate northward via water routes (see illustration eighteen).
Illustration Eighteen: Estimated Migratory Path of G-Z6748 Ancestors Based on Long Distance Alluvial – Water Transport Routes in Early Middle Ages

The corridor runs roughly north–south across the central–eastern delta (Veluwe/IJssel–Nijmegen–Maas zone), exploiting relatively high, well‑drained ridges and fossil levees that remained passable under rising groundwater and increased flooding. The corridor acted as a backbone between upstream Rhine–Meuse reaches and more northerly and easterly areas, integrating riverine shipping with overland traffic and channelling timber and other bulk goods into and out of the delta.
The north–south corridor is presented as a long‑lived, high‑priority axis of movement that linked the central Rhine–Meuse delta to inland regions and helped maintain regional connectivity despite major changes in river courses and periods of flooding. The corridor exemplifies how terrestrial corridors on elevated levees and higher ground between two rivers stabilize the transport system when fluvial routes shifted or became less reliable.
Landscape archaeological modelling work cited alongside Jansma et al. shows that this north–south zone is one of the most persistent movement corridors: a high proportion of Roman routes in this band were reused or re‑established in early medieval and later networks, and it envelops several later historic towns (e.g. Arnhem, Deventer, Nijmegen). The corridor demonstrates that long‑distance exchange in the first millennium AD depended less on any single river branch and more on a composite system in which enduring overland corridors like this one absorbed and redirected flows when channels avulsed, thereby dampening the impact of environmental instability on migration, trade and communication. [82]
Sources:
Feature Image: The banner depicts the complementary nature of melding the methodologies of the FamilyTreeDNA Globetrekker program with graphic results from the Landscape Archaeological tradition for graphically portraying the migratory path to the ancestor of haplogroup G-6848. The left hand image is a map of the estimated migratory path of ancestors of the Most Recent Ancestor of G-Z6748. The middle images are the scientific details for the estimated birth date for the most recent common ancestor associated with haplogroup G-Z6748. The right hand map depicts a specific migratory path of ancestors of the Most Recent Ancestor of G-Z6748 based on persistent long-distance transport routes in the Netherlands during the Roman period and Early Middle Ages.
[1] See for example:
Cheyette, F. L. , The disappearance of the ancient landscape and the climatic anomaly of the early Middle Ages: A question to be pursued. Early Medieval Europe, 16(2), 2008, 127–165. https://www.academia.edu/395947/The_Disappearance_of_the_Ancient_Landscape_and_the_Climatic_Anomaly_of_the_Early_Middle_Ages_a_Question_to_Be_Pursued
Rowin J van Lanen and Bert Groenewoudt, Counting heads: Post-Roman population decline in the Rhine-Meuse delta (the Netherlands) and the need for more evidence-based reconstructions, in Niall Brady & Claudia Theune, eds, Settlement Change Across Medieval Europe: Old paradigms and New Vistas, , 2019, Ruralia XII, Leiden; Sidestone, 2019, https://www.academia.edu/40523376/Counting_heads_Post_Roman_population_decline_in_the_Rhine_Meuse_delta_the_Netherlands_and_the_need_for_more_evidence_based_reconstructions
Groenewoudt, Bert, Diverging decline. Reconstructing and validating (post-)Roman population trends (AD 0-1000) in the Rhine-Meuse delta (the Netherlands), European Journal of Postclassical Archaeologies (PCA), vol 8, 2018, 189-218, https://www.academia.edu/37462618/Diverging_decline_Reconstructing_and_validating_post_Roman_population_trends_AD_0_1000_in_the_Rhine_Meuse_delta_the_Netherlands_
Pierik HJ. Landscape changes and human–landscape interaction during the first millennium AD in the Netherlands. Netherlands Journal of Geosciences, Volume 100, e11. https://doi.org/10.1017/njg.2021.8
Pierik, Harm Jan, and Rowin J. van Lanen. “Roman and early-medieval habitation patterns in a delta landscape: The link between settlement elevation and landscape dynamics.” Quaternary International 501 (2019): 379-392. https://www.sciencedirect.com/science/article/abs/pii/S1040618216313453
[2] Pierik HJ. Landscape changes and human–landscape interaction during the first millennium AD in the Netherlands. Netherlands Journal of Geosciences, Volume 100, e11. https://doi.org/10.1017/njg.2021.8
See the section “The Late-Roman Social and Demographic Collapse” in part seven of this story, The Turbulent Roman Era – The Griff(is)(es)(ith) Y-DNA Phylogenetic Gap Associated with the Meuse and Rhine River Watershed – Part Seven, November 30, 2025, Griffis Family Blog.
de Bruin, Jasper, Connectivity in the south-western part of the Netherlands during the Roman period (AD 0-350), Analecta Praehistorica Leidensia, 43/44, 145 – 157, https://www.academia.edu/30199226/Connectivity_in_the_south_western_part_of_the_Netherlands_during_the_Roman_period_AD_0_350_?email_work_card=view-paper
Kluiving, Sjoerd, Mass migration through soil exhaustion: Transformation of habitation patterns in the southern Netherlands (1000 BC–500AD), Catena (2015), http://dx.doi.org/10.1016/j.catena.2014.12.015 , https://www.academia.edu/20652957/Mass_migration_through_soil_exhaustion_Transformation_of_habitation_patterns_in_the_southern_Netherlands_1000_BC_500AD_?email_work_card=view-paper
[3] Pierik HJ. Landscape changes and human–landscape interaction during the first millennium AD in the Netherlands. Netherlands Journal of Geosciences, Volume 100, e11. https://doi.org/10.1017/njg.2021.8
[4] FamilyTreeDNA’s “Scientific Details” confidence intervals for haplogroups are derived from their Time to Most Recent Common Ancestor (TMRCA) modeling, which combines the observed genetic variation on each branch with calibrated mutation rates and then summarizes the resulting age uncertainty as statistical intervals. For each haplogroup branch, FTDNA measures its “stem length” in mutations (primarily SNPs, with STRs integrated for very young lineages) and relates this to time using a mutation rate model.
The basic relationship for the mutation rate model is T = D /(2μ), where T is the TMRCA, D is the genetic distance (number of differences between descendants), and μ is the mutation rate. This relationship is statistically ‘refined’ across the whole tree using methods such as linear regression, mean path lengths, maximum likelihood, or relaxed molecular clocks.
Rather than reporting only a single age (“Mean”), FTDNA fits a probability distribution for the branch age that accounts for stochastic mutation processes, rate variation among stems, and tree structure.
The confidence interval (CI) shown in Scientific Details is the time range that contains a chosen proportion of that distribution (for example, 68%, 95%, or 99% of the total probability), so the narrow, dark band is a higher‑probability, tighter interval and the lighter, wider band is a lower‑probability but more inclusive range.
On a Discover haplogroup page, the Age Estimate section lists a mean age plus one or more CIs; the legend notes that “CI is the Confidence Interval for a given time range and Mean is the average age estimate,” making clear that the interval is a probabilistic range around the model’s best estimate.
The same underlying methodology is applied across the Y haplotree, with parameters tuned and periodically updated as tree structure, calibration points (including well‑dated historical lineages and selected ancient DNA samples), and rate models are refined. When the algorithm is updated, both the point estimates and their confidence intervals for affected branches can shift.
See: Scientific Details: A Deeper Dive Into Age Estimates, 19, Sep 2022, FTDNA Blog, https://blog.familytreedna.com/tmrca-age-estimates-scientific-details/
[5] The Migration Period (c. 300–700 AD) was a pivotal era in European history, also known as the Barbarian Invasions, characterized by large-scale movements of Germanic, Slavic, and other peoples into and across the declining Western Roman Empire, leading to its collapse, the formation of new post-Roman kingdoms, and shaping modern European cultures and identities. Triggered by factors like Hunnic pressure, climate change, and Roman internal struggles, groups like the Goths, Franks, Vandals, and Slavs settled former Roman territories, transitioning Europe from Late Antiquity into the Early Middle Ages.
Migration Period, Wikipedia, This page was last edited on 19 December 2025, https://en.wikipedia.org/wiki/Migration_Period
[6] After the Roman withdrawal, the main “indigenous” power blocs in the lands of the modern Netherlands are usually identified as Franks in the south, Frisians along the coastal north, and Saxon-identified groups in the east, with all three the result of early medieval ethnogenesis rather than direct continuation of Roman-period tribes. Archaeology and anthropology also stress strong regional continuity from late Roman provincial and “native” communities, so these labels mask a heterogeneous population incorporating Batavian, Cananefatian, Chamavian and other pre-Roman/Roman-period groups.
Political Map of Europe, 651 CE

Netherlands in the Early Middle Ages, Wikipedia, This page was last edited on 2 December 2025, https://en.wikipedia.org/wiki/Netherlands_in_the_Early_Middle_Ages
[7] Netherlands in the Early Middle Ages, Wikipedia, This page was last edited on 2 December 2025, https://en.wikipedia.org/wiki/Netherlands_in_the_Early_Middle_Ages
Frisian–Frankish wars, Wikipedia, This page was last edited on 21 December 2025, https://en.wikipedia.org/wiki/Frisian–Frankish_wars
[8] van Lanen RJ. Revealing the past through modelling? Reflections on connectivity, habitation and persistence in the Dutch Delta during the 1st millennium AD. Netherlands Journal of Geosciences, Volume 99, e14. https://doi.org/10.1017/njg.2020.12
[9] Helama, Samuli and P. Jones, Keith Briffa, Keith, Dark Ages Cold Period: A literature review and directions for future research, February 2017, The Holocene 27(10): 095968361769389, DO – 10.1177/0959683617693898,
https://www.researchgate.net/publication/314130365_Dark_Ages_Cold_Period_A_literature_review_and_directions_for_future_research
[10] Knol, Egge, ‘Living Near the Sea: The Organisation of Frisia in Early Medieval Times’, in Jayne Carroll, Andrew Reynolds, and Barbara Yorke (eds), Power and Place in Europe in the Early Middle Ages, Proceedings of the British Academy (London
, 2019; online edn, British Academy Scholarship Online, 21 May 2020), https://doi.org/10.5871/bacad/9780197266588.003.0017
Netherlands in the Early Middle Ages, Wikipedia, This page was last edited on 2 December 2025, https://en.wikipedia.org/wiki/Netherlands_in_the_Early_Middle_Ages
Terps: Ancient Dwelling Mounds of the North Sea Coast, Ealdlar, https://ealdlar.com/history/terps
Scheurle, Carolyn, Climate development and its effect on the North Sea environment, PhD Dissertation, University of Bremen 2004, https://d-nb.info/975465481/34
[11] The Medieval Climate Anomaly (MCA), also known as the Medieval Warm Period (MWP) or Optimum, was a natural, regional climate event (roughly 900-1300 CE) marked by warmer temperatures
Knol, Egge, ‘Living Near the Sea: The Organisation of Frisia in Early Medieval Times’, in Jayne Carroll, Andrew Reynolds, and Barbara Yorke (eds), Power and Place in Europe in the Early Middle Ages, Proceedings of the British Academy (London
, 2019; online edn, British Academy Scholarship Online, 21 May 2020), https://doi.org/10.5871/bacad/9780197266588.003.0017,
Terps: Ancient Dwelling Mounds of the North Sea Coast, Ealdlar, https://ealdlar.com/history/terps
Weather in History 500 to 750AD, weatherwebdotnet, Accesssed 12 Dec 2025, https://premium.weatherweb.net/weather-in-history-500-to-750ad/
Medieval Warm peiod, Wikipedia, This page was last edited on 29 December 2025, https://en.wikipedia.org/wiki/Medieval_Warm_Period
[12] Knol E, Ijssennagger N. Palaeogeography and People: Historical Frisians in an archaeological light. In: Hines J, IJssennagger N, eds. Frisians and Their North Sea Neighbours: From the Fifth Century to the Viking Age. Boydell & Brewer; 2017:5-24. https://resolve.cambridge.org/core/books/abs/frisians-and-their-north-sea-neighbours/palaeogeography-and-people-historical-frisians-in-an-archaeological-light/CA5BEE0DAC45640D30C3E40FBDC11C49
Terps: Ancient Dwelling Mounds of the North Sea Coast, Ealdlar, https://ealdlar.com/history/terps
Faber, Hans, A Frontier Known as Watery Mess: the Coast of Flanders, 8 Aug 2021, Frisia Coast Trail Blog, https://frisiacoasttrail.blog/2021/08/08/the-frontier-collectively-known-as-watery-mess-the-coast-flanders/
[13] Knol E, Ijssennagger N. Palaeogeography and People: Historical Frisians in an archaeological light. In: Hines J, IJssennagger N, eds. Frisians and Their North Sea Neighbours: From the Fifth Century to the Viking Age. Boydell & Brewer; 2017:5-24. https://resolve.cambridge.org/core/books/abs/frisians-and-their-north-sea-neighbours/palaeogeography-and-people-historical-frisians-in-an-archaeological-light/CA5BEE0DAC45640D30C3E40FBDC11C49
Netherlands in the Early Middle Ages, Wikipedia, This page was last edited on 2 December 2025, https://en.wikipedia.org/wiki/Netherlands_in_the_Early_Middle_Ages
Ogden, Frank, Frankish Law and the Wergeld in the Early Middle Ages, 9 Nov 2020, Ancient, Medieval and Renaissance Studies Program, https://sites.owu.edu/trident/2020/11/09/frankish-law-and-the-wergeld-in-the-early-middle-ages-by-drake-ogden/
Germanic Law, Wikipedia, This page was last edited on 3 December 2025, https://en.wikipedia.org/wiki/Germanic_law
Loveluck C. Context. In: Northwest Europe in the Early Middle Ages, c.AD 600–1150: A Comparative Archaeology. Cambridge University Press; 2013:1-30. https://www.cambridge.org/core/books/abs/northwest-europe-in-the-early-middle-ages-cad-6001150/context/EF9A12D59EB8F07015B489604E75D998
[14] Netherlands in the Early Middle Ages, Wikipedia, This page was last edited on 2 December 2025, https://en.wikipedia.org/wiki/Netherlands_in_the_Early_Middle_Ages
[15] Nicolay, J.A.W. & Nieuwhof, A. “Immobile farmers? The geographical mobility and cultural identity of early medieval Frisians.” Medieval Settlement Research, 2018, 33: 21-31
Knol E, Ijssennagger N. Palaeogeography and People: Historical Frisians in an archaeological light. In: Hines J, IJssennagger N, eds. Frisians and Their North Sea Neighbours: From the Fifth Century to the Viking Age. Boydell & Brewer; 2017:5-24. https://resolve.cambridge.org/core/books/abs/frisians-and-their-north-sea-neighbours/palaeogeography-and-people-historical-frisians-in-an-archaeological-light/CA5BEE0DAC45640D30C3E40FBDC11C49
[16] Netherlands in the Early Middle Ages, Wikipedia, This page was last edited on 2 December 2025, https://en.wikipedia.org/wiki/Netherlands_in_the_Early_Middle_Ages
Frisian–Frankish wars, Wikipedia, This page was last edited on 21 December 2025, https://en.wikipedia.org/wiki/Frisian–Frankish_wars
Pierik HJ. Landscape changes and human–landscape interaction during the first millennium AD in the Netherlands. Netherlands Journal of Geosciences. 2021;100:e11. doi:10.1017/njg.2021.8 , https://www.cambridge.org/core/journals/netherlands-journal-of-geosciences/article/landscape-changes-and-humanlandscape-interaction-during-the-first-millennium-ad-in-the-netherlands/3664067EC3153C9C9B99EBB4871CB770
[17] Harm Jan Pierik, Rowin J. van Lanen, Roman and early-medieval habitation patterns in a delta landscape: The link between settlement elevation and landscape dynamics, Quaternary International, Volume 501, Part B, 2019, Pages 379-392, ISSN 1040-6182, https://doi.org/10.1016/j.quaint.2017.03.010 .
(https://www.sciencedirect.com/science/article/pii/S1040618216313453 )
Pierik HJ. Landscape changes and human–landscape interaction during the first millennium AD in the Netherlands. Netherlands Journal of Geosciences. 2021;100:e11. doi:10.1017/njg.2021.8 , https://www.cambridge.org/core/journals/netherlands-journal-of-geosciences/article/landscape-changes-and-humanlandscape-interaction-during-the-first-millennium-ad-in-the-netherlands/3664067EC3153C9C9B99EBB4871CB770
Netherlands in the Early Middle Ages, Wikipedia, This page was last edited on 2 December 2025, https://en.wikipedia.org/wiki/Netherlands_in_the_Early_Middle_Ages
[18] Early medieval farms like those near Roomburg and at De Geer in the Rhine delta were small, subsistence focused agricultural settlements with rectangular longhouses, barns, and outbuildings, often clustered in small groups (farmsteads) utilizing the fertile but flood-prone river landscape, with some (like Koudekerk near Roomburg) potentially part of larger estates, showing adaptation from Roman patterns to more localized, community based farming, relying on mixed farming and local resources for survival.
Key Characteristics:
- Location and Landscape: Situated on levees or higher ground within the dynamic Rhine-Meuse delta, often bisected by old river channels (crevasses) used for drainage, with settlements like De Geer and Koudekerk showing this adaptation.
- Farm Layout: Comprised of rectangular longhouses (around 6x20m) for living and animals, plus other structures like storage buildings, hen houses, and possibly pit houses, forming distinct farmsteads.
- Economic Focus: Primarily subsistence-oriented, focusing on local food production, using basic agricultural technology (animal traction and ploughs were known) and mixed farming (crops, livestock).
- Community Structure: Often small clusters of farmsteads, possibly forming small villages, with a communal, practical layout rather than planned towns.
- Relation to Larger Systems: Certain farm sites like Koudekerk near Roomburg might have been part of larger estates (like Holtlant) or functioned as toll points for the Carolingian realm, indicating some integration into broader economies.
- Continuity and Change: Farms showed continuity from Late Roman times in habitation patterns, but shifted towards smaller, more permanent settlements compared to the earlier dispersed Roman villas, with increased focus on local, intensive farming practices over time.
See:
W.A. van Es & W.J.H. Verwers, Early Medieval settlements along the Rhine: precursors and contemporaries of Dorestad, Journal of Archaeology in the Low Countries, 2-1 (May 2010), https://jalc.nl/cgi/t/text/get-pdfcfad.pdf?c=jalc%3Bidno%3D0201a01
Pierik HJ. Landscape changes and human–landscape interaction during the first millennium AD in the Netherlands. Netherlands Journal of Geosciences. 2021;100:e11. doi:10.1017/njg.2021.8 , https://www.cambridge.org/core/journals/netherlands-journal-of-geosciences/article/landscape-changes-and-humanlandscape-interaction-during-the-first-millennium-ad-in-the-netherlands/3664067EC3153C9C9B99EBB4871CB770
[19] See:
Harm Jan Pierik, Rowin J. van Lanen, Roman and early-medieval habitation patterns in a delta landscape: The link between settlement elevation and landscape dynamics, Quaternary International, Volume 501, Part B, 2019, Pages 379-392, ISSN 1040-6182, https://doi.org/10.1016/j.quaint.2017.03.010 .
(https://www.sciencedirect.com/science/article/pii/S1040618216313453 )
Kosian, Menne and Henk Weerts, Rowin Van Lanen, Jaap Evert Abrahamse, The City and the River. The early medieval Emporium (trade centre) of Dorestad; integrating physical geography with archaeological data in changing environments, International Conference on Cultural Heritage and New Technologies, Vienna, 2012, https://chnt.at/wp-content/uploads/eBook_CHNT17_Kosian.pdf
van Dinter, Marieke, Living along the Limes Landscape and settlement in the Lower Rhine Delta during Roman and Early Medieval times, 23 Aug 1970, Utrecht Studies in Earth Sciences 135, https://www.academia.edu/35123998/Living_along_the_Limes_Landscape_and_settlement_in_the_Lower_Rhine_Delta_during_Roman_and_Early_Medieval_times
[20] Netherlands in the Early Middle Ages, Wikipedia, This page was last edited on 2 December 2025, https://en.wikipedia.org/wiki/Netherlands_in_the_Early_Middle_Ages
Netherlands in the Early Middle Ages, Wikipedia, This page was last edited on 2 December 2025, https://en.wikipedia.org/wiki/Netherlands_in_the_Early_Middle_Ages
Faber, Hans, The Batwing Doors of Dorestad. A Two-Way Gateway of Trade and Power, 16 Oct 2020, Frisia Coast Trail Blog, https://frisiacoasttrail.blog/2020/10/26/dorestat/
Kosian, Menne and Henk Weerts, Rowin Van Lanen, Jaap Evert Abrahamse, The City and the River. The early medieval Emporium (trade centre) of Dorestad; integrating physical geography with archaeological data in changing environments, International Conference on Cultural Heritage and New Technologies, Vienna, 2012, https://chnt.at/wp-content/uploads/eBook_CHNT17_Kosian.pdf
[21] Faber, Hans, Well, the Thing Is …, 5 Sep 2021, Frisia Trail Coast Blog, https://www.frisiacoasttrail.com/post/the-thing-is
Netherlands in the Early Middle Ages, Wikipedia, This page was last edited on 2 December 2025, https://en.wikipedia.org/wiki/Netherlands_in_the_Early_Middle_Ages
Frisian–Frankish wars, Wikipedia, This page was last edited on 21 December 2025, https://en.wikipedia.org/wiki/Frisian–Frankish_wars
W.A. van Es & W.J.H. Verwers, Early Medieval settlements along the Rhine: precursors and contemporaries of Dorestad, Journal of Archaeology in the Low Countries, 2-1 (May 2010), https://jalc.nl/cgi/t/text/get-pdfcfad.pdf?c=jalc%3Bidno%3D0201a01
[22] Netherlands in the Early Middle Ages, Wikipedia, This page was last edited on 2 December 2025, https://en.wikipedia.org/wiki/Netherlands_in_the_Early_Middle_Ages
Kosian, Menne and Henk Weerts, Rowin Van Lanen, Jaap Evert Abrahamse, The City and the River. The early medieval Emporium (trade centre) of Dorestad; integrating physical geography with archaeological data in changing environments, International Conference on Cultural Heritage and New Technologies, Vienna, 2012, https://chnt.at/wp-content/uploads/eBook_CHNT17_Kosian.pdf
Faber, Hans, The Batwing Doors of Dorestad. A Two-Way Gateway of Trade and Power, 16 Oct 2020, Frisia Coast Trail Blog, https://frisiacoasttrail.blog/2020/10/26/dorestat/
van Popta, Y.T., Westerdahl, C.L. and Duncan, B.G. (2019), Maritime Culture in the Netherlands: accessing the late medieval maritime cultural landscapes of the north-eastern Zuiderzee. International Journal of Nautical Archaeology, 48: 172-188. https://doi.org/10.1111/1095-9270.12333
[23] Pierik HJ. , Landscape changes and human–landscape interaction during the first millennium AD in the Netherlands. Netherlands Journal of Geosciences, Volume 100, e11. https://doi.org/10.1017/njg.2021.8
P.C. Vos & E. Knol, Holocene landscape reconstruction of the Wadden Sea area between Marsdiep and Weser, Netherlands Journal of Geosciences — Geologie en Mijnbouw ,94 – 2, 157–183, 2015, https://www.waddenacademie.nl/fileadmin/inhoud/pdf/03-Thema_s/Geowetenschap/vos_knol.pdf
Kaspers, Angelique, From sherds to settlement patterns – new insights into the habitation history of the coastal area of the northern Netherlands during the Merovingian and Carolingian periods (AD 400-900) based on field surveys and older collections research, Settlement and Coastal Research in the Southern North Sea Region (SCN), 46, 115-189, Rahden/Westf, 2023, https://www.academia.edu/123867114/From_sherds_to_settlement_patterns_new_insights_into_the_habitation_history_of_the_coastal_area_of_the_northern_Netherlands_during_the_Merovingian_and_Carolingian_periods_AD_400_900_based_on_field_surveys_and_older_collections_research
Hines, John, and Nelleke IJssennagger-van der Pluijm, editors. Frisians of the Early Middle Ages. NED-New edition, Boydell & Brewer, 2021. JSTOR, https://doi.org/10.2307/j.ctv199tj69
H.J. Pierika, K.M. Cohena,, P.C. Vos, A.J.F. van der Spekd, E. Stouthamer, Late Holocene coastal-plain evolution of the Netherlands: the role of natural preconditions in human-induced sea ingressions, Proceedings of the Geologists’ Association 128 (2017) 180–197, https://dspace.library.uu.nl/bitstream/handle/1874/348622/late.pdf
[24] Pierik HJ. Landscape changes and human–landscape interaction during the first millennium AD in the Netherlands. Netherlands Journal of Geosciences, Volume 100, e11. https://doi.org/10.1017/njg.2021.8
[25] Pierik HJ. Landscape changes and human–landscape interaction during the first millennium AD in the Netherlands. Netherlands Journal of Geosciences, Volume 100, e11. https://doi.org/10.1017/njg.2021.8
[26] Pierik HJ. Landscape changes and human–landscape interaction during the first millennium AD in the Netherlands. Netherlands Journal of Geosciences, Volume 100, e11. https://doi.org/10.1017/njg.2021.8
[27] The GlobeTrekker computer program integrates genetic, geological, and anthropological evidence to reconstruct global paternal migration histories. It visualizes how each YDNA haplogroup, down to an individual’s terminal SNP, fits within humanity’s evolving distribution through Ice Age sea-levels, population dispersals, and environmental corridors.
In FamilyTreeDNA’s GlobeTrekker system, corridor paths represent least-cost migration corridors (LCCs) — probabilistic zones indicating the most likely routes Y-DNA lineages followed between ancestral haplogroup locations. GlobeTrekker identifies each ancestral haplogroup’s probable position and then connects them using these cost-efficient routes that consider:
- Past topography and sea levels, including exposed Ice Age land bridges and glacial boundaries.;
- Slope steepness (to avoid rugged terrain);
- Distance to land (favoring coastlines); and, if appropriate,
- Ocean current direction and strength (penalizing movement against currents).
The corridor paths serve as migration ‘confidence envelopes’, capturing the uncertainty inherent in reconstructing prehistorical movement based on environmental and genetic data. They combine data from Big Y testers, ancient DNA, and ecogeographic models to show how and where paternal lineages likely spread worldwide over tens of millennia. The visible “corridor bands” in GlobeTrekker are explicitly tied to likelihood percentages, but the single thin line itself is just the minimum-cost path within those bands rather than a separately quantified probability.
See:
Vilar, Miguel, Join us on this extraordinary voyage through time and genetics, where every strand of DNA is a thread in the tapestry of human history, FTDNA Blog, 26 Sep 2023, https://blog.familytreedna.com/globetrekker-history/
Maier, Paul, Globetrekker, Part 2: Advancing the Science of Phylogeography, 15 Aug, 2023, https://blog.familytreedna.com/globetrekker-analysis/
[28] Texel, Wikipedia, This page was last edited on 26 November 2025, https://en.wikipedia.org/wiki/Texel
List of Islands of the Netherlands, Wikipedia, This page was last edited on 1 August 2025, https://en.wikipedia.org/wiki/List_of_islands_of_the_Netherlands
[29] The creation of Texel, Texel, https://www.texel.net/en/about-texel/history/the-creation-of-texel/
Texel, Wikipedia, This page was last edited on 26 November 2025, https://en.wikipedia.org/wiki/Texel
[30] Pierik HJ. Landscape changes and human–landscape interaction during the first millennium AD in the Netherlands. Netherlands Journal of Geosciences, Volume 100, e11. https://doi.org/10.1017/njg.2021.8 ; for access to the article: https://www.researchgate.net/publication/351236350_Landscape_changes_and_human-landscape_interaction_during_the_first_millennium_AD_in_the_Netherlands
[31] “Geomorphological” relates to geomorphology, the scientific study of landforms, their origins, evolution, and the processes (like erosion, weathering, tectonics) that shape them, aiming to understand why landscapes look the way they do and how they change over time due to natural forces and human activity. It’s a core part of physical geography, using field observation, modeling, and technology to analyze features from river valleys and coastlines to mountain ranges.
Geomophology, Wikipedia, This page was last edited on 5 November 2025, https://en.wikipedia.org/wiki/Geomorphology
[32] Jansma, Esther, Hydrological disasters in the NW-European Lowlands during the first millennium AD: a dendrochronological reconstruction, Netherlands Journal of Geosciences, Volume 99, e11. https://doi.org/ 10.1017/njg.2020.10 https://www.academia.edu/44188764/Jansma_E_2020_Hydrological_disasters_in_the_NW_European_Lowlands_during_the_first_millennium_AD_a_dendrochronological_reconstruction
For another study that focuses on the Rhine River flooding, see:
Toonen, W.H.J., Donders, T.H., Van der Meulen, B., Cohen, K.M. and Prins, M.A. 2013. A composite Holocene palaeoflood chronology of the Lower Rhine. In W.H.J Toonen (ed.), A Holocene Flood Record of the Lower Rhine, Utrecht Studies in Earth Sciences 41: 137–150.
[33] Jansma, Esther, Hydrological disasters in the NW-European Lowlands during the first millennium AD: a dendrochronological reconstruction, Netherlands Journal of Geosciences, Volume 99, e11. https://doi.org/ 10.1017/njg.2020.10 https://www.academia.edu/44188764/Jansma_E_2020_Hydrological_disasters_in_the_NW_European_Lowlands_during_the_first_millennium_AD_a_dendrochronological_reconstruction
[34] Frisia, Wikipedia, This page was last edited on 29 November 2025, https://en.wikipedia.org/wiki/Frisia
Flierman R. Mirror Histories: Frisians and Saxons from the First to the Ninth Century AD. In: Hines J, IJssennagger-van der Pluijm N, eds. Frisians of the Early Middle Ages. Studies in Historical Archaeoethnology. Boydell & Brewer; 2021:223-248, https://research-portal.uu.nl/ws/portalfiles/portal/232053797/mirror-histories-frisians-and-saxons-from-the-first-to-the-ninth-century-ad.pdf
[35] Terp, Wikipedia, This page was last edited on 17 August 2025, https://en.wikipedia.org/wiki/Terp
A. Nieuwhof, M. Bakker, E. Knol, G.J. de Langen, J.A.W. Nicolay, D. Postma, M. Schepers, T.W. Varwijk, P.C. Vos, Adapting to the sea: Human habitation in the coastal area of the northern Netherlands before medieval dike building, Ocean & Coastal Management, Volume 173, 2019, Pages 77-89, ISSN 0964-5691, https://doi.org/10.1016/j.ocecoaman.2019.02.014 .
(https://www.sciencedirect.com/science/article/pii/S0964569118307348 )
[36] Terps: Ancient Dwelling Mounds of the North Sea Coast, no date, Ealdlar, https://ealdlar.com/history/terps
See also:
Nicolay, J.A.W. & Nieuwhof, A. (2018). “Immobile farmers? The geographical mobility and cultural identity of early medieval Frisians.” Medieval Settlement Research, 33: 21-31,
Nieuwhof, Annet, Discontinuity in the Northern-Netherlands coastal area at the end of the Roman Period, in: Transformations in North-Western Europe (AD 300-1000) Proceedings of the 60th Sachsen symposion 19.-23. September 2009 Maastricht”, Hanover: Die Publishing Company, 2011, https://www.academia.edu/1449600/Discontinuity_in_the_Northern_Netherlands_coastal_area_at_the_end_of_the_Roman_Period
[37] Progradation is the geological process where a landform, like a river delta, beach, or alluvial fan, builds outward into a body of water (seaward or basinward) due to continuous sediment accumulation, causing the shoreline to advance, often linked to sea-level fall or high sediment supply.
Progradation, Wikipeida, This page was last edited on 14 August 2025, https://en.wikipedia.org/wiki/Progradation
[38] Terps: Ancient Dwelling Mounds of the North Sea Coast, Ealdlar, https://ealdlar.com/history/terps
A. Nieuwhof, M. Bakker, E. Knol, G.J. de Langen, J.A.W. Nicolay, D. Postma, M. Schepers, T.W. Varwijk, P.C. Vos, Adapting to the sea: Human habitation in the coastal area of the northern Netherlands before medieval dike building, Ocean & Coastal Management, Volume 173, 2019, Pages 77-89, ISSN 0964-5691, https://doi.org/10.1016/j.ocecoaman.2019.02.014 .
(https://www.sciencedirect.com/science/article/pii/S0964569118307348 )
J. Bazelmans Joseph and D. Meier, A. Nieuwhof, T. Spekc, P. Vos, Understanding the cultural historical value of the Wadden Sea region. The co-evolution of environment and society in the Wadden Sea area in the Holocene up until early modern times (11,700 BCe1800 AD): An outline, Ocean & Coastal Management 68 (2012) 114-126, https://www.waddenacademie.nl/fileadmin/inhoud/pdf/04-bibliotheek/Themanummer_OCMA/11_Understanding_the_cultural_historical_value_of_the_Wadden_Sea_region_OCMA.pdf
Knol, Egge, ‘Living Near the Sea: The Organisation of Frisia in Early Medieval Times’, in Jayne Carroll, Andrew Reynolds, and Barbara Yorke (eds), Power and Place in Europe in the Early Middle Ages, Proceedings of the British Academy (London
, 2019; online edn, British Academy Scholarship Online, 21 May 2020), https://doi.org/10.5871/bacad/9780197266588.003.0017
[39] A. Nieuwhof, M. Bakker, E. Knol, G.J. de Langen, J.A.W. Nicolay, D. Postma, M. Schepers, T.W. Varwijk, P.C. Vos, Adapting to the sea: Human habitation in the coastal area of the northern Netherlands before medieval dike building, Ocean & Coastal Management, Volume 173, 2019, Pages 77-89, ISSN 0964-5691, https://doi.org/10.1016/j.ocecoaman.2019.02.014 .
(https://www.sciencedirect.com/science/article/pii/S0964569118307348 )
Reiß, A., Hadler, H., Wilken, D., Majchczack, B. S., Blankenfeldt, R., Bäumler, S., Ickerodt, U., Klooß, S., Willershäuser, T., Rabbel, W., and Vött, A.: The Trendermarsch sunken in the Wadden Sea (North Frisia, Germany) – reconstructing a drowned medieval cultural landscape with geoarchaeological and geophysical investigations, E&G Quaternary Sci. J., 74, 37–57, https://doi.org/10.5194/egqsj-74-37-2025 , 2025. See additional link https://egqsj.copernicus.org/articles/74/37/2025/
Bakker, M., The Nature and Dynamics of Pre-Roman Iron Age and Roman Iron Age Reclamation Settlements in the (Former) Peat and Clay-On-Peat Area of Friesland (The Netherlands). Journal of Wetland Archaeology, 22(1–2), 2022, 7–29. https://doi.org/10.1080/14732971.2022.2061783
[40] A. Nieuwhof, M. Bakker, E. Knol, G.J. de Langen, J.A.W. Nicolay, D. Postma, M. Schepers, T.W. Varwijk, P.C. Vos, Adapting to the sea: Human habitation in the coastal area of the northern Netherlands before medieval dike building, Ocean & Coastal Management, Volume 173, 2019, Pages 77-89, ISSN 0964-5691, https://doi.org/10.1016/j.ocecoaman.2019.02.014 .
(https://www.sciencedirect.com/science/article/pii/S0964569118307348 )
See also:
Faber, Hans, Between Leffinge and Misthusum—Understanding the Basics of Terps, 29 Sep 2024, Frisia Coast Trail, https://www.frisiacoasttrail.com/post/between-leffinge-and-misthusum-understanding-the-basics-of-terps
Knol, Egge, ‘Living Near the Sea: The Organisation of Frisia in Early Medieval Times’, in Jayne Carroll, Andrew Reynolds, and Barbara Yorke (eds), Power and Place in Europe in the Early Middle Ages, Proceedings of the British Academy (London
, 2019; online edn, British Academy Scholarship Online, 21 May 2020), https://doi.org/10.5871/bacad/9780197266588.003.0017
Ellen McManus, Janet Montgomery, Jane Evans, Angela Lamb, Rhea Brettelld, Johan Jelsmae, ‘To the land or to the sea’: diet and mobility in early medieval Frisia, https://nora.nerc.ac.uk/id/eprint/504785/1/McManus%20et%20al%20-%20Oosterbeintum_final.pdf
Bakker, M., The Nature and Dynamics of Pre-Roman Iron Age and Roman Iron Age Reclamation Settlements in the (Former) Peat and Clay-On-Peat Area of Friesland (The Netherlands). Journal of Wetland Archaeology, 22(1–2), 2022, 7–29. https://doi.org/10.1080/14732971.2022.2061783
[41] Knol, Egge, ‘Living Near the Sea: The Organisation of Frisia in Early Medieval Times’, in Jayne Carroll, Andrew Reynolds, and Barbara Yorke (eds), Power and Place in Europe in the Early Middle Ages, Proceedings of the British Academy (London
, 2019; online edn, British Academy Scholarship Online, 21 May 2020), https://doi.org/10.5871/bacad/9780197266588.003.0017
[42] Knol, Egge, ‘Living Near the Sea: The Organisation of Frisia in Early Medieval Times’, in Jayne Carroll, Andrew Reynolds, and Barbara Yorke (eds), Power and Place in Europe in the Early Middle Ages, Proceedings of the British Academy (London
, 2019; online edn, British Academy Scholarship Online, 21 May 2020), https://doi.org/10.5871/bacad/9780197266588.003.0017
People of the North Sea, 7 Aug 2017, Doug’s Archaeology, https://dougsarchaeology.wordpress.com/2019/08/07/people-of-the-north-sea/
Nieuwhof, Annet,Saxon immigration or continuity? Ezinge and the coastal area of the northern Netherlands in the Migration Period, Journeal of Archaeology in the Low Countries, 5-1 (March) 2013, 53 – 83, https://www.researchgate.net/publication/273449636_Anglo-Saxon_immigration_or_continuity_Ezinge_and_the_coastal_area_of_the_northern_Netherlands_in_the_Migration_Period
Ellen McManus, Janet Montgomery, Jane Evans, Angela Lamb, Rhea Brettelld, Johan Jelsmae, ‘To the land or to the sea’: diet and mobility in early medieval Frisia, https://nora.nerc.ac.uk/id/eprint/504785/1/McManus%20et%20al%20-%20Oosterbeintum_final.pdf
Terps: Ancient Dwelling Mounds of the North Sea Coast, Ealdlar, https://ealdlar.com/history/terps
Bakker, M., The Nature and Dynamics of Pre-Roman Iron Age and Roman Iron Age Reclamation Settlements in the (Former) Peat and Clay-On-Peat Area of Friesland (The Netherlands). Journal of Wetland Archaeology, 22(1–2), 2022, 7–29. https://doi.org/10.1080/14732971.2022.2061783
Reiß, A., Hadler, H., Wilken, D., Majchczack, B. S., Blankenfeldt, R., Bäumler, S., Ickerodt, U., Klooß, S., Willershäuser, T., Rabbel, W., and Vött, A.: The Trendermarsch sunken in the Wadden Sea (North Frisia, Germany) – reconstructing a drowned medieval cultural landscape with geoarchaeological and geophysical investigations, E&G Quaternary Sci. J., 74, 37–57, https://doi.org/10.5194/egqsj-74-37-2025 , 2025. See additional link https://egqsj.copernicus.org/articles/74/37/2025/
[43] Postma, D., Salt Marsh Architecture, Catalogue, technology and typological development of early medieval turf buildings in the northern coastal area of the Netherlands, Masters Thesis University of Groningen, 2010, https://www.waddenacademie.nl/fileadmin/inhoud/pdf/06-wadweten/Scripties/D._Postma_-_scriptieverkl.pdf
Gerrets, Danny, Continuous development in house-type and settlement structure in Drenthe, Ruralia Památky archeologické – Supplementum 5, Praha 1996, http://ruralia2.ff.cuni.cz/wp-content/uploads/2018/04/Danny-Gerrets.pdf
Nieuwhof, Annet, Ezinge revisited. The ancient roots of a terp settlement: Volume 1: Excavation – Environment and Economy – Catalogue of Plans and Finds, Gronongen: Univesrity of Groningen / Groningen Institute of Archaeology and Barkhuis Publishing, 2020, https://research.rug.nl/en/publications/ezinge-revisited-the-ancient-roots-of-a-terp-settlement-volume-1-/
A. Nieuwhof, Annet and M. Bakker, E. Knol, G.J. de Langen, J.A.W. Nicolay, D. Postma, M. Schepers, T.W. Varwijk, P.C. Vos, Adapting to the sea: human habitation in the coastal area of the northern Netherlands before medieval dike building, Ocean & Coastal Management 2019, doi.org/10.1016/j.ocecoaman.2019.02.014, https://www.researchgate.net/publication/331477789_Adapting_to_the_sea_Human_habitation_in_the_coastal_area_of_the_northern_Netherlands_before_medieval_dike_building_Preprint
Old Frisian Longhouse, Wikipedia, This page was last edited on 7 December 2025, https://en.wikipedia.org/wiki/Old_Frisian_longhouse
Nieuwhof, Annet, Creating a home. Ritual practice in a terp settlement in the northern Netherlands, Beiträge zur Ur- und Frühgeschichte Mitteleuropas 95, 95 – 109, https://www.academia.edu/44905134/Creating_a_home_Ritual_practice_in_a_terp_settlement_in_the_northern_Netherlands
[44] Nieuwhof, Annet, Creating a home. Ritual practice in a terp settlement in the northern Netherlands, Beiträge zur Ur- und Frühgeschichte Mitteleuropas 95, 95 – 109, https://www.academia.edu/44905134/Creating_a_home_Ritual_practice_in_a_terp_settlement_in_the_northern_Netherlands
Faber, Hans, Between Leffinge and Misthusum—Understanding the Basics of Terps, 29 Sep 2024,Frisia Coast Trail Blog, https://www.frisiacoasttrail.com/post/between-leffinge-and-misthusum-understanding-the-basics-of-terps
Niewhof, Annet, Ezinge revisited. The ancient roots of a terp settlement: Volume 1: Excavation – Environment and Economy – Catalogue of Plans and Finds, Groningen Archaeological Studies, 37, University of Groningen/Groningen Institute of Archaeology and Barkhuis Publishing, Oct 2020, https://research.rug.nl/en/publications/ezinge-revisited-the-ancient-roots-of-a-terp-settlement-volume-1-/
[45] Carroll, Jayne, Andrew Reynolds and Barbara York, eds. Power and Place in Europe in the Early Middle Ages. Vol. 224. The British Academy, 2019. http://www.jstor.org/stable/jj.31732145
Nieuwhof, Annet, Anglo-Saxon immigration or continuity? Ezinge and the coastal area of the northern Netherlands in the Migration Period, Journal of Archaeology in the Low Countries 4-2 (April 2013), https://jalc.nl/cgi/t/text/text-idxaa82.html
Angelique Kaspers, Gilles J. de Langen and Johan A. W. Nicolay, From sherds to settlement patterns – new insights into the habitation history of the coastal area of the northern Netherlands during the Merovingian and Carolingian periods (AD 400-900) based on field surveys and older collections research, Settlement and Coastal Research in the Southern North Sea Region (SCN), 46, 115-189, Rahden/Westf. 2023, https://www.academia.edu/123867114/From_sherds_to_settlement_patterns_new_insights_into_the_habitation_history_of_the_coastal_area_of_the_northern_Netherlands_during_the_Merovingian_and_Carolingian_periods_AD_400_900_based_on_field_surveys_and_older_collections_research
Knol E. For Daily Use and Special Moments: Material Culture in Frisia, AD 400–1000. In: Hines J, IJssennagger-van der Pluijm N, eds. Frisians of the Early Middle Ages. Studies in Historical Archaeoethnology. Boydell & Brewer; 2021:13-44, https://www.academia.edu/123867114/From_sherds_to_settlement_patterns_new_insights_into_the_habitation_history_of_the_coastal_area_of_the_northern_Netherlands_during_the_Merovingian_and_Carolingian_periods_AD_400_900_based_on_field_surveys_and_older_collections_research
[46] In archaeology, stratigraphy is the study of layers (strata) of soil and debris that build up over time, allowing archaeologists to establish a chronological sequence of events at a site. It relies on the Law of Superposition, which states that deeper layers are older than those above them, helping reconstruct the site’s history, understand past activities, and date artifacts relative to each other, much like layers in a cake or lasagna.
Stratigraphy (archaeology), Wikipedia, This page was last edited on 4 October 2025, https://en.wikipedia.org/wiki/Stratigraphy_(archaeology)
[47] Nieuwhof, Annet, Anglo-Saxon immigration or continuity? Ezinge and the coastal area of the northern Netherlands in the Migration Period, Journal of Archaeology in the Low Countries 4-2 (April 2013), https://jalc.nl/cgi/t/text/text-idxaa82.html
Kaspers, Angelique and Gilles J. de Langen and Johan A. W. Nicolay, From sherds to settlement patterns – new insights into the habitation history of the coastal area of the northern Netherlands during the Merovingian and Carolingian periods (AD 400-900) based on field surveys and older collections research, Settlement and Coastal Research in the Southern North Sea Region (SCN), 46, 115-189, Rahden/Westf. 2023, https://www.academia.edu/123867114/From_sherds_to_settlement_patterns_new_insights_into_the_habitation_history_of_the_coastal_area_of_the_northern_Netherlands_during_the_Merovingian_and_Carolingian_periods_AD_400_900_based_on_field_surveys_and_older_collections_research
Nieuwhof A. The Frisians and their Pottery: Social Relations before and after the Fourth Century AD. In: Hines J, IJssennagger-van der Pluijm N, eds. Frisians of the Early Middle Ages. Studies in Historical Archaeoethnology. Boydell & Brewer; 2021:45-78, https://resolve.cambridge.org/core/books/abs/frisians-of-the-early-middle-ages/frisians-and-their-pottery-social-relations-before-and-after-the-fourth-century-ad/49D9B6667528E049632B1978BCB811F5
[48] Postma, D., Salt Marsh Architecture, Catalogue, technology and typological development of early medieval turf buildings in the northern coastal area of the Netherlands, Masters Thesis University of Groningen, 2010, https://www.waddenacademie.nl/fileadmin/inhoud/pdf/06-wadweten/Scripties/D._Postma_-_scriptieverkl.pdf
Gerrets, Danny, Continuous development in house-type and settlement structure in Drenthe, Ruralia Památky archeologické – Supplementum 5, Praha 1996, http://ruralia2.ff.cuni.cz/wp-content/uploads/2018/04/Danny-Gerrets.pdf
Nieuwhof, Annet, Ezinge revisited. The ancient roots of a terp settlement: Volume 1: Excavation – Environment and Economy – Catalogue of Plans and Finds, Gronongen: Univesrity of Groningen / Groningen Institute of Archaeology and Barkhuis Publishing, 2020, https://research.rug.nl/en/publications/ezinge-revisited-the-ancient-roots-of-a-terp-settlement-volume-1-/
Old Frisian Longhouse, Wikipedia, This page was last edited on 7 December 2025, https://en.wikipedia.org/wiki/Old_Frisian_longhouse
Nieuwhof, Annet, Creating a home. Ritual practice in a terp settlement in the northern Netherlands, Beiträge zur Ur- und Frühgeschichte Mitteleuropas 95, 95 – 109, https://www.academia.edu/44905134/Creating_a_home_Ritual_practice_in_a_terp_settlement_in_the_northern_Netherlands
[49] Kaspers, Angelique and Gilles J. de Langen and Johan A. W. Nicolay, From sherds to settlement patterns – new insights into the habitation history of the coastal area of the northern Netherlands during the Merovingian and Carolingian periods (AD 400-900) based on field surveys and older collections research, Settlement and Coastal Research in the Southern North Sea Region (SCN), 46, 115-189, Rahden/Westf. 2023,
Boeles en Van Giffen Speech or profile paper about mounds, Education, Vereniging voor Terpenonderzoek, https://terpenonderzoek.nl/education/?lang=en
[50] Knol, Egge, ‘Living Near the Sea: The Organisation of Frisia in Early Medieval Times’, in Jayne Carroll, Andrew Reynolds, and Barbara Yorke (eds), Power and Place in Europe in the Early Middle Ages, Proceedings of the British Academy (London, 2019; online edn, British Academy Scholarship Online, 21 May 2020), https://doi.org/10.5871/bacad/9780197266588.003.0017
Carroll, Jayne, Andrew Reynolds amd Barbara Yorke, eds. Power and Place in Europe in the Early Middle Ages. Vol. 224. The British Academy, 2019. http://www.jstor.org/stable/jj.31732145
[51] van Lanen, Rowin J. and Menne C. Kosian, Bert J. Groenewoudt, Esther Jansma, Finding a Way: Modeling Landscape Prerequisites for Roman and Early-Medieval Routes in the Netherlands, Geoarchaeology: An International Journal 00 (2015) 1–23, https://doi.org/10.1002/GEA.21510, https://www.academia.edu/11879781/Van_Lanen_et_al_2015_Finding_a_way_Modeling_Landscape_Prerequisites_for_Roman_and_Early_Medieval_Routes_in_the_Netherlands?email_work_card=title
A. Nieuwhof, M. Bakker, E. Knol, G.J. de Langen, J.A.W. Nicolay, D. Postma, M. Schepers, T.W. Varwijk, P.C. Vos, Adapting to the sea: Human habitation in the coastal area of the northern Netherlands before medieval dike building, Ocean & Coastal Management, Volume 173, 2019, Pages 77-89, ISSN 0964-5691, https://doi.org/10.1016/j.ocecoaman.2019.02.014 .
(https://www.sciencedirect.com/science/article/pii/S0964569118307348 )
Knol, Egge, ‘Living Near the Sea: The Organisation of Frisia in Early Medieval Times’, in Jayne Carroll, Andrew Reynolds, and Barbara Yorke (eds), Power and Place in Europe in the Early Middle Ages, Proceedings of the British Academy (London
, 2019; online edn, British Academy Scholarship Online, 21 May 2020), https://doi.org/10.5871/bacad/9780197266588.003.0017
[52] Bakker, M. , The Nature and Dynamics of Pre-Roman Iron Age and Roman Iron Age Reclamation Settlements in the (Former) Peat and Clay-On-Peat Area of Friesland (The Netherlands). Journal of Wetland Archaeology, 22(1–2), 2022, 7–29. https://doi.org/10.1080/14732971.2022.2061783
van Popta, Y. T., Cohen, K. M., Vos, P. C., & Spek, Th. (2020). Reconstructing medieval eroded landscapes of the north-eastern Zuyder Zee (the Netherlands): a refined palaeogeographical time series of the Noordoostpolder between a.d. 1100 and 1400. Landscape History, 41(2), 27–56. https://doi.org/10.1080/01433768.2020.1835180
A. Nieuwhof, M. Bakker, E. Knol, G.J. de Langen, J.A.W. Nicolay, D. Postma, M. Schepers, T.W. Varwijk, P.C. Vos, Adapting to the sea: Human habitation in the coastal area of the northern Netherlands before medieval dike building, Ocean & Coastal Management, Volume 173, 2019, Pages 77-89, ISSN 0964-5691, https://doi.org/10.1016/j.ocecoaman.2019.02.014 .
(https://www.sciencedirect.com/science/article/pii/S0964569118307348 )
[53] D. Postma , Salt Marsh Architecture, Catalogue, technology and typological development of early medieval turf buildings in the northern coastal area of the Netherlands, Masters Thesis University of Groningen, 2010, https://www.waddenacademie.nl/fileadmin/inhoud/pdf/06-wadweten/Scripties/D._Postma_-_scriptieverkl.pdf
[54] A. Nieuwhof, M. Bakker, E. Knol, G.J. de Langen, J.A.W. Nicolay, D. Postma, M. Schepers, T.W. Varwijk, P.C. Vos, Adapting to the sea: Human habitation in the coastal area of the northern Netherlands before medieval dike building, Ocean & Coastal Management, Volume 173, 2019, Pages 77-89, ISSN 0964-5691, https://doi.org/10.1016/j.ocecoaman.2019.02.014 .
(https://www.sciencedirect.com/science/article/pii/S0964569118307348 )
Bakker, M. , The Nature and Dynamics of Pre-Roman Iron Age and Roman Iron Age Reclamation Settlements in the (Former) Peat and Clay-On-Peat Area of Friesland (The Netherlands). Journal of Wetland Archaeology, 22(1–2), 2022, 7–29. https://doi.org/10.1080/14732971.2022.2061783
[55] van Lanen, Rowin J. and Menne C. Kosian, Bert J. Groenewoudt, Esther Jansma, Finding a Way: Modeling Landscape Prerequisites for Roman and Early-Medieval Routes in the Netherlands, Geoarchaeology: An International Journal 00 (2015) 1–23, https://doi.org/10.1002/GEA.21510, https://www.academia.edu/11879781/Van_Lanen_et_al_2015_Finding_a_way_Modeling_Landscape_Prerequisites_for_Roman_and_Early_Medieval_Routes_in_the_Netherlands?email_work_card=title
Van Lanen, R.J., Jansma, E., Van Doesburg, J., Groenewoudt, B.J., Roman and early-medieval long-distance transport routes in north-western Europe: modelling frequent-travel zones using a dendroarchaeological approach. J. Archaeol. Sci. 73, 120e137. 2016, https://www.sciencedirect.com/science/article/abs/pii/S0305440316300978
W.A. van Es & W.J.H. Verwers, Early Medieval settlements along the Rhine: precursors and contemporaries of Dorestad, Journal of Archaeology in the Low Countries, 2-1 (May 2010), https://jalc.nl/cgi/t/text/get-pdfcfad.pdf?c=jalc%3Bidno%3D0201a01
[56] van Lanen, Rowin J. and Menne C. Kosian, Bert J. Groenewoudt, Esther Jansma, Finding a Way: Modeling Landscape Prerequisites for Roman and Early-Medieval Routes in the Netherlands, Geoarchaeology: An International Journal 00 (2015) 1–23, https://doi.org/10.1002/GEA.21510, https://www.academia.edu/11879781/Van_Lanen_et_al_2015_Finding_a_way_Modeling_Landscape_Prerequisites_for_Roman_and_Early_Medieval_Routes_in_the_Netherlands?email_work_card=title
[57] Pierik HJ. Landscape changes and human–landscape interaction during the first millennium AD in the Netherlands. Netherlands Journal of Geosciences, Volume 100, e11. https://doi.org/10.1017/njg.2021.8
van Lanen, Rowin J. and Esther Jansma, Jan van Doesburg, Bert J. Groenewoudt, Roman and early-medieval long-distance transport routes in north-western Europe: Modelling frequent-travel zones using a dendroarchaeological approach , Journal of Archaeological Science, 73, Sep 2016, 120- 137, https://www.sciencedirect.com/science/article/abs/pii/S0305440316300978
R.J. Lanen, M. Kosian, B.J. Groenewoudt, E. Jansma, Geoarchaeology: An international Journal (30), 200-222(2015): Finding a Way: Modeling Landscape Prerequisites for Roman and Early-Medieval Routes in the Netherlands pp. 200 – 222, https://www.academia.edu/11879781/Van_Lanen_et_al_2015_Finding_a_way_Modeling_Landscape_Prerequisites_for_Roman_and_Early_Medieval_Routes_in_the_Netherlands
van Lanen, Rowin J. and Menne C. Kosian, Bert J. Groenewoudt, Esther Jansma, Finding a Way: Modeling Landscape Prerequisites for Roman and Early-Medieval Routes in the Netherlands, Geoarchaeology: An International Journal 00 (2015) 1–23, https://doi.org/10.1002/GEA.21510, https://www.academia.edu/11879781/Van_Lanen_et_al_2015_Finding_a_way_Modeling_Landscape_Prerequisites_for_Roman_and_Early_Medieval_Routes_in_the_Netherlands?email_work_card=title
[58] van Lanen, Rowin J. and Menne C. Kosian, Bert J. Groenewoudt, Esther Jansma, Finding a Way: Modeling Landscape Prerequisites for Roman and Early-Medieval Routes in the Netherlands, Geoarchaeology: An International Journal 00 (2015) 1–23, https://doi.org/10.1002/GEA.21510, https://www.academia.edu/11879781/Van_Lanen_et_al_2015_Finding_a_way_Modeling_Landscape_Prerequisites_for_Roman_and_Early_Medieval_Routes_in_the_Netherlands?email_work_card=title
[59] van Lanen, Rowin J. and Menne C. Kosian, Bert J. Groenewoudt, Esther Jansma, Finding a Way: Modeling Landscape Prerequisites for Roman and Early-Medieval Routes in the Netherlands, Geoarchaeology: An International Journal 00 (2015) 1–23, https://doi.org/10.1002/GEA.21510, https://www.academia.edu/11879781/Van_Lanen_et_al_2015_Finding_a_way_Modeling_Landscape_Prerequisites_for_Roman_and_Early_Medieval_Routes_in_the_Netherlands?email_work_card=title
Jansma, Esther and Rowin J. Van Lanen and Harm Jan Pierk, Traveling Through a River Delta: A Landscape Archaeogical Reconstruction of River Development and Long Distance Connections in the netherlands During the First Millennium AD, Medieval Settlement Research 32 (2017), 35–39, https://www.academia.edu/35074210/Jansma_E_R_J_Van_Lanen_and_H_J_Pierik_2017_Travelling_through_a_river_delta_a_landscape_archaeological_reconstruction_of_river_development_and_long_distance_connections_in_the_Netherlands_during_the_first_millennium_AD_Medieval_Settlement_Research_32_35_39
Van Lanen, R.J., Kosian, M.C., Groenewoudt, B.J., Spek, T., Jansma, E., 2016b. Route persistence. Modelling and quantifying historical route-network stability during the last two millennia: a case study from The Netherlands. Archaeol. Anthropol. Sciences 1e16. https://www.researchgate.net/publication/310757823_Route_persistence_Modelling_and_quantifying_historical_route-network_stability_from_the_Roman_period_to_early-modern_times_AD_100-1600_a_case_study_from_the_Netherlands
[60] Rowin J. van Lanen, Rowin J. and Harm Jan Pierik, Calculating connectivity patterns in delta landscapes: Modelling Roman and early-medieval route networks and their stability in dynamic lowlands, Quaternary International, Volume 501, Part B, 2019, Pages 393-412,
ISSN 1040-6182, https://doi.org/10.1016/j.quaint.2017.03.009 .
(https://www.sciencedirect.com/science/article/pii/S1040618216313519 )
[61] Quote:
Jansma, Esther and Rowin J. Van Lanen, and Harm Jan Pierik, Traveling through a River Delta: A Landscape Archaeological Reconstruction of River Development and Long-Distance connections in the Netherlands During the First Millennium AD, Medieval Settlement Research 32 (2017), 35–39, https://www.academia.edu/35074210/Jansma_E_R_J_Van_Lanen_and_H_J_Pierik_2017_Travelling_through_a_river_delta_a_landscape_archaeological_reconstruction_of_river_development_and_long_distance_connections_in_the_Netherlands_during_the_first_millennium_AD_Medieval_Settlement_Research_32_35_39
The quote references the “old Rhine’. “In ancient times, it was the lower part of the main River Rhine, which forked at the Betuwe into a northern branch, the Rhine, and a southern branch, the Waal. The Oude Rijn was then much wider than it is now, and tidal. During the Roman occupation, the river formed part of the northern border of the Empire. In medieval times, the River Lek became the main outlet for the Rhine, and the Oude Rijn silted up.“
Oude Rijn (Utrecht and South Holland), Wikipedia, This page was last edited on 26 September 2025, https://en.wikipedia.org/wiki/Oude_Rijn_(Utrecht_and_South_Holland)
[62] W.A. van Es & W.J.H. Verwers, Early Medieval settlements along the Rhine: precursors and contemporaries of Dorestad, Journal of Archaeology in the Low Countries, 2-1 (May 2010), https://jalc.nl/cgi/t/text/get-pdfcfad.pdf?c=jalc%3Bidno%3D0201a01
van Lanen, Rowin J. and Esther Jansma, Jan van Doesburg, Bert J. Groenewoudt, Roman and early-medieval long-distance transport routes in north-western Europe: Modelling frequent-travel zones using a dendroarchaeological approach , Journal of Archaeological Science, 73, Sep 2016, 120- 137, https://www.sciencedirect.com/science/article/abs/pii/S0305440316300978
van Lanen, Rowin J. and Jaap Evert Abrahamse, The City and the River. The early medieval Emporium (trade centre) of Dorestad; integrating physical geography with archaeological data in changing environments, in Wolfgang Börner, Susanne Uhlirz, Proceedings of the 17th International Conference on Cultural Heritage and New Technologies 2012 , https://www.academia.edu/5851685/The_City_and_the_River_The_early_medieval_Emporium_trade_centre_of_Dorestad_integrating_physical_geography_with_archaeological_data_in_changing_environments
[63] Hines, John, and Nelleke IJssennagger, eds. Frisians and Their North Sea Neighbours: From the Fifth Century to the Viking Age. NED-New edition. Boydell & Brewer, 2017. http://www.jstor.org/stable/10.7722/j.ctt1t6p55t
Pierik, Ham Jan, Landscape changes and human–landscape interaction during the first millennium AD in the Netherlands. Netherlands Journal of Geosciences, Volume 100, e11. https://doi.org/10.1017/njg.2021.8
Flierman, Robert, Mirror Histories: Frisians and Saxons from the First to the Ninth century AD, 223 – 247, Chapter 8 in: Hines J, IJssennagger-van der Pluijm N, eds. Frisians of the Early Middle Ages. Studies in Historical Archaeoethnology. Boydell & Brewer, Published online by Cambridge University Press: 11 June 2021, https://resolve.cambridge.org/core/books/abs/frisians-of-the-early-middle-ages/mirror-histories-frisians-and-saxons-from-the-first-to-the-ninth-century-ad/86AE8F89C42C13A6B84B63D3D06405A6
Tys, Dries, ‘Maritime and River Traders, Landing Places, and Emporia Ports in the Merovingian Period in and Around the Low Countries’, in Bonnie Effros, and Isabel Moreira (eds), The Oxford Handbook of the Merovingian World (2020; online edn, Oxford Academic, 8 Oct. 2020), https://doi.org/10.1093/oxfordhb/9780190234188.013.26
[64] Dorestad, Wikipedia, This page was last edited on 16 December 2024, https://en.wikipedia.org/wiki/Dorestad
van Lanen, Rowin J. and Jaap Evert Abrahamse, The City and the River. The early medieval Emporium (trade centre) of Dorestad; integrating physical geography with archaeological data in changing environments, in Wolfgang Börner, Susanne Uhlirz, Proceedings of the 17th International Conference on Cultural Heritage and New Technologies 2012 , https://www.academia.edu/5851685/The_City_and_the_River_The_early_medieval_Emporium_trade_centre_of_Dorestad_integrating_physical_geography_with_archaeological_data_in_changing_environments
van Lanen, Rowin J. and Esther Jansma, Jan van Doesburg, Bert J. Groenewoudt, Roman and early-medieval long-distance transport routes in north-western Europe: Modelling frequent-travel zones using a dendroarchaeological approach , Journal of Archaeological Science, 73, Sep 2016, 120- 137, https://www.sciencedirect.com/science/article/abs/pii/S0305440316300978
W.A. van Es & W.J.H. Verwers, Early Medieval settlements along the Rhine: precursors and contemporaries of Dorestad, Journal of Archaeology in the Low Countries, 2-1 (May 2010), https://jalc.nl/cgi/t/text/get-pdfcfad.pdf?c=jalc%3Bidno%3D0201a01
[65] See for example:
Rowin J. van Lanen, Rowin J. and Harm Jan Pierik, Calculating connectivity patterns in delta landscapes: Modelling Roman and early-medieval route networks and their stability in dynamic lowlands, Quaternary International, Volume 501, Part B, 2019, Pages 393-412,
ISSN 1040-6182, https://doi.org/10.1016/j.quaint.2017.03.009 .
(https://www.sciencedirect.com/science/article/pii/S1040618216313519 )
van Lanen, Rowin J. and Menne C. Kosian, Bert J. Groenewoudt, Esther Jansma, Finding a Way: Modeling Landscape Prerequisites for Roman and Early-Medieval Routes in the Netherlands, Geoarchaeology: An International Journal 00 (2015) 1–23, https://doi.org/10.1002/GEA.21510, https://www.academia.edu/11879781/Van_Lanen_et_al_2015_Finding_a_way_Modeling_Landscape_Prerequisites_for_Roman_and_Early_Medieval_Routes_in_the_Netherlands?email_work_card=title
Jansma, Esther and Rowin J. Van Lanen and Harm Jan Pierk, Traveling Through a River Delta: A Landscape Archaeogical Reconstruction of River Development and Long Distance Connections in the Netherlands During the First Millennium AD, Medieval Settlement Research 32 (2017), 35–39, https://www.academia.edu/35074210/Jansma_E_R_J_Van_Lanen_and_H_J_Pierik_2017_Travelling_through_a_river_delta_a_landscape_archaeological_reconstruction_of_river_development_and_long_distance_connections_in_the_Netherlands_during_the_first_millennium_AD_Medieval_Settlement_Research_32_35_39
Pierik HJ. Landscape changes and human–landscape interaction during the first millennium AD in the Netherlands. Netherlands Journal of Geosciences, Volume 100, e11. https://doi.org/10.1017/njg.2021.8
Roymans, N., & Gerritsen, F.A. (2002). Landscape, ecology and mentalities: a long-term perspective on developments in the Meuse-Demer-Scheldt region. Proceedings of the Prehistoric Society, 68, 257–287
[66] The idea of couching the results of mapping specific ‘cost-efficient’ migration routes of specific YDNA lineages created by Globetrekker in the context of land archaeological models of general land and water transport route zones, movemement paths and persistence places is similar to a suggested research approach for landscape genomics and genetics.
An editorial by Samuel Cushman and other research associates frames landscape genomics as an expansion of landscape genetics made possible by next generation sequencing (NGS) methods, and concludes that progress hinges on integrating large genomic datasets with spatial modeling and experimental work in hypothesis‑driven, collaborative projects. The article’s main goal is to outline conceptual and practical steps for moving from traditional landscape genetics (e.g. tens of microsatellites, population‑level sampling) to landscape genomics (e.g. thousands of genome‑wide markers from NGS) in a spatially explicit framework.
See: Cushman SA, Shirk AJ, Howe GT, Murphy MA, Dyer RJ, Joost S. Editorial: The Least Cost Path From Landscape Genetics to Landscape Genomics: Challenges and Opportunities to Explore NGS Data in a Spatially Explicit Context. Front Genet. 2018 Jun 19;9:215. doi: 10.3389/fgene.2018.00215. PMID: 29971091; PMCID: PMC6018102 (PubMed) https://pmc.ncbi.nlm.nih.gov/articles/PMC6018102/
[67] Jansma et. al. and Van Lanen et. al. discuss the interdisciplinary nature of this research:
Jansma, E., Gouw-Bouman, M., Van Lanen, R., Pierik, H.J., Cohen, K., Groenewoudt, B., Hoek, W., Stouthamer, E., & Middelkoop, H., The dark age of the lowlands in an interdisciplinary light: People, landscape and climate in the Netherlands between AD 300–1000. European Journal of Post-Classical Archaeologies (PCA 4), 2014, 471–476. ISSN: 2039–7895, https://www.researchgate.net/publication/265096511_The_Dark_Age_of_the_Lowlands_in_an_interdisciplinary_light_people_landscape_and_climate_in_The_Netherlands_between_AD_300_and_1000
Van Lanen , Rowin J. and Esther Jansma, and Menne Kosian, Finding a way: Modeling Landscape Prerequisites for Roman and Early-Medieval Routes in the Netherlands, Geoarchaeology: An international Journal (30), 200-222. https://doi.org/10.1002/GEA.21510, https://www.academia.edu/11879781/Van_Lanen_et_al_2015_Finding_a_way_Modeling_Landscape_Prerequisites_for_Roman_and_Early_Medieval_Routes_in_the_Netherlands?email_work_card=title
[68] See for example:
Jansma, E., Gouw-Bouman, M., Van Lanen, R., Pierik, H.J., Cohen, K., Groenewoudt, B., Hoek, W., Stouthamer, E., & Middelkoop, H., The dark age of the lowlands in an interdisciplinary light: People, landscape and climate in the Netherlands between AD 300–1000. European Journal of Post-Classical Archaeologies (PCA 4), 2014, 471–476. ISSN: 2039–7895, https://www.researchgate.net/publication/265096511_The_Dark_Age_of_the_Lowlands_in_an_interdisciplinary_light_people_landscape_and_climate_in_The_Netherlands_between_AD_300_and_1000
Jansma, Esther and Rowin J. Van Lanen and Harm Jan Pierk, Traveling Through a River Delta: A Landscape Archaeogical Reconstruction of River Development and Long Distance Connections in the Netherlands During the First Millennium AD, Medieval Settlement Research 32 (2017), 35–39, https://www.academia.edu/35074210/Jansma_E_R_J_Van_Lanen_and_H_J_Pierik_2017_Travelling_through_a_river_delta_a_landscape_archaeological_reconstruction_of_river_development_and_long_distance_connections_in_the_Netherlands_during_the_first_millennium_AD_Medieval_Settlement_Research_32_35_39
Pierik HJ. Landscape changes and human–landscape interaction during the first millennium AD in the Netherlands. Netherlands Journal of Geosciences, Volume 100, e11. https://doi.org/10.1017/njg.2021.8
Roymans, N., & Gerritsen, F.A. (2002). Landscape, ecology and mentalities: a long-term perspective on developments in the Meuse-Demer-Scheldt region. Proceedings of the Prehistoric Society, 68, 257–287
Stouthamer, E., & Berendsen, H.J.A., Factors controlling the Holocene avulsion history of the Rhine–Meuse Delta (the Netherlands). Journal of Sedimentary Research, 70(5), 2000, 1051–1064.
van Dinter, Marieke and Kim M. Cohen, Wim Z. Hoek, Esther Stouthamer, Esther Jansma , Hans Middelkoop, Late Holocene lowland fluvial archives and geoarchaeology: Utrecht’s case study of Rhine river abandonment under Roman and Medieval settlement, Quaternary Science Reviews (2017) 1-39, https://www.academia.edu/31299345/Late_Holocene_lowland_fluvial_archives_and_geoarchaeology_Utrechts_case_study_of_Rhine_river_abandonment_under_Roman_and_Medieval_settlement?email_work_card=view-paper
Van Lanen , Rowin J. and Esther Jansma, and Menne Kosian, Finding a way: Modeling Landscape Prerequisites for Roman and Early-Medieval Routes in the Netherlands, Geoarchaeology: An international Journal (30), 200-222. https://doi.org/10.1002/GEA.21510, https://www.academia.edu/11879781/Van_Lanen_et_al_2015_Finding_a_way_Modeling_Landscape_Prerequisites_for_Roman_and_Early_Medieval_Routes_in_the_Netherlands?email_work_card=title
Van Lanen , Rowin J. and Bert J. Groenewoudt , Theo Spek, Esther Jansma, Route Persistence. Modelling and quantifying historical route-network stability from the Roman period to early-modern times (AD 100–1600): a case study from the Netherlands, Archaeol Anthropol Sci (2018) 10:1037–1052, DOI 10.1007/s12520-016-0431-z , https://www.researchgate.net/publication/310757823_Route_persistence_Modelling_and_quantifying_historical_route-network_stability_from_the_Roman_period_to_early-modern_times_AD_100-1600_a_case_study_from_the_Netherlands
Van Lanen, R.J., Kosian, M.C., Groenewoudt, B.J., Spek, T., Jansma, E., Best travel options: modelling Roman and early-medieval routes in The Netherlands using a multi-proxy approach. J. Archaeol. Sci. Rep. 3 (JASR), 144e159., 2015
Van Lanen, Rowin J. and Harm Jan Pierik, Calculating connectivity patterns in delta landscapes: Modelling Roman and early-medieval route networks and their stability in dynamic lowlands, Quaternary International, Volume 501, Part B, 20 January 2019, Pages 393-412, https://www.sciencedirect.com/science/article/abs/pii/S1040618216313519?via%3Dihub ; also https://www.academia.edu/34741700/Van_Lanen_and_Pierik_2017_Calculating_connectivity_patterns_in_delta_landscapes_Modelling_Roman_and_early_medieval_route_networks_and_their_stability_in_dynamic_lowlands?email_work_card=view-paper
Van Lanen, R.J., Jansma, E., Van Doesburg, J., Groenewoudt, B.J., Roman and early-medieval long-distance transport routes in north-western Europe: modelling frequent-travel zones using a dendroarchaeological approach. J. Archaeol. Sci. 73, 120e137. 2016, https://www.sciencedirect.com/science/article/abs/pii/S0305440316300978
Verhagen, P., Brughmans, T., Nuninger, L., & Bertoncello, F. , The long and winding road: Combining least cost paths and network analysis techniques for settlement location analysis and predictive modelling. In G. Earl, T. Sly, A. Chrysanthi, P. Murrieta-Flores, C. Papadopoulos, I. Romanowska, & D. Wheatley (Eds.), Archaeology in the digital era. Papers from the 40th Annual Conference of Computer Applications and Quantitative Methods in Archaeology (CAA) (Southampton, March 26–29, 2013, pp. 357–366)
Verhagen, J.W.H.P., Case Studies in Archaeological Predictive Modelling. PhD thesis. Leiden University, Archaeological Studies Leiden University (ASLU) 14, Leiden University Press, Leiden. 2007
Verhagen, J.W.H.P., Whitley, T.G., Integrating archaeological theory and predictive modeling: a live report from the scene. J. Archaeol. Method Theory 19, 49e100. 2011
Vos , Peter C, Origin of the Dutch Coastal landscape; Long term landscape evolution to the Netherlands during the Holocene, described and visualized in national regional and local palaeographical map series, PhD Thesis Utrecht University, Utrecht, 2015, https://dspace.library.uu.nl/handle/1874/315553
[69] Van Lanen et. al. provide basic definitions associated with this research:
Van Lanen , Rowin J. and Esther Jansma, and Menne Kosian, Finding a way: Modeling Landscape Prerequisites for Roman and Early-Medieval Routes in the Netherlands, Geoarchaeology: An international Journal (30), 200-222. https://doi.org/10.1002/GEA.21510, https://www.academia.edu/11879781/Van_Lanen_et_al_2015_Finding_a_way_Modeling_Landscape_Prerequisites_for_Roman_and_Early_Medieval_Routes_in_the_Netherlands?email_work_card=title
See also:
Van Lanen, R.J., Kosian, M.C., Groenewoudt, B.J., Spek, T., Jansma, E., 2016b. Route persistence. Modelling and quantifying historical route-network stability during the last two millennia: a case study from The Netherlands. Archaeol. Anthropol. Sciences 1e16. https://link.springer.com/journal/12520/onlineFirst/page/3 .
van Lanen RJ. Revealing the past through modelling? Reflections on connectivity, habitation and persistence in the Dutch Delta during the 1st millennium AD. Netherlands Journal of Geosciences. 2020;99:e14. doi:10.1017/njg.2020.12 https://doi.org/10.1007/s12520-016-0431-z
van Rowin J. and Lanen, Harm Jan Pierik, Calculating connectivity patterns in delta landscapes: Modelling Roman and early-medieval route networks and their stability in dynamic lowlands, Quaternary International, Volume 501, Part B, 2019, Pages 393-412, ISSN 1040-6182, https://doi.org/10.1016/j.quaint.2017.03.009 .
(https://www.sciencedirect.com/science/article/pii/S1040618216313519 )
[70] See for example:
van Lanen, Rowin J. and Menne C. Kosian, Bert J. Groenewoudt, and Esther Jansma, Finding a Way: Modeling Landscape Prerequisites for Roman and Early-Medieval Routes in the Netherlands, Geoarchaeology: An International Journal 30 (2015) 200–222, https://research-portal.uu.nl/ws/portalfiles/portal/258920868/Geoarchaeology_-_2015_-_Lanen__Finding_a_Way_Modeling_Landscape_Prerequisites_for_Roman_and_Early_Medieval_Routes_in_the.pdf
van Lanen RJ. Revealing the past through modelling? Reflections on connectivity, habitation and persistence in the Dutch Delta during the 1st millennium AD. Netherlands Journal of Geosciences. 2020;99:e14. doi:10.1017/njg.2020.12 https://doi.org/10.1007/s12520-016-0431-z
van Lanen, Rowin J. and Harm Jan Pierik, Calculating connectivity patterns in delta landscapes: Modelling Roman and early-medieval route networks and their stability in dynamic lowlands, Quaternary International, Volume 501, Part B, 2019, Pages 393-412, ISSN 1040-6182, https://doi.org/10.1016/j.quaint.2017.03.009 .
(https://www.sciencedirect.com/science/article/pii/S1040618216313519 )
Jansma, Esther and Rowin J. Van Lanen and Harm Jan Pierk, Traveling Through a River Delta: A Landscape Archaeogical Reconstruction of River Development and Long Distance Connections in the netherlands During the First Millennium AD, Medieval Settlement Research 32 (2017), 35–39, https://www.academia.edu/35074210/Jansma_E_R_J_Van_Lanen_and_H_J_Pierik_2017_Travelling_through_a_river_delta_a_landscape_archaeological_reconstruction_of_river_development_and_long_distance_connections_in_the_Netherlands_during_the_first_millennium_AD_Medieval_Settlement_Research_32_35_39
van Lanen, Rowin J. and Esther Jansma, Jan van Doesburg, Bert J. Groenewoudt, Roman and early-medieval long-distance transport routes in north-western Europe: Modelling frequent-travel zones using a dendroarchaeological approach,
Journal of Archaeological Science, Volume 73, 2016, Pages 120-137, ISSN 0305-4403,
https://doi.org/10.1016/j.jas.2016.07.010 .
(https://www.sciencedirect.com/science/article/pii/S0305440316300978 )
[71] van Lanen, R. J., Groenewoudt, B., Spek, T., & Jansma, E.. Route persistence. Modelling and quantifying historical route-network stability from the Roman period to early-modern times (AD 100–1600): a case study from the Netherlands. Archaeological and Anthropological Sciences, 10 (5), 2018, 1037–1052. https://doi.org/10.1007/s12520-016-0431-z , https://pure.rug.nl/ws/portalfiles/portal/63407562/Lanen2018_Article_RoutePersistenceModellingAndQu.pdf
R.J. van Lanen. Revealing the past through modelling? Reflections on connectivity, habitation and persistence in the Dutch Delta during the 1st millennium AD. Netherlands Journal of Geosciences, Volume 99, e14. https://doi.org/10.1017/njg.2020.12
[72] van Lanen RJ. Revealing the past through modelling? Reflections on connectivity, habitation and persistence in the Dutch Delta during the 1st millennium AD. Netherlands Journal of Geosciences. 2020;99:e14. doi:10.1017/njg.2020.12 , https://www.cambridge.org/core/journals/netherlands-journal-of-geosciences/article/revealing-the-past-through-modelling-reflections-on-connectivity-habitation-and-persistence-in-the-dutch-delta-during-the-1st-millennium-ad/717D79192E8EDD6B90D58B060117EB1B
Rowin J. van Lanen, Esther Jansma, Jan van Doesburg, Bert J. Groenewoudt, Roman and early-medieval long-distance transport routes in north-western Europe: Modelling frequent-travel zones using a dendroarchaeological approach, Journal of Archaeological Science, Volume 73, 2016, Pages 120-137, ISSN 0305-4403, https://doi.org/10.1016/j.jas.2016.07.010 .
(https://www.sciencedirect.com/science/article/pii/S0305440316300978 )
Jansma, Esther and Rowin J. Van Lanen and Harm Jan Pierk, Traveling Through a River Delta: A Landscape Archaeogical Reconstruction of River Development and Long Distance Connections in the netherlands During the First Millennium AD, Medieval Settlement Research 32 (2017), 35–39, https://www.academia.edu/35074210/Jansma_E_R_J_Van_Lanen_and_H_J_Pierik_2017_Travelling_through_a_river_delta_a_landscape_archaeological_reconstruction_of_river_development_and_long_distance_connections_in_the_Netherlands_during_the_first_millennium_AD_Medieval_Settlement_Research_32_35_39
van Lanen, Rowin J. and Harm Jan Pierik, Calculating connectivity patterns in delta landscapes: Modelling Roman and early-medieval route networks and their stability in dynamic lowlands, Quaternary International,
Volume 501, Part B, 2019, Pages 393-412, ISSN 1040-6182,
https://doi.org/10.1016/j.quaint.2017.03.009 .
(https://www.sciencedirect.com/science/article/pii/S1040618216313519 )
[73] van Lanen,Rowin J. and Menne C. Kosian, Bert J. Groenewoudt, and Esther Jansma, Finding a Way: Modeling Landscape Prerequisites for Roman and Early-Medieval Routes in the Netherlands, Geoarchaeology: An International Journal 00 (2015) 1–23, quote Page 2, https://www.academia.edu/11879781/Van_Lanen_et_al_2015_Finding_a_way_Modeling_Landscape_Prerequisites_for_Roman_and_Early_Medieval_Routes_in_the_Netherlands
van Lanen RJ. Revealing the past through modelling? Reflections on connectivity, habitation and persistence in the Dutch Delta during the 1st millennium AD. Netherlands Journal of Geosciences. 2020;99:e14. doi:10.1017/njg.2020.12 https://doi.org/10.1007/s12520-016-0431-z
van Lanen, R.J., Groenewoudt, B.J., Spek, T. et al. Route persistence. Modelling and quantifying historical route-network stability from the Roman period to early-modern times (AD 100–1600): a case study from the Netherlands. Archaeol Anthropol Sci 10, 1037–1052 (2018). https://doi.org/10.1007/s12520-016-0431-z
[74] van Lanen,Rowin J. and Menne C. Kosian, Bert J. Groenewoudt, and Esther Jansma, Finding a Way: Modeling Landscape Prerequisites for Roman and Early-Medieval Routes in the Netherlands, Geoarchaeology: An International Journal 00 (2015) 1–23, quote Page 2, https://www.academia.edu/11879781/Van_Lanen_et_al_2015_Finding_a_way_Modeling_Landscape_Prerequisites_for_Roman_and_Early_Medieval_Routes_in_the_Netherlands
[75] van Lanen, R.J., Groenewoudt, B.J., Spek, T. et al. Route persistence. Modelling and quantifying historical route-network stability from the Roman period to early-modern times (AD 100–1600): a case study from the Netherlands. Archaeol Anthropol Sci 10, 1037–1052 (2018). https://doi.org/10.1007/s12520-016-0431-z
Rowin J. van Lanen, Harm Jan Pierik, Calculating connectivity patterns in delta landscapes: Modelling Roman and early-medieval route networks and their stability in dynamic lowlands, Quaternary International, Volume 501, Part B, 2019, Pages 393-412, ISSN 1040-6182, https://doi.org/10.1016/j.quaint.2017.03.009 .
(https://www.sciencedirect.com/science/article/pii/S1040618216313519 )
[76] van Lanen, R.J., Groenewoudt, B.J., Spek, T. et al. Route persistence. Modelling and quantifying historical route-network stability from the Roman period to early-modern times (AD 100–1600): a case study from the Netherlands. Archaeol Anthropol Sci 10, 1037–1052 (2018). Route persistence. Modelling and quantifying historical route-network stability
[77] Ai-Ping Fan, A.J. (Tom) van Loon, Ren-Chao Yang, The control of Pleistocene palaeogeography on the distribution of sandy patches in a silty Holocene lagoon (central Netherlands), Journal of Palaeogeography, Volume 11, Issue 4, 2022, Pages 565-583, ISSN 2095-3836, https://doi.org/10.1016/j.jop.2022.08.003 .
(https://www.sciencedirect.com/science/article/pii/S2095383622000852 )
Groenewoudt, Bert J., An exhausted landscape. Medieval use of moors, mires and commons in the Eastern Netherlands, In : Medieval Rural Settlement in Marginal Landscapes (pp.149-180), 2009/01/01, SN – 978-2-503-52746-8 10.1484/M.RURALIA-EB.3.1169, https://www.researchgate.net/publication/299929968_An_exhausted_landscape_Medieval_use_of_moors_mires_and_commons_in_the_Eastern_Netherlands
[78] van Lanen RJ. Revealing the past through modelling? Reflections on connectivity, habitation and persistence in the Dutch Delta during the 1st millennium AD. Netherlands Journal of Geosciences. 2020;99:e14. doi:10.1017/njg.2020.12, https://www.cambridge.org/core/journals/netherlands-journal-of-geosciences/article/revealing-the-past-through-modelling-reflections-on-connectivity-habitation-and-persistence-in-the-dutch-delta-during-the-1st-millennium-ad/717D79192E8EDD6B90D58B060117EB1B
van Lanen, R. J., Groenewoudt, B., Spek, T., & Jansma, Route persistence. Modelling and quantifying historical route-network stability from the Roman period to early-modern times (AD 100–1600): a case study from the Netherlands. Archaeological and Anthropological Sciences, 10 (5), 2018, 1037–1052., https://doi.org/10.1007/s12520-016-0431-z
[79] Jansma, Esther and Rowin J. Van Lanen and Harm Jan Pierk, Traveling Through a River Delta: A Landscape Archaeogical Reconstruction of River Development and Long Distance Connections in the netherlands During the First Millennium AD, Medieval Settlement Research 32 (2017), 35–39, https://www.academia.edu/35074210/Jansma_E_R_J_Van_Lanen_and_H_J_Pierik_2017_Travelling_through_a_river_delta_a_landscape_archaeological_reconstruction_of_river_development_and_long_distance_connections_in_the_Netherlands_during_the_first_millennium_AD_Medieval_Settlement_Research_32_35_39
van Lanen RJ. Revealing the past through modelling? Reflections on connectivity, habitation and persistence in the Dutch Delta during the 1st millennium AD. Netherlands Journal of Geosciences. 2020;99:e14. doi: 10.1017/njg.2020.12 , https://www.researchgate.net/publication/347351166_Revealing_the_past_through_modelling_Reflections_on_connectivity_habitation_and_persistence_in_the_Dutch_Delta_during_the_1st_millennium_AD
Van Lanen, R.J., Groenewoudt, B.J., Spek, T. and Jansma, E. 2016b. Route persistence. Modelling and quantifying historical route network stability from the Roman period to early-modern times (AD 100–1600): a case study from the Netherlands, Archaeological and Anthropological Sciences: 1–16. https://www.researchgate.net/publication/310757823_Route_persistence_Modelling_and_quantifying_historical_route-network_stability_from_the_Roman_period_to_early-modern_times_AD_100-1600_a_case_study_from_the_Netherlands
[80] Dendrochronology, Wikipedia, This page was last edited on 19 December 2025, https://en.wikipedia.org/wiki/Dendrochronology
Jansma, E., Haneca, K. and Kosian, M. 2014b. A dendrochronological reassessment of three Roman vessels from Utrecht (the Netherlands): evidence of inland navigation between the lower- Scheldt region in Gallia Belgica and the limes of Germania inferior, Journal of Archaeological Science 50: 484–496, https://www.academia.edu/26380316/A_dendrochronological_reassessment_of_three_Roman_boats_from_Utrecht_the_Netherlands_evidence_of_inland_navigation_between_the_Scheldt_region_in_Gallia_Belgica_and_the_limes_of_Germania_inferior
Blakemore, Erin,, How are tree rings used to help date an archaeological site?, National Geographic, 8 Jul 2019, https://www.nationalgeographic.com/culture/article/how-tree-rings-date-archaeological-site?loggedin=true&rnd=1768417166750
Kristof Haneca, Katarina Čufar, Hans Beeckman, Oaks, tree-rings and wooden cultural heritage: a review of the main characteristics and applications of oak dendrochronology in Europe, Journal of Archaeological Science, Volume 36, Issue 1, 2009, Pages 1-11, ISSN 0305-4403, https://doi.org/10.1016/j.jas.2008.07.005 .
(https://www.sciencedirect.com/science/article/pii/S0305440308001660 )
Visser, Ronald M. “Dendrochronological provenance patterns. Network analysis of tree-ring material reveals spatial and economic relations of roman timber in the continental north-western provinces.” Journal of Computer Applications in Archaeology 4.1 2021. https://journal.caa-international.org/articles/10.5334/jcaa.79
Martin Bridge, Locating the origins of wood resources: a review of dendroprovenancing, Journal of Archaeological Science, Volume 39, Issue 8, 2012, Pages 2828-2834,
ISSN 0305-4403, https://doi.org/10.1016/j.jas.2012.04.028 .
(https://www.sciencedirect.com/science/article/pii/S0305440312001483 )
[81] Jansma, E., Haneca, K. and Kosian, M. 2014b. A dendrochronological reassessment of three Roman vessels from Utrecht (the Netherlands): evidence of inland navigation between the lower- Scheldt region in Gallia Belgica and the limes of Germania inferior, Journal of Archaeological Science 50: 484–496, https://www.academia.edu/26380316/A_dendrochronological_reassessment_of_three_Roman_boats_from_Utrecht_the_Netherlands_evidence_of_inland_navigation_between_the_Scheldt_region_in_Gallia_Belgica_and_the_limes_of_Germania_inferior
[82] van Lanen, Rowin J. and Menne C. Kosian, Bert J. Groenewoudt, Esther Jansma, Finding a Way: Modeling Landscape Prerequisites for Roman and Early-Medieval Routes in the Netherlands, Geoarchaeology: An International Journal 00 (2015) 1–23, https://doi.org/10.1002/GEA.21510, https://www.academia.edu/11879781/Van_Lanen_et_al_2015_Finding_a_way_Modeling_Landscape_Prerequisites_for_Roman_and_Early_Medieval_Routes_in_the_Netherlands?email_work_card=title
van Lanen RJ. Revealing the past through modelling? Reflections on connectivity, habitation and persistence in the Dutch Delta during the 1st millennium AD. Netherlands Journal of Geosciences. 2020;99:e14. doi:10.1017/njg.2020.12