
This is part two of a five part story on utilizing Y-DNA tests to gain knowledge or leads on the patrilineal line of the Griff(is)(es)(ith) family. While I could immediately jump to the results and discuss the Y-chromosomal lineage of the patrilineal Griff(is)(es)(ith) line, I felt it was important to lay the groundwork on the basics of Y-DNA testing and how these results were derived and interpreted.
The growth and advances in genetic ancestry is dynamic and fast moving. It is a field of inquiry that is full of innovations, change and constant discoveries. I imagine this story will be in need of revision within two years based on the rate of technological changes and the updates in the analysis of my original test, and the addition of genetic information from other individuals that are added to the Y-DNA haplotree.
So bear with me while I cover an overview of some of the basic concepts associated with genetic ancestry and a discussion of ‘snips’ (SNPs), ‘strings’ (STRs), haplogroups, haplotrees, and other concepts before delving into the discoveries associated with the Griff(is)(es)(ith) family patrilineal line.
This foray into genetic genealology was personally a circuitous and time consuming process to gain an intuitive understanding of a complex subject. I only hope I have been able to spare the reader from the confusion of what I experienced in making sense of the results of the testing and hopefully provide a clear, direct explanation.
I have oversimplified many of the key concepts associated with genetic ancestry. I still have difficulty comprehending and cogently explaining some of the arcane arguments associated with some of the fundamental concepts and issues in the field of genetic genealogy. From my perspective, some of the concepts underpinning genetic ancestry have not been adequately explained or documented for the layman by the scientific and commercial community. Through my research I have found a number of resources that provide cogent overviews on genetic ancestry. [1] If I have failed to adequately explain some of these subjects, I apologize in advance. If your interest on this subject is piqued, hopefully I have provided footnote references that can lead you to sources that can shed more light on the subject!
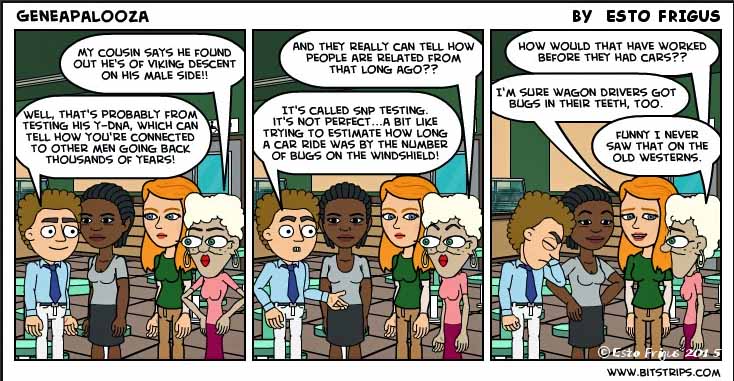
The following cartoon captures the attempt to make sense of genetic ancestry and to convey this knowledge to others.
The desire to discover information on one’s ancestry, the breakthroughs in ancient human genome research, and the technological advances in genetic research have driven the growth of a multibillion-dollar genealogy industry. Genealogy companies have digitalized and have made traditional historical records accessible online. In addition, various types of genealogical DNA tests and services have been expanded and offered to consumers. At the same time, the scientific understanding of the human past is being transformed by innovations in DNA technological testing and statistical breakthroughs and by studies of ancient and modern genetic data.
Both scientists and the wider public are learning more and more about ancestry but the terms that each of these groups utilize are sometimes used in different contexts and have different meanings. With the emergence of genetic or DNA-based genealogical research, it is wise to distinguish the differences between genealogical, genetic and cultural ancestry.
Genealogical, Genetic and Cultural Ancestry
Ian Mathieson and Aylwyn Sacally provide a good distinction between Genealogical, Genetic and Cultural Ancestry:
” … (A)ncestry itself is rarely defined. We argue that this reflects widespread underlying confusion about what it means in different contexts and what genetic data can really tell us. This leads to miscommunication between researchers in different fields, and leaves customers open to spurious claims about consumer genomics products and overinterpretation of individual results. “ [2]
Each of these distinctions are more than conceptual, definitional differences. Each reference a different type of ancestry that are uniquely different from each other and misinterpreting one for the other can lead to false expectations or erroneous conclusions.
Genealogical ancestry probably reflects the most common and intuitive understanding of the term ‘ancestry’. This is similar to what David Vance calls “genealogies’ when discussing research methodologies associated with three levels of genealological research. [3]
Genealogical ancestry is defined in terms of identifiable ancestors in your family tree or pedigree, constructed through family lore and historical documentation. Genealogical ancestry has its limitations because few family researchers are typically able to compile or fortunate to inherit a comprehensive, documented knowledge base of their families beyond 10 generations for which they have tangible records and transcribed family stories.
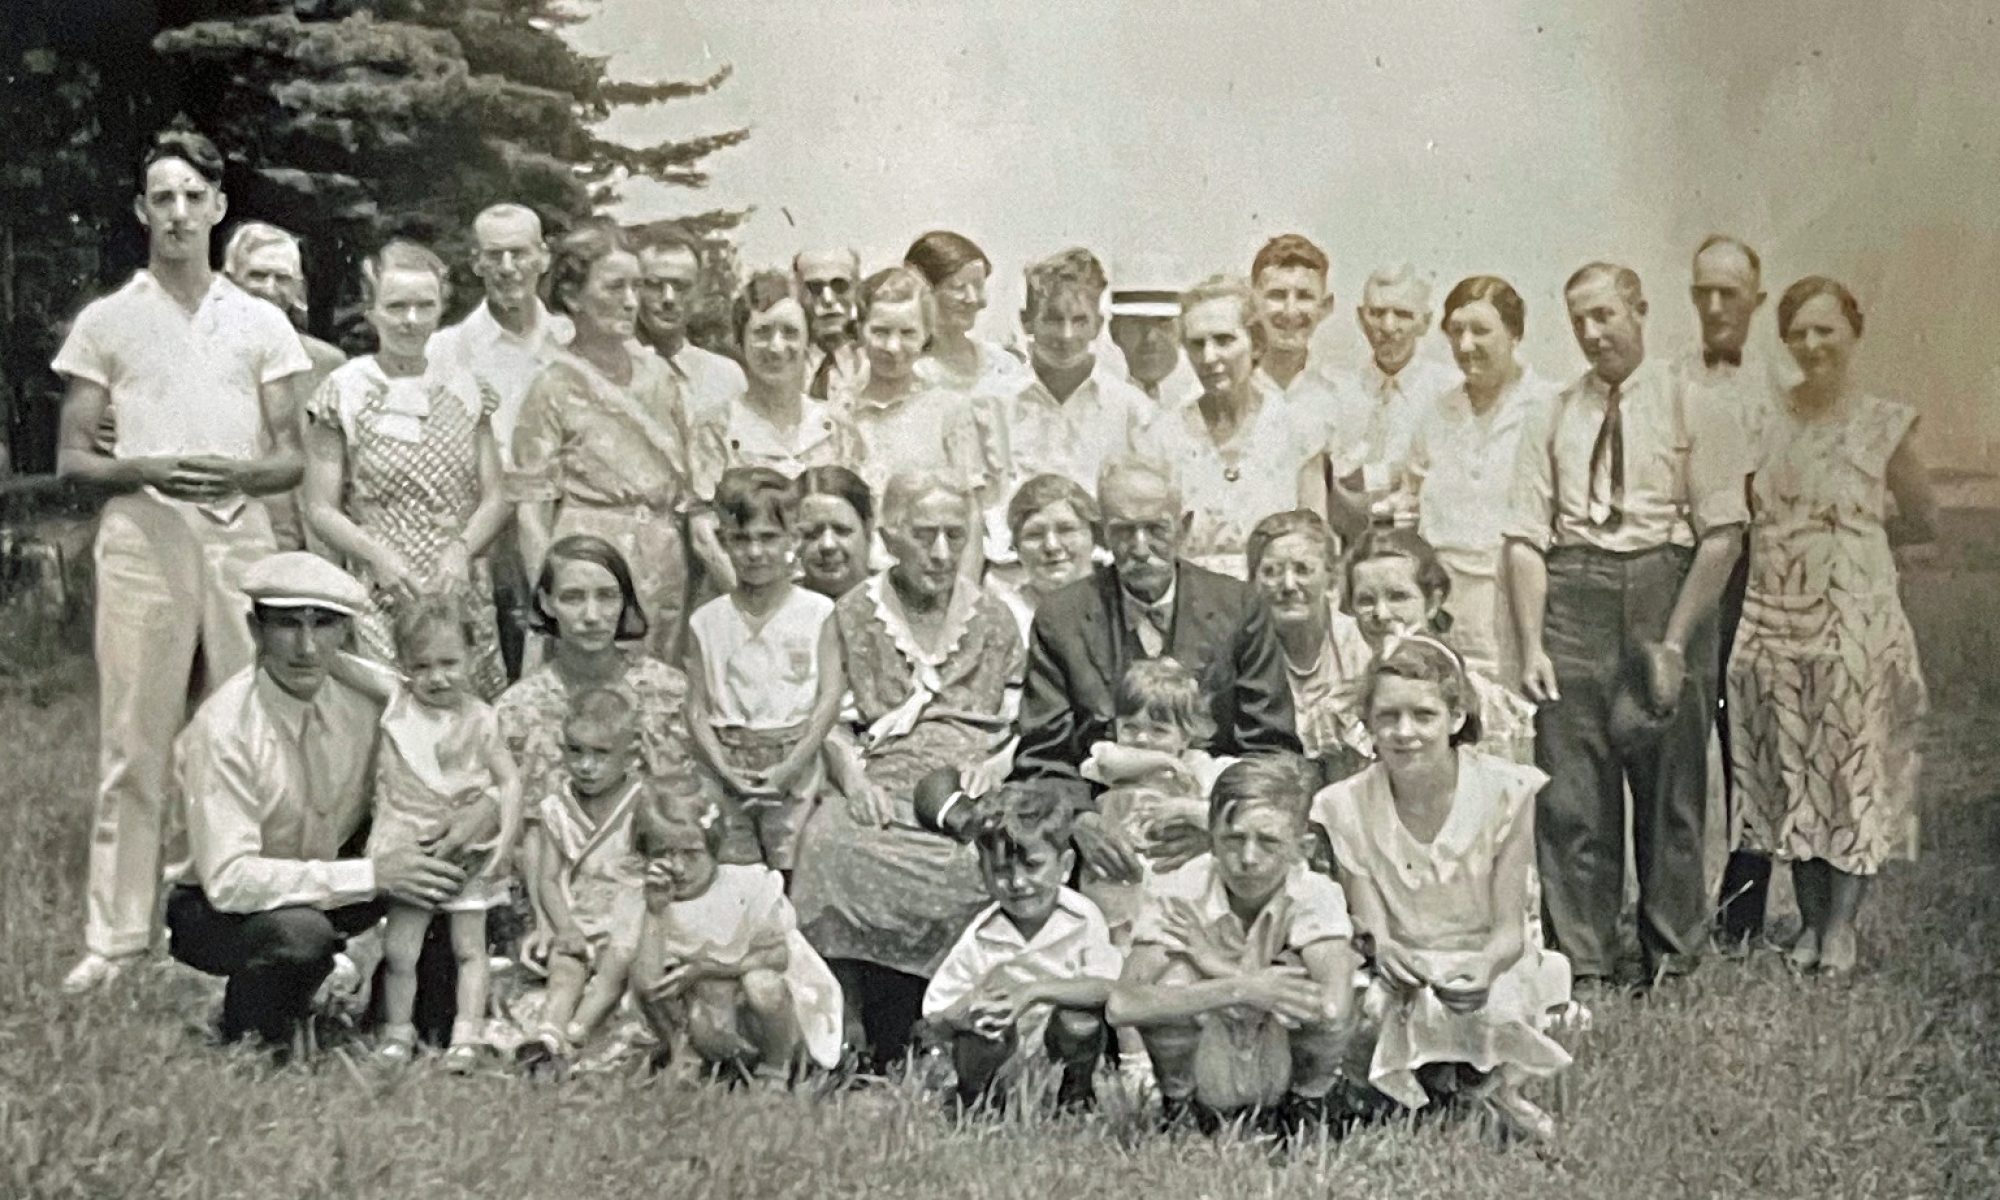
From a mathematical standpoint, if you search back n generations, you will have minimally 2 n ancestors, not counting siblings, cousins, aunts and uncles. Assuming a generation is about 25 years, for each of us there existed 250 years or 10 generations ago, at the minimum, potentially 210 or 1,024 ancestors for each of us. That is a lot of individuals to conceivably track and have available personal information to construct a family tree and weave family stories.
While many of us may have 1,024 grandparents in 10 generations, the logic that in each generation the potential number of ancestral lines doubles from a pure ‘ancestral’ standpoint utlimately breaks down. [4] This is a perspective based on investigating genealogy from the individual genealogical point of view instead of the genetic point of view. To extend the logic of this argument, in 20 generations, that would make a million possible lines of ancestry; in 40 generations a trillion. A trillion lines of genealogy is impossibly large, larger than the total number of humans that existed.
From a demographic and genetic point of view, these potential lines of descent cannot have been separate; they inevitably converge to a smaller number of actual ancestors. In addition, from a genetic point of view, one has two biological parents and carry two copies of most of one’s genes inherited from each parent. You do not carry four copies from your four grandparents. It is always two autosomal genetic ancestors, no matter how large the genealogy ancestry actually was, until those two ancestors coalesce back into one.
All of us are distant cousins, and so were all of our parents. Each of us is inbred in one sense of the term. It is just that most of us do not know who those shared relatives were. Knowing when this common genetic ancestor lived can reveal not so much about one’s immediate family, but about how the population evolved. A geneticist can extend the same idea to more and more people, taking their shared genetic ancestors step by step, to trace the most recent common ancestor, or tMRCA, of all the copies of the gene. This leads us to genetic ancestry.
Genetic ancestry refers to people who have contributed to the composition of one’s genome. [5] The genome is the full set of genetic code each of us inherits from our parents and ancestors. Genetic ancestry refers not to your pedigree but to the subset of paths through it by which the material in your genome has been inherited.
One’s genetic ancestry consists of a small part of one’s genealogical ancestry. The genetic impact diminishes after the 4th or 5th past generation. For example, full siblings have identical genealogical ancestors but differ in their autosomal genetic ancestry because they inherit different chromosomal segments from their parents. For two siblings the average have 50 percent of the same DNA. [6]
The illustration below shows the average amount of autosomal DNA inherited by all close relations up to the third cousin level. The illustration uses the maternal side as a an example. The percentages can be replicated for the paternal side. [7]
Illustration 1: Autosomal Genetic Inheritance from Descendants
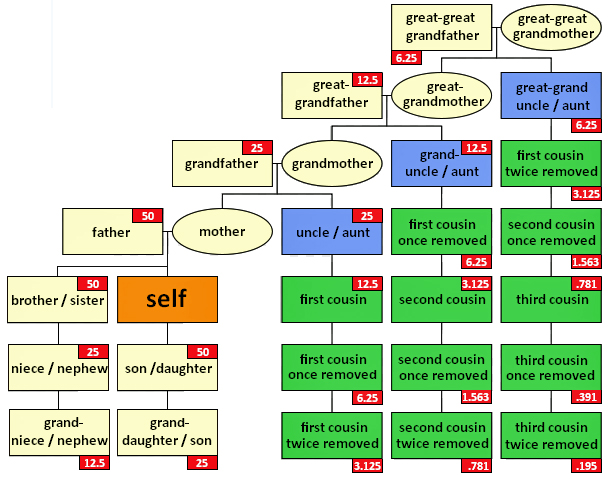
Autosomal DNA is inherited equally from both parents. The amount of autosomal DNA inherited from more distant ancestors is randomly shuffled up in a process called recombination and the percentage of autosomal DNA coming from each ancestor is diluted with each new generation.
For males, Y-DNA is inherited directly from the father and his direct male descendants through the Y chromosome. For females, X-DNA is inherited from both the father and mother. For all individuals, mitochondrial DNA is inherited directly from the mother and her direct female descents.
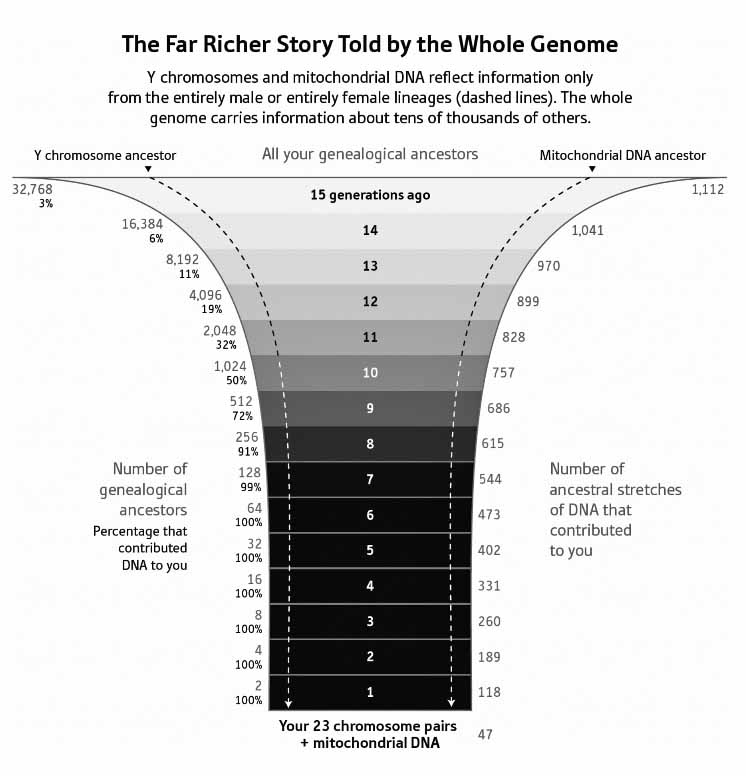
Another way of looking at the diminished impact of autosomal genetic inheritance through prior generations is viewing the entire genome of an individual. As indicated in illustration 2, the number of ancestors one has doubles every generation. However, the number of stretches (lengths of DNA that ancestors have contributed to you) increases by only around seventy-one per generation [8]. Going back eight or more generations it is almost certain that one will have some ancestors whose DNA did not get passed down. If one goes back fifteen or more generations, the probability that one ancestor contributed DNA directly is exceedingly small.
Illustration 2: Genomic Genetic Influence
Genetic genealogy or results from ancestry DNA tests do not tell you where each member on your family tree lived or their origins. Depending on the DNA test, they instead tell you how much of their DNA you have inherited from unspecified ancestors on each side of your family or through a maternal or paternal line.
Traditional genealogical research constructs family trees of individuals, exhibiting links , facts, and relationships between relatives. Genetic ancestry compares individual genomes, haplotypes, or sampled areas of chromosomes with other targeted individuals or with an average genome of a population reference sample. When geneticists and consumer DNA ancestry companies talk about genetic ancestry they are really talking about genetic similarity between populations and individuals, genetic distance, and most recent common ancestor [9]
Genetic Distance
The number of differences or mutations between two sets of Y-chromosome DNA or mitochondrial DNA test results. A genetic distance of zero means that there are no differences in the two results and there is an exact match. For autosomal DNA comparisons genetic distance relates to the size of a shared DNA segment. The genetic distance is then the length of the segment in centiMorgans. [9]
Haplotype
A modal haplotype is the most commonly occurring haplotype (a set of STR marker values) derived from the DNA test results of a specific group of people. The modal haplotype does not necessarily correspond with the ancestral haplotype – the haplotype of the most recent common ancestor. [9]
The ancestral haplotype is the haplotype of a most recent common ancestor deduced by comparing descendants’ haplotypes and eliminating mutations. A minimum of three lines, as distantly related as possible, is recommended for deducing the ancestral haplotype. This process is known as triangulation. [9]
the Most Recent Common Ancestor
In genetic genealogy, the most recent common ancestor (tMRCA) of any set of individuals is the most recent individual from which all the people in the genetic group are directly descended.[9]
Genealogical data can be represented in several formats, for example, as a pedigree or ancestry chart. Family trees are often presented with the oldest generations at the top of the tree and the younger generations at the bottom. An ancestry chart, which is a tree showing the ancestors of an individual and not all members of a family, will more closely resemble a tree in shape, being wider at the top than at the bottom.
Illustration 3: Example of Ancestry Chart
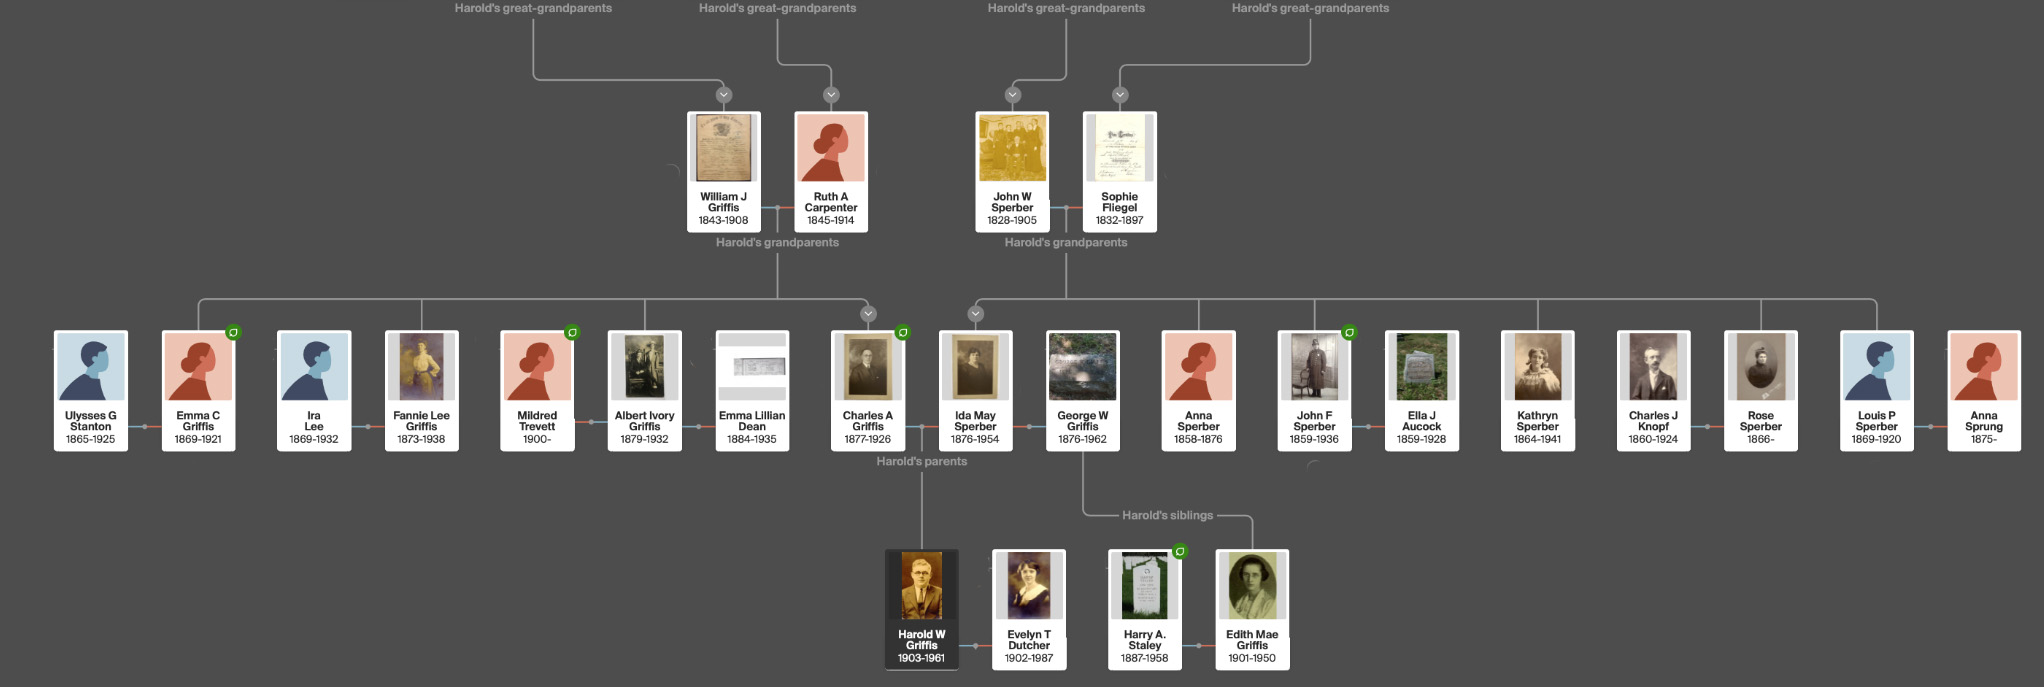
In a pedigree chart, an individual appears on the left and his or her ancestors appear to the right. Conversely, a descendant chart, which depicts all the descendants of an individual, will be narrowest at the top.
Illustration 4: Example of Pedigree Chart

In genetic genealogy, the changes or mutations in individual genomes are represented in phylogenetic haplogroup trees and in STR Distance Dendrograms.
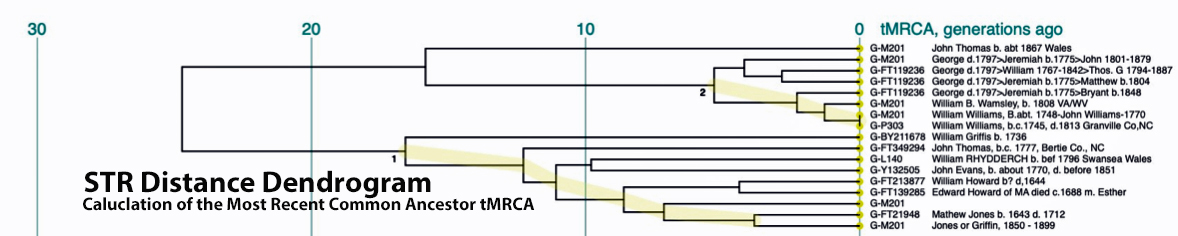
Illustration 5: Portrayal of Different Genealogical information : Phylogenetic Haplogroup Trees, Family Trees and Genetic Distance Dendrograms [10]

Click for larger view.
Click for larger, legible view.
Cultural ancestry is another category of how we define genealogy. It is based on whether someone is embedded in or exhibit the cultural traditions of a particular social group that may be based on a specific geographical area. It is oftentimes associated with ethnic and racial connotations or groups.
An intuitive example of the interplay between genealogical, genetic, and cultural ancestry is determining the tribal identity of an individual with a single Native American grandparent. This person may have not inherited any native American chromosome segments, their autosomal genetic ancestry would reflect zero percent Native American. However, if they were brought up in a Native American tribe, their cultural ancestry and way of living may exhibit native American customs. Finally, their genealogical ancestry would reflect that they are 1/4 Indian since they had one grandparent that was of Indian descent. Depending on the Native American tribe, there are different requirements based on genealogical ancestry to be recognized as part of the tribe. For example, the Eastern Band of Cherokee Indians require a minimum of 1/16 degree of Cherokee Indian blood for tribal enrollment, while the Bureau of Indian Affairs’ Higher Education Grant expects you to have the minimum of 1/4 Native American blood percentages. [11]
Another example of how cultural ancestry has been interpreted (or misinterpreted) is a humorous popular commercial from ancestry.com that illustrates the practical interplay and distinction of genealogical ancestry, genetic ancestry and cultural ancestry.
The use of cultural genealogy is often mistakenly used in the context of interpreting the results from traditional genetic genealogy tests. DNA is not the same as cultural heritage. Marketing tactics of various consumer based genealogy tests tend to play up the link between ethnic heritage or cultural ancestry and genetic genealogy [12]
The tendency to attribute cultural relationships with genetic results is also found when discussing what David Vance calls ‘deep ancestry’ or ‘lineages’. We need to be careful in a similar fashion not to associate deep ancestry haplogroups or lineages with historical cultures and, in turn, associating historical cultures with our personal ancestors. At this level, we rely more on archaeology and anthropology to describe groups of ancestors at the deep ancestry level.
Blending the three views of genealology
Scientific and scholarly advances in archaeology, linguistics, genomics, and ancient anthropology have revolutionized our understanding of history and prehistory . The study of the ancient human past is blurring the lines between humanities and science. Ancient genomics or paleo genomics, ‘deep ancestry’, can provide one but only a partial descriptive aspect of this study. It is apparent that that the reconstruction of ancient human migrations and their social characteristics is a complex subject that will continue to gain benefits from a multidisciplinary approach of study. Revelations in this multidisciplinary area will certainly add historical context to understanding genealogical ancestry. [13]
Various theories have been formed that describe large cultural groups and major population movements where most of the members of a genetic haplogroup may have lived and traveled. Common ancestors with matches from these time periods can be mapped and described but any information about where these ancestors lived and migrated is gained from studies that are not connected to our personal history. There is no direct evidence that our individual ancestors were part of the same culture or migration patterns that are documented in paleogenomics. We can not definitively associate deep ancestry haplogroups with historical cultures. However, the results of these multidisciplinary studies can provide a backdrop for interpreting or providing meaning and context to a haplogroup tree.
Analyzing DNA from present-day testers and ancient genomes provides a complementary approach for dating evolutionary events and migratory patterns. Certain genetic changes occur at a steady rate per generation. They provide an estimate of the time elapsed. These changes accrue like the ticks on a stopwatch, providing a “molecular clock.” By comparing DNA sequences, geneticists can not only reconstruct relationships between different populations or species but also infer evolutionary history over deep timescales.
“Molecular clocks” are based on two key biological processes that are the source of all genetic variation: mutation and recombination. [14]
Mutations are changes to the letters of DNA’s genetic code. DNA mutations can be used to estimate the timing of branches in our evolutionary tree. They compare the DNA sequences of two individuals or species, counting the neutral differences that do not alter one’s chances of survival and reproduction. The time needed to accumulate the differences can be calculated based on the knowledge of the rate of changes in the mutations. . This will indicate how long it has been since someone shared genetic ancestors from a common ancestor.
Recombination is the other major way DNA accumulates changes over time. It leads to the shuffling of the two copies of the genome from each parent which are bundled into chromosomes and mitochondria. The child’s genome is a mosaic of your parents’ DNA.
Genetic changes from mutation and recombination provide two distinct clocks, each suited for dating different evolutionary events and timescales. Because mutations accumulate so slowly, this clock works better for very ancient events, like evolutionary splits between species. The recombination clock, on the other hand, ticks at a rate appropriate for dates within the last 100,000 years.
Overview of DNA and Type of Genetic Genealogy Tests
There are, as reflected in illustration 6, essentially three sources of DNA for genetic testing:
- All 23 chromosomes (autosomal and sex chromosomes);
- Y Chromosome; and
- Mitochondrial DNA
Illustration 6: Location of DNA in Human Cell
As indicated in Table One, while limited to the paternal line of descent, Y-DNA tests can effectively track male genetic descendants back 300,000 years. Mitochondria testing of the matrilineal line can also provide results that go back over 140 thousands of years. The popular ‘ethnicity’ tests, as previously indicated, can trace back through a limited number of generations. While women have two X chromosomes, DNA testing of the X-DNA is usually tested along with other chromosomes as part of an atDNA test. [16]
Table 1: Type of DNA Testing
| Characteristic | Autosomal DNA | Y – DNA | Mitochondrial DNA |
|---|---|---|---|
| What does it test? | All 23 chromosomes | Y chromosome | Mitochondria |
| How far back? | 5 – 9 generations | 300,000 + years | 140,000+ years |
| What genealogical lines? | All ancestry lines | Paternal | Maternal |
| Available from: | – ancestry.com – Family Tree DNA – 23andMe – Myheritage – Living DNA | – Family Tree DNA – 23andME (high level) – YSEQ – Full Genome Corp | – Family Tree DNA – 23andMe – YSEQ – Full Genome Corp |
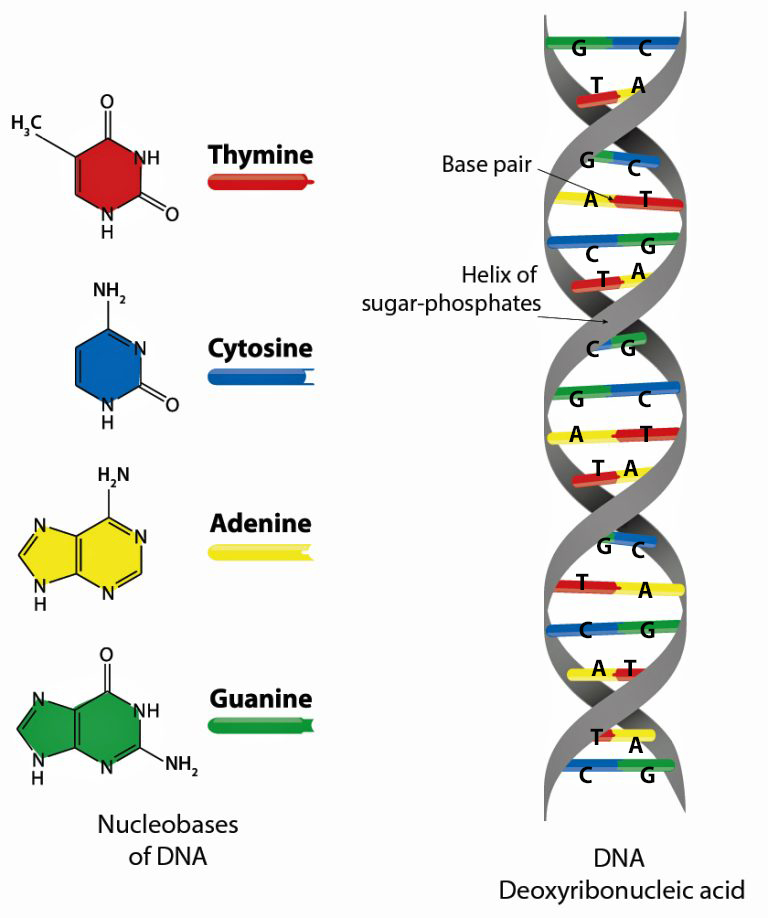
The human cell is a masterpiece of data compression. [17] Its nucleus, just a few microns wide, contains (if you spell it out) six feet of genetic code comprised in a double helix called the DNA: deoxyribonucleic acid. (See illustration 7) The DNA helical molecules string together some three billion pairs of nucleotides that are comprised of proteins, sugar (deoxyribose), a phosphate and four types of nitrogenous bases which are represented by an initial: A (adenine), C (cytosine), G (guanine), and T (thymine).
The nucleotides or base pairs are the cornerstone of genetic testing. They are the foundation of the programming language of our genetic code. Whenever a particular base is present on one side of a strand of the DNA, its complementary base is found on the other side. Guanine always pairs with cytosine and thymine always pairs with adenine. So we can write the DNA sequence by listing the bases along either one of the two sides or strands. When DNA companies perform their tests, they essentially separate the two stands of the helix and use one side of the helix as the template or coding strand when they map out an individual’s DNA results.
Illustration 7: Structure of Deoxyribonucleaic Acid
If bases are like the letters of your genetic story, individual genes can be thought of as paragraphs or strings of these bases, and chromosomes can be thought of as chapters of a book. In total, humans have about 20,000 genes located on 23 pairs of chromosomes.
In keeping with the book analogy, an human’s whole story is actually like receiving 2 different editions of a 23-chapter instruction manual, one from both parents. Within each set of chromosomes, one is a sex chromosome responsible for determining sex characteristics, while 22 are autosomes which provide information for everything else. In humans, there are 2 different types of sex chromosomes; the X chromosome or the Y chromosome. Mothers always pass along one copy of an X, while fathers can pass along either another copy of X to create a female or a copy of Y to create a male.
What we call a gene is actually tiny fragments of these base chains that typically contain around 1,000 unique sequences of the bases which are used a templates to assemble the proteins that do most of the work in our cells. In between the genes is the noncoding “junk” DNA. [18] Together, these chromosomes contain all of the information needed to build a human being.
It is mind boggling to comprehend that the a human genome is made of 3,200 million base pairs, split into these 46 chromosomes. What is equally amazing is an human genome is 98% identical to a chimpanzee’s genome, and 97% to a gorilla’s. Gorillas are in fact 97% identical to either humans or chimps, meaning that humans are more chimp-like than gorillas. In comparison, two random human beings are on average 99.5% identical. [19]
Illustration 8: Human Cell, Chromosome, DNA and Genes
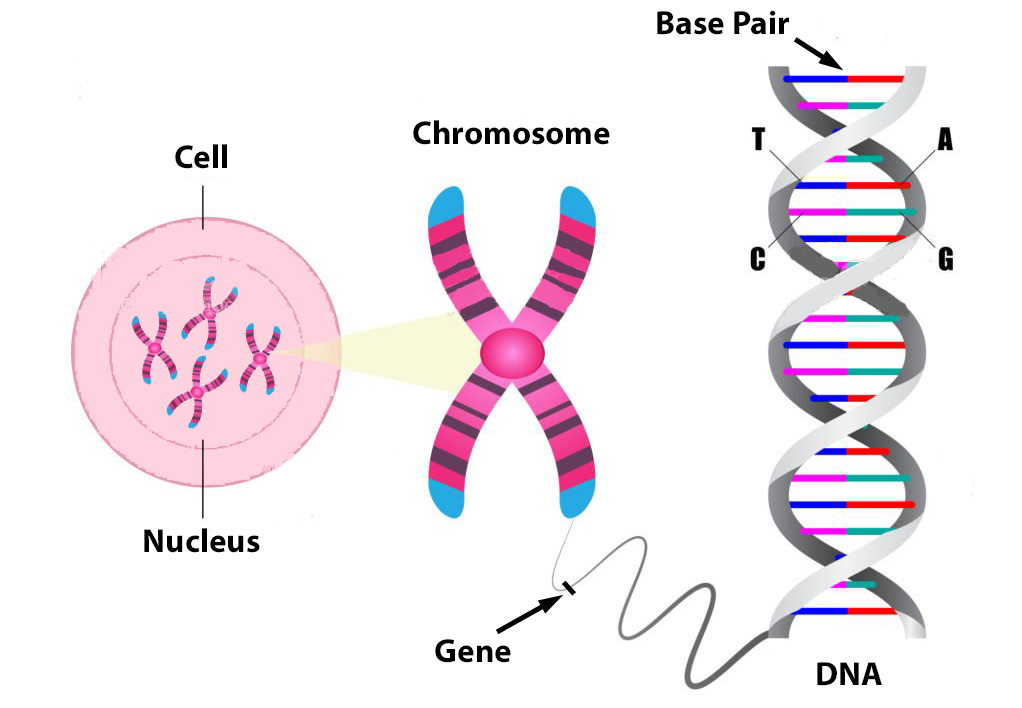
These DNA strands are divided into coiled chromosomes. Two of them—labelled either X or Y—determine our biological sex. The remaining twenty-two pairs, known as autosomal DNA, are encoded with information about our traits: bone structure, eye color, skin color, the stuff of being human.
Approximately 2% of our genome encodes proteins – this is where gene strands are located (illustration 7). Genes are the basic unit of inherited DNA and carry information for making proteins, which perform important functions in your body. The remainder of our genome is made of noncoding DNA, sometimes called “junk DNA”, which is a misnomer. It is estimated that between 25% and 80% of non-coding DNA regulates gene expression (e.g. when, where, and for how long a gene is turned on to make a protein).
Illustration 9: Coding and Noncoding DNA
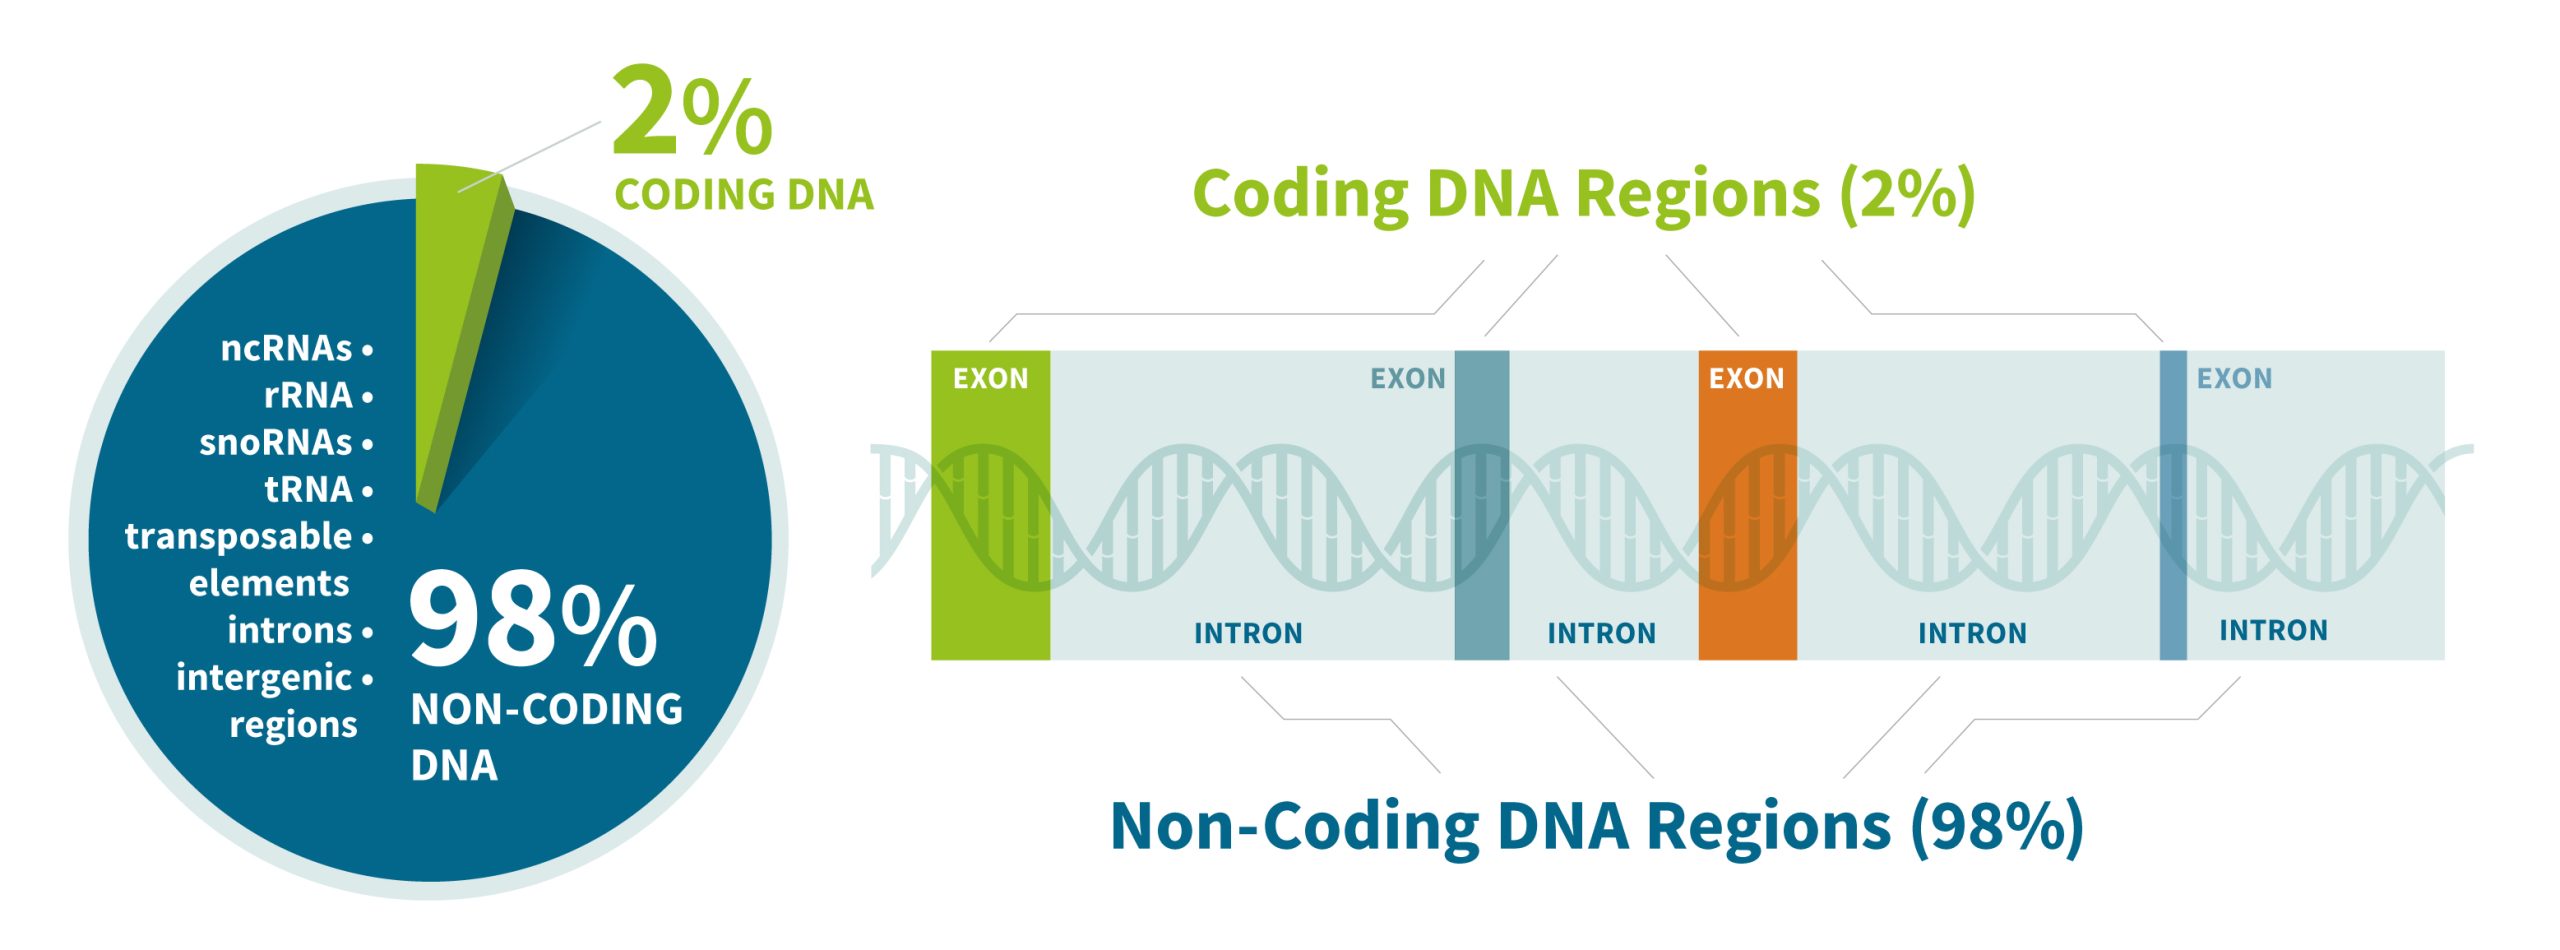
One way to think about this is to resort to the book analogy again, imagine your DNA as cookbook paragraphs with recipes for making proteins. The paragraphs with the list of ingredients and measurements are your genes—there are only a few of these pages in the cookbook. The other paragraphs are the recipe instructions, telling you how and in what order to do things. The non-coding DNA that does not regulate gene activity is composed either of deactivated genes that were once useful for our non-human ancestors (like a tail) or parasitic DNA from virus that have entered our genome and replicated themselves hundreds or thousands of times over the generations, or generally serve no purpose in the host organism. [20]
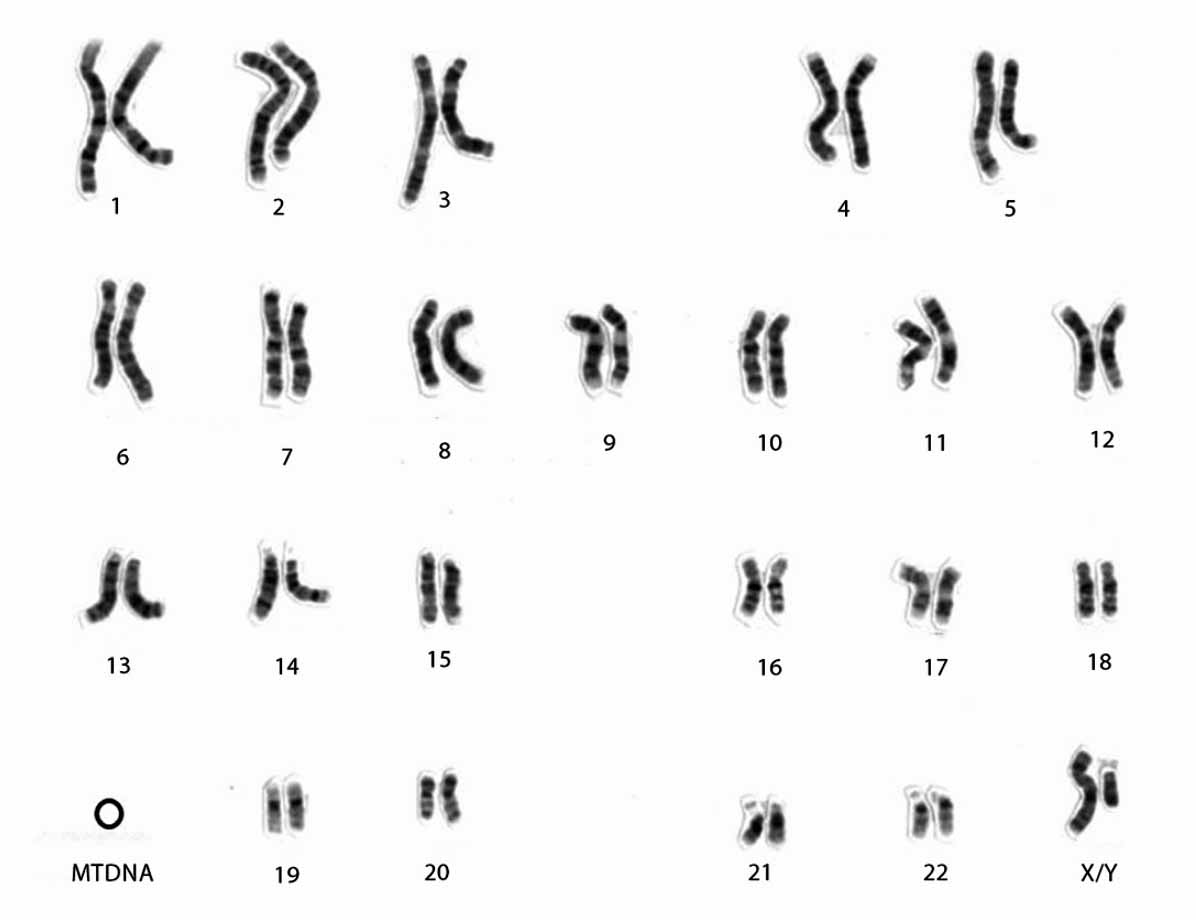
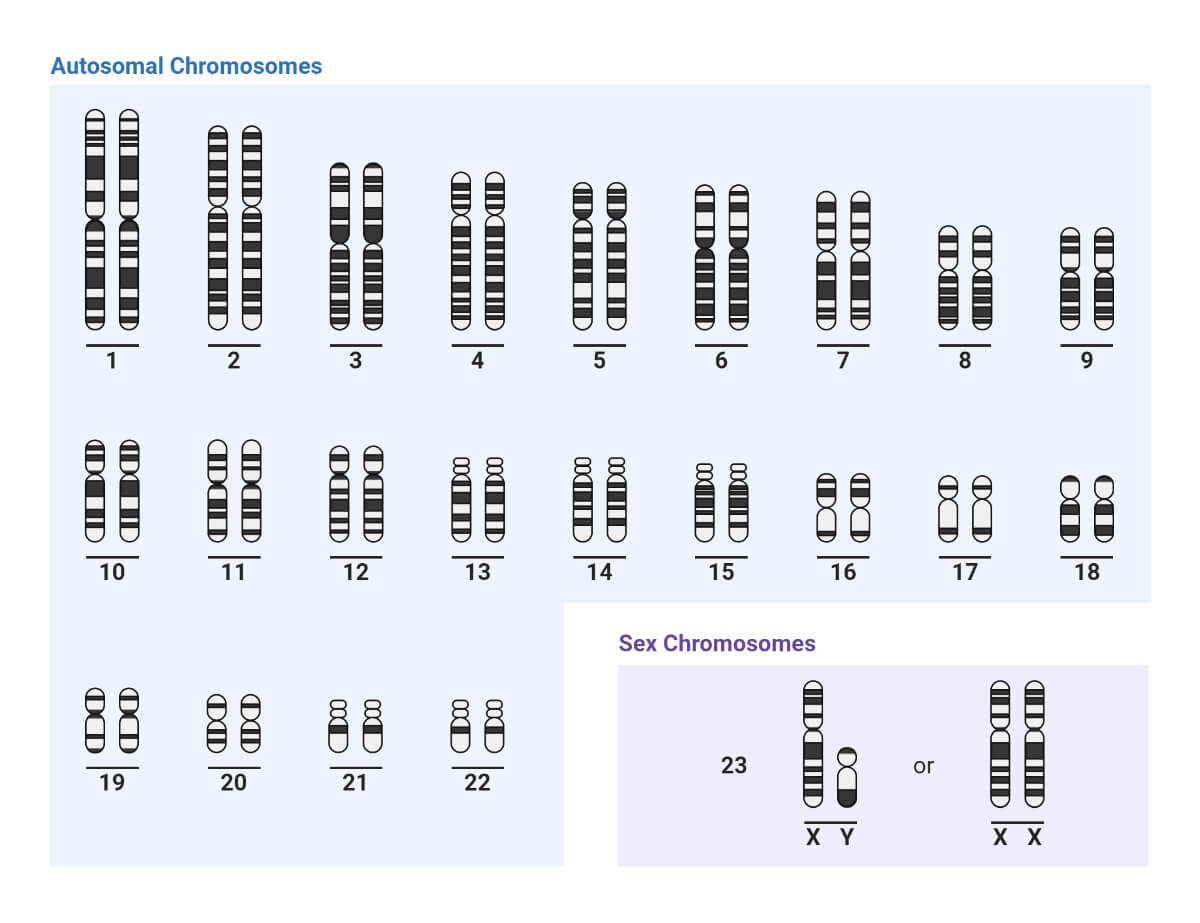
The order of the base letters can be read by DNA sequence machines that perform chemical reactions on fragments of DNA, releasing flashes of light as the reactions pass along the length of the DNA sequence. The reactions emit a different color of each of the bases so that the sequence of letters can be scanned into a computer by a camera. Illustration 8 is an example of a photograph of all of the chromosomes.
Illustration 10: Karyogram of Human Chromosomes
Click for larger view.
The following illustration 11 provides an ideogram of all of the human chromosomes. Basically an ideogram provides a schematic diagram of a chromosome that shows the mapping or location of genes as bands. I have provided this illustration as a precursor to discussing the location of genetic markers on the Y-DNA chromosome that are used for Y-DNA testing.
Illustration 11: Idiogram of Human Chromosomes
Click for larger view
Since humans share roughly 99 and a half percent of the same chromosomes, mutations with that half percent are the source of ‘genealogical’ variations among humans. It is in those regions of the DNA that are variable where genetic ancestry distinctions are found. DNA polymorphisms (letter changes in the nucleotides) are currently the choice markers in DNA ancestry testing. The concept of ancestry markers, referred to as ancestry information markers (AIMs) has been documented and validated in numerous studies.
Ancestry information markers refers to locations in the genome that have varied sequences at that location and the relative abundance of those markers differs based on the continent from which individuals can trace their ancestry. So by using a series of these ancestry information markers, sometimes 20 or 30 more, and genotyping an individual you can determine from the frequency of those markers where their great, great, great, great ancestors may have come from. [22]
When analyzing DNA for genealogical purposes it was found that that there are specific regions in the DNA that provide reliable, efficient areas to identify these differences. These regions are analyzed in detail and look at representative sections called markers, distributed across a large region of a chromosome. Each marker has specific variations (or values) called alleles . Each marker has also been found to change at different rates of mutation. Looking at allele variations among a wide set of markers has been found to be an effective approach to studying differences between groups of genomes (individuals) and identifying a unique genome (haplotype) . Each of us have an unique haplotype based on specific DNA markers.
The DNA testing methods used by the majority of scientific research and genetic DNA companies focus on evaluating the differences of values (alleles) in specific base sequences contained in the DNA strands. These differences are due to random errors (mutations) in copying genomes. It is these differences, incurring about every thousand letters in both genes and junk DNA that geneticists study to learn about past generations and how similar we are to others that have completed similar tests.. Over the three billion letters in the genome there are around three million differences separating two genomes.
The type of testing technology used by Family Tree DNA, 23andMe, Ancestry.com, and similar companies test less than 0.1 percent of your genome. Their tests, which are called genotyping microarray tests, do not sequence your genes and do not test your whole genome. Although the sequencing of an entire genome currently costs less than $1000, the analysis, interpretation and counseling brings the cost to $3000 (though in the case of cancer treatment the cost will be $10,000). [23] If humans differ by 0.1 percent of the genome, then only 15 percent of that 0.1 percent can explain a lot in terms of population differences. [24]
As DNA is copied and passed passed down through successive generations it gradually accumulates more mutations. People more closely related to each other have fewer differences in the sampled DNA markers. The more distantly related one is from another relative, more differences or mutations can occur.
At its most simplest level of explanation, genetic DNA testing is based on an analysis of a specific, targeted sampling of these nucleotide locations on a DNA strand in a chromosome or mitochondia. The specific values exhibited at the these targeted locations are then utilized to identify the tester’s haplogroup and locate the results on a branch of the Y-DNA haplotree. The results are also used to determine the similarity of the results with other individual samples.
The higher the density of differences separating two genomes on any segment, the longer it has been since the segments shared a common ancestor as the mutations accumulate at a more or less constant rate over time. The density of differences provides a biological stopwatch, a record of how long it has been since key events occurred in the past. [25]
The Basis of Y-DNA Testing: “Snips” (SNPs) and “Strings” (STRs)
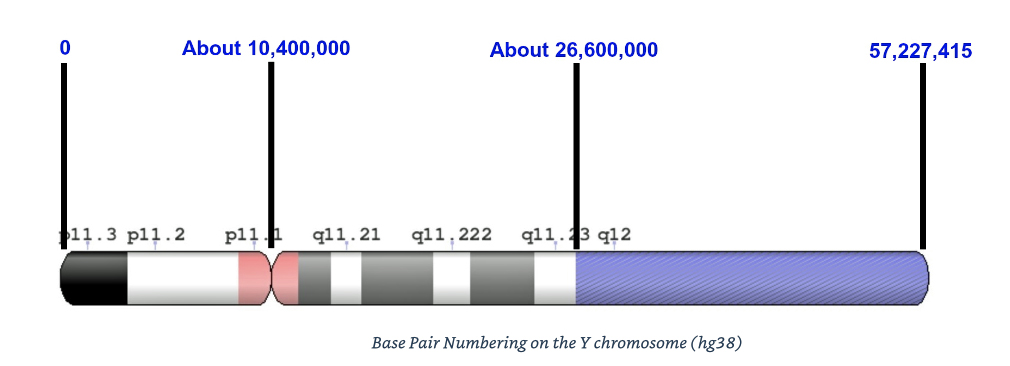
It has been determined that the Y chromosome is 57,227,415 base pairs in length. Not all these base pairs are suitable for genetic analysis. The two tips of the chromosome are called telomeres and are known as pseudoausomal (PAR) regions (PAR1 is 2.7 million base pairs in length and PAR2 is 0.34 million base pairs in length). The PAR areas are not utilized for genetic testing since they do not have stable regions to trace Y-DNA markers. These two end areas can recombine with the X chromosome, this is why these areas are referred to as “pseudo autosomal” regions. [26]
There are other areas of the Y chromosome that are not ideal for genetic testing. These hard to read areas are made up of regions of highly repetitive base pairs that are not suitable for the ‘short read’ DNA testing technology that companies typically use. While Family Tree DNA has been successful in reading some of the difficult to read areas using their third generation sequencing techniques associated with their Big Y 700 test, the bulk of these areas are not considered useful for current genetic genealogy (areas generally depicted in the right hand shaded area in illustration 12). Subtracting those hard to read regions of the Y Chromosome, one is left with about 40 percent or 57.2 million base pairs on the Y chromosome. [27]
Illustration 12: Base Pair Numbering of the Y Chromosome
There are basically two major types of mutations on the Y chromosome that are analyzed and used to identify Y-DNA haplogroup affiliation, haplotypes, and estimating genetic distance through a variety of DNA tests in genetic ancestry.
Single Nucleotide Polymorphisms – SNPs
“Snips”
Single nucleotide polymorphisms, frequently called SNPs (pronounced “snips”), are the most basic type of genetic variation. SNPs center on mutations associated with a single base letter or nucleotide position in the DNA strand on the Y chromosome. For example, a SNP may replace the nucleotide cytosine (C) with the nucleotide thymine (T) in a certain stretch of DNA. [28]
A SNP is a difference of a single nucleotide between two males which identifies a mutation. If only one descendant exhibits the mutation, the SNP would appear to be a private variant (a term used by Family Tree DNA) or an novel SNP (a term used by YFull) of the SNP for the individual. Once two or more descendants test and are identified as sharing the mutation, the variant would be given a name by the testing company or lab. It may possibly have several synonym names given by several labs. [29]
Essentially, a male in whom a SNP mutation first appears passes it on to his sons and all their male descendants which could be hundreds or several thousand years. Over time specific other SNPs change, but the earlier changes in the other SNPs are still preserved through the generations. Y-DNA therefore contains a cumulative record of all of the SNP mutations that have ever occurred in a man’s paternal line.
SNPs are a genetic source to document genetic ancestry and the Y-DNA haplotree. Based on the tracking of the various SNP mutations, SNPs provide reliable information on one’s position in the Y chromosome haplotree and haplogroups – providing information on deep ancestry. Each branch in the Y-DNA haplotree represents an individual who had an unique SNP mutation and passed that mutation on to subsequent male descendants.
Short Tandem Repeats – STRs
“Strings”
The second type of mutation focuses on variations of repeated patterns of two or more nucleotide sequences at designated positions on the Y chromosome. Short-tandem repeats (STR’s), pronounced as ‘strings’, are also known as microsatellites. STR’s occur at specific locations on the Y-chromosome, which are often referred to as loci. [30]
“STRs are analogous to a genetic stutter, or the copy machine getting stuck. ” [31]
These repeated patterns vary in the length and number of repeats. For example the STR marker named DYS393 has a repeat motif of base nucleotides AGAT with a repeat (allele) range of 9-17. [32] So the allele value for the following repeat pattern for the DYS393 marker would be 9:

The number of repeats that a specific person has in a STR typically gets passed down to their sons unchanged. However, sometimes a copy error occurs and a repeat is gained or lost.
By themselves, Y-chromosome DNA (Y-DNA) short tandem repeat (STR) markers from a Y-DNA test do not have any particular meaning. The value of testing Y-DNA STR markers comes from creating a Y-DNA signature (haplotype) and comparing that Y-DNA signature to other testers in a database.
A Y-DNA STR signature or haplotype will comprise the allele values for a set of 12, 25, 37, 67, or 111 STRs (depending on the test). The more STRs that are part of the comparative signature, the ‘more reliable’ the results when comparing other testors’ results. They are useful for genetic genealogy because an individual’s Y-DNA signature distinguishes their paternal lineage from others. They can then be used with a company’s comparative database to discover genealogical connections or historic ancestry. Oftentimes, specific allele values for specific STRs are also associated with specific haplogroup subclades.
By comparing more markers, we are able to get a clearer idea or more reliable estimate of the degree of similarity between two or more Y-STR signatures. The more differences there are in the markers, the more generations have passed since the paternal line split for the two individuals. If you think of the matching database as a puzzle consisting of 111 pieces, the more pieces you compare means the more complete the picture becomes.
Because there are many more places within an STR than an SNP for a copy error to occur, STRs have a faster mutation rate than SNPs. Unlike SNPs, STRs rarely go more than a few hundred years without a change.
Depending on specific STRs, the mutation rates can vary. The results of these mutations largely provide information on matching other testers at what we have referred to as the “deep lineage perspective”. [33]
More on Snips (SNPs)
There are roughly 15 million SNPs in a person’s genome. To be technically classified as a SNP, a variant is found in at least 1 percent of the population. This definition of a SNP is a bit circular since it would be difficult to state with certainty that a given SNP represents one percent of the population. [34]
Any of the positions in the Y-DNA are potential candidates for a mutation of various types. Any change in a specific base letter can be considered a SNP. However, technically the type of mutation, from a genetic standpoint of interest, is what is called a Unique Event Polymporhism (UEP). UEPs are basically rare mutations that occur so infrequently that they are considered to all come from a single, common ancestor. The EUP markers were used to establish the haplotree and are continued to be used to establish new ‘branches’ or subclades in the haplotree. The EUP is the central tenet on which the Y-DNA haplotree and the genealogical analysis of deep ancestry branching, using SNPs, is based. [35]
The properties of UEPs can be contrasted with those of short tandem repeat sequences (STRs). Unlike UEPs, STR sequences are highly variable, and there is a significant probability that one of a set may have changed its repeat number after only a few generations. That makes a particular STR haplotype much more specific, matching a much smaller number of people. But it also means, at least in the case of Y-STR markers, that quite unrelated lineages may have converged to the same combination of Y-STR markers entirely independently by different routes. This is known as convergence. Without knowledge of one’s major Y-DNA Haplogroup or branch (subclade), one can erroneously conclude that two similar haplotypes are genetically related. [36]
There are a few exceptional cases where Y-STR markers can take on the status of UEPs, typically where a large-scale deletion event may have occurred, causing a sudden big change in the Y-STR repeat number rather than the usual single increment or decrement, which can be considered to have been a unique one-off in a group of lineages. Such a change in the STR marker DYS 413 for example distinguishes subgroup J2a1 from J2a in Y-DNA Haplogroup J. [37]
The relative mutation rate for an SNP is extremely low. This makes them ideal for documenting or marking and tracing the history of genetic mutations in the human genetic tree (haplotree) over long periods of time. Many generations can pass without a SNP occurring. This means that SNPs that occur in a specific lineage are unique and seldom change back. They occur thousands or tens of thousands of years ago. Some are more recent, and as science evolves as well as the increase of commercial DNA testers increases, more EUPs are being discovered in just the past few generations. [38]
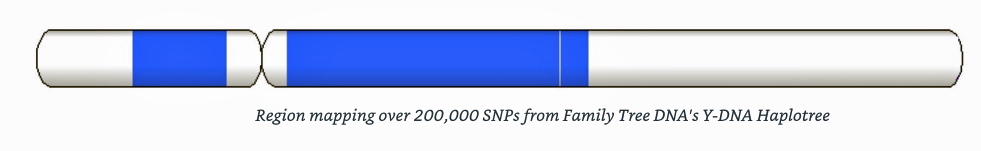
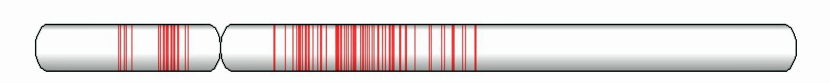
Presently, Family Tree DNA has identified over 200,000 markers or SNPs on their public Y-DNA haplotree. The illustration below reflects where those SNP markers are on the Y chromosome. This does not represent all the SNPs discovered by the company but the ones that have been mapped on their public haplotree. [39]
Illustration 13: Region on Y Chromosome Where SNPs have been Mapped
The labeling system for SNPs is not intuitive. SNPs are technically identified based on a Reference SNP Cluster Id (RSID). The specific identification is assigned and documented in the National Center for Biotechnology Information (NCBI) dbSNP database. Whether or not a SNP is given a name, it has a documented position on the Y chromosome and a mutation description. A SNP will sometimes be referred to based on its position in a format like ‘12345678-A-G’ which means that the SNP as a mutation from the A to G base at position 12345678 on the Y-chromosome.
The general format for a SNP name will include an alpha prefix and a number suffix. The alpha prefix identifies the lab or analysis company which first discovered the SNP or was the first to decide that the mutation at that position on the Y- chromosome was worthy of a name. The letters are followed by a series of numbers which are an unique number assigned by the laboratory or company which named the SNP. The names of SNPs have no relationship to its position on the Y Haplogroup tree. The names are completely assigned independently on how old the SNP might be, an artifact of timing and discovery. [40]
More on Strings (STRs)
Y-chromosome STRs have demonstrated their value in the forensic identification of male Y-DNA from sexual assault cases, tracing paternal lineages to aid in missing persons investigations, historical studies and to help linking families through genetic genealogy. Forensic Labs usually use PowerPlex Y (Promega Corporation) and Yfiler (Applied Biosystems) kits that examine 12 or 17 Y-STRs, respectively. [41] Genealogical DNA test labs currently examine over 700 Y-STRs. and provide a range of different Y STR tests depending on the number of STRs tested. [42]
DNA testing companies or labs in certain cases use different nomenclatures to designate the same Y-STR allele. A conversion must be applied in these cases to accurately compare Y-STR results obtained from different companies. The most common nomenclature is based on guidance provided by NIST for Y-STR markers historically reported differently by various companies. The NIST standard is the proposal of ISOGG (International Society of Genetic Genealogy) for genetic genealogy companies.
In the year 2000 when the field of genetic genealogy was emerging, there were only about 20 Y-STR markers known to exist on the Y-chromosome. [43] Around 2008, there were about 400 STRs identified on the Y chromosome, many of which were not useful for forensic or genetic research. The various companies that provided Y-STR results to the genetic genealogy community at that time used about 120 different loci or STRs. However, many of STRs overlapped between test providers and the various allele values similar STRs were different between companies and organizations. [44]
Over time, a number of STRs located at specific areas of the Y-chromosome were consistently collected and compared. These STRs currently represent the most consistently studied set of mutations used for analyzing data across all men who have tested their Y-DNA. These markers were originally selected based on their ability to be reliably reported and had a mix of mutation rates (slow to fast) that could effectively discriminate differences between individual tests. [45] Presently, over 28,000 STRs in the Y-DNA have been identified and most have yet to be identified. [46]
Testing additional STR markers can also help refine the matches and refine DNA results for the individual placement on the Y-DNA haplotree. Testing more than the traditional 111 STR markers means that the information is more relevant to your personal ancestry related to the deeper origins of one’s genetic personal history (historical and anthropological). The Big Y-700 SNP test provides these type of results. There were at least 500 STRs in the Big Y-500 test and there are at least 700 STRs in the Big Y-700 test (111 + 589), however, the additional 589 are currently extraneous information for STR based testing as the matching system for those STRs is not yet fully developed. [47]
All STRs are given a unique identification number. The format usually includes a three alpha prefix and then a number. For example, for the STR named DYS393: the D indicates that the segment is a DNA segment, the Y indicates that the segment is on the Y chromosome, the S indicates that it is a unique segment, and the number 393 is the identifier. [48]
For purposes of genetic genealogy, over the course of the past 20 years, 111 of the STRs have been identified, named, and have been used for Y-DNA research. These markers were originally selected based on their ability to be reliably reported and had a mix of mutation rates (slow to fast) that could effectively discriminate and differentiate differences between individual testers.
STRs may change by adding or subtracting a repeat or two during the replication process. Estimates of the frequency of changes range from less than 2 mutations per 1000 generations to over 7 per 1000 generations for each STR, depending on which marker. Over a long period of time, individuals will tend to have at least some differences in the values (number of repeats) on the various STR markers on their Y-chromosome. If you look at 25 markers, there is about a 50% chance you will find at least one mutation in 9-10 generations (or, counting both up and down from a common ancestor, between yourself and a 4th cousin). For example, STR marker DYS391 can have allele values ranging from 7 to 14 repeats, with 10 and 11 being common in populations with European ancestry. [49]
Illustration 13: Idiogram of Y Chromosome Showing Location of the First 111 STR Markers for Y-DNA Test
The 111 STRs are usually broken into four subgroups based on testing options that make up the bulk of the matching databases: 12, 27, 64, and 111 markers. Based on studies, the first 12 markers are by comparison relatively slow having an average mutation rate of around one mutation every 16,000 years. The first 37 markers are the most volatile markers 13-37, having an average mutation rate every 7,700 years. The next 67 markers (37-67 including the prior markers) have an average rate of 11,000 years. The full set of 111 markers have an average mutation rate of 11,000 years. [50]
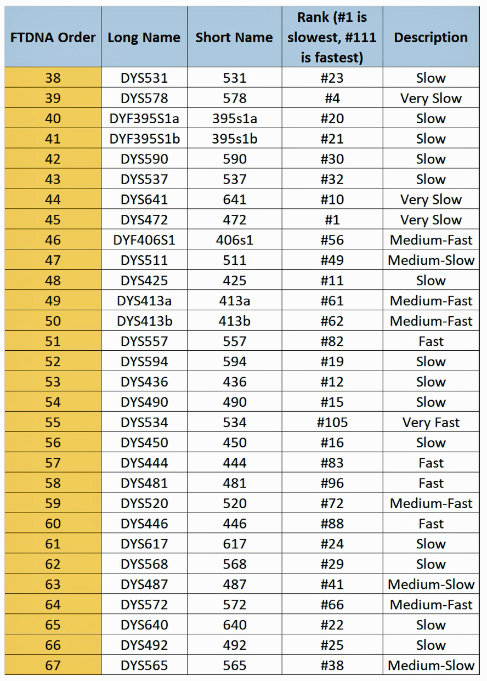
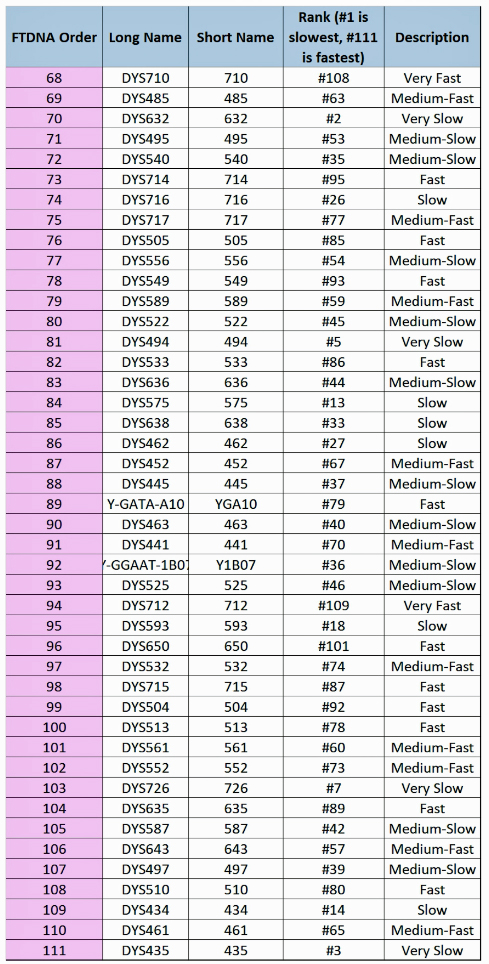
The following three charts list all of the STR markers that are used in the standard Y-111 STR test with the mutation rates.
Illustration 14: Mutation Rates of the 111 STR Markers Used in FTDNA STR Tests [51]
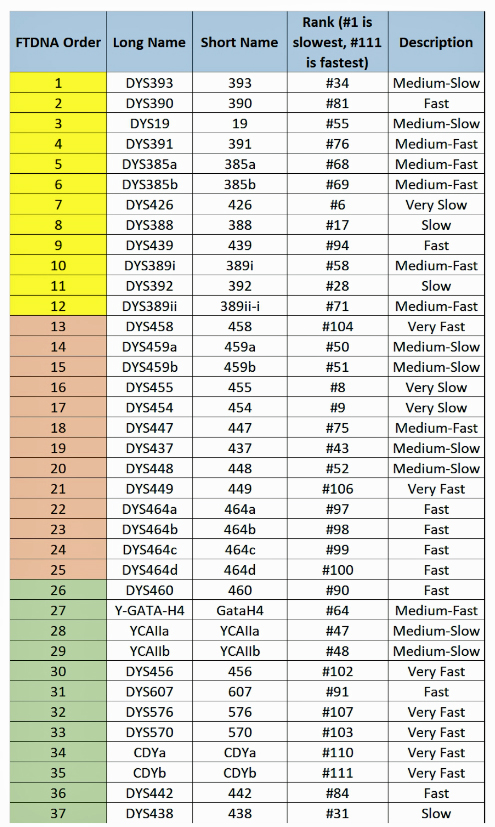
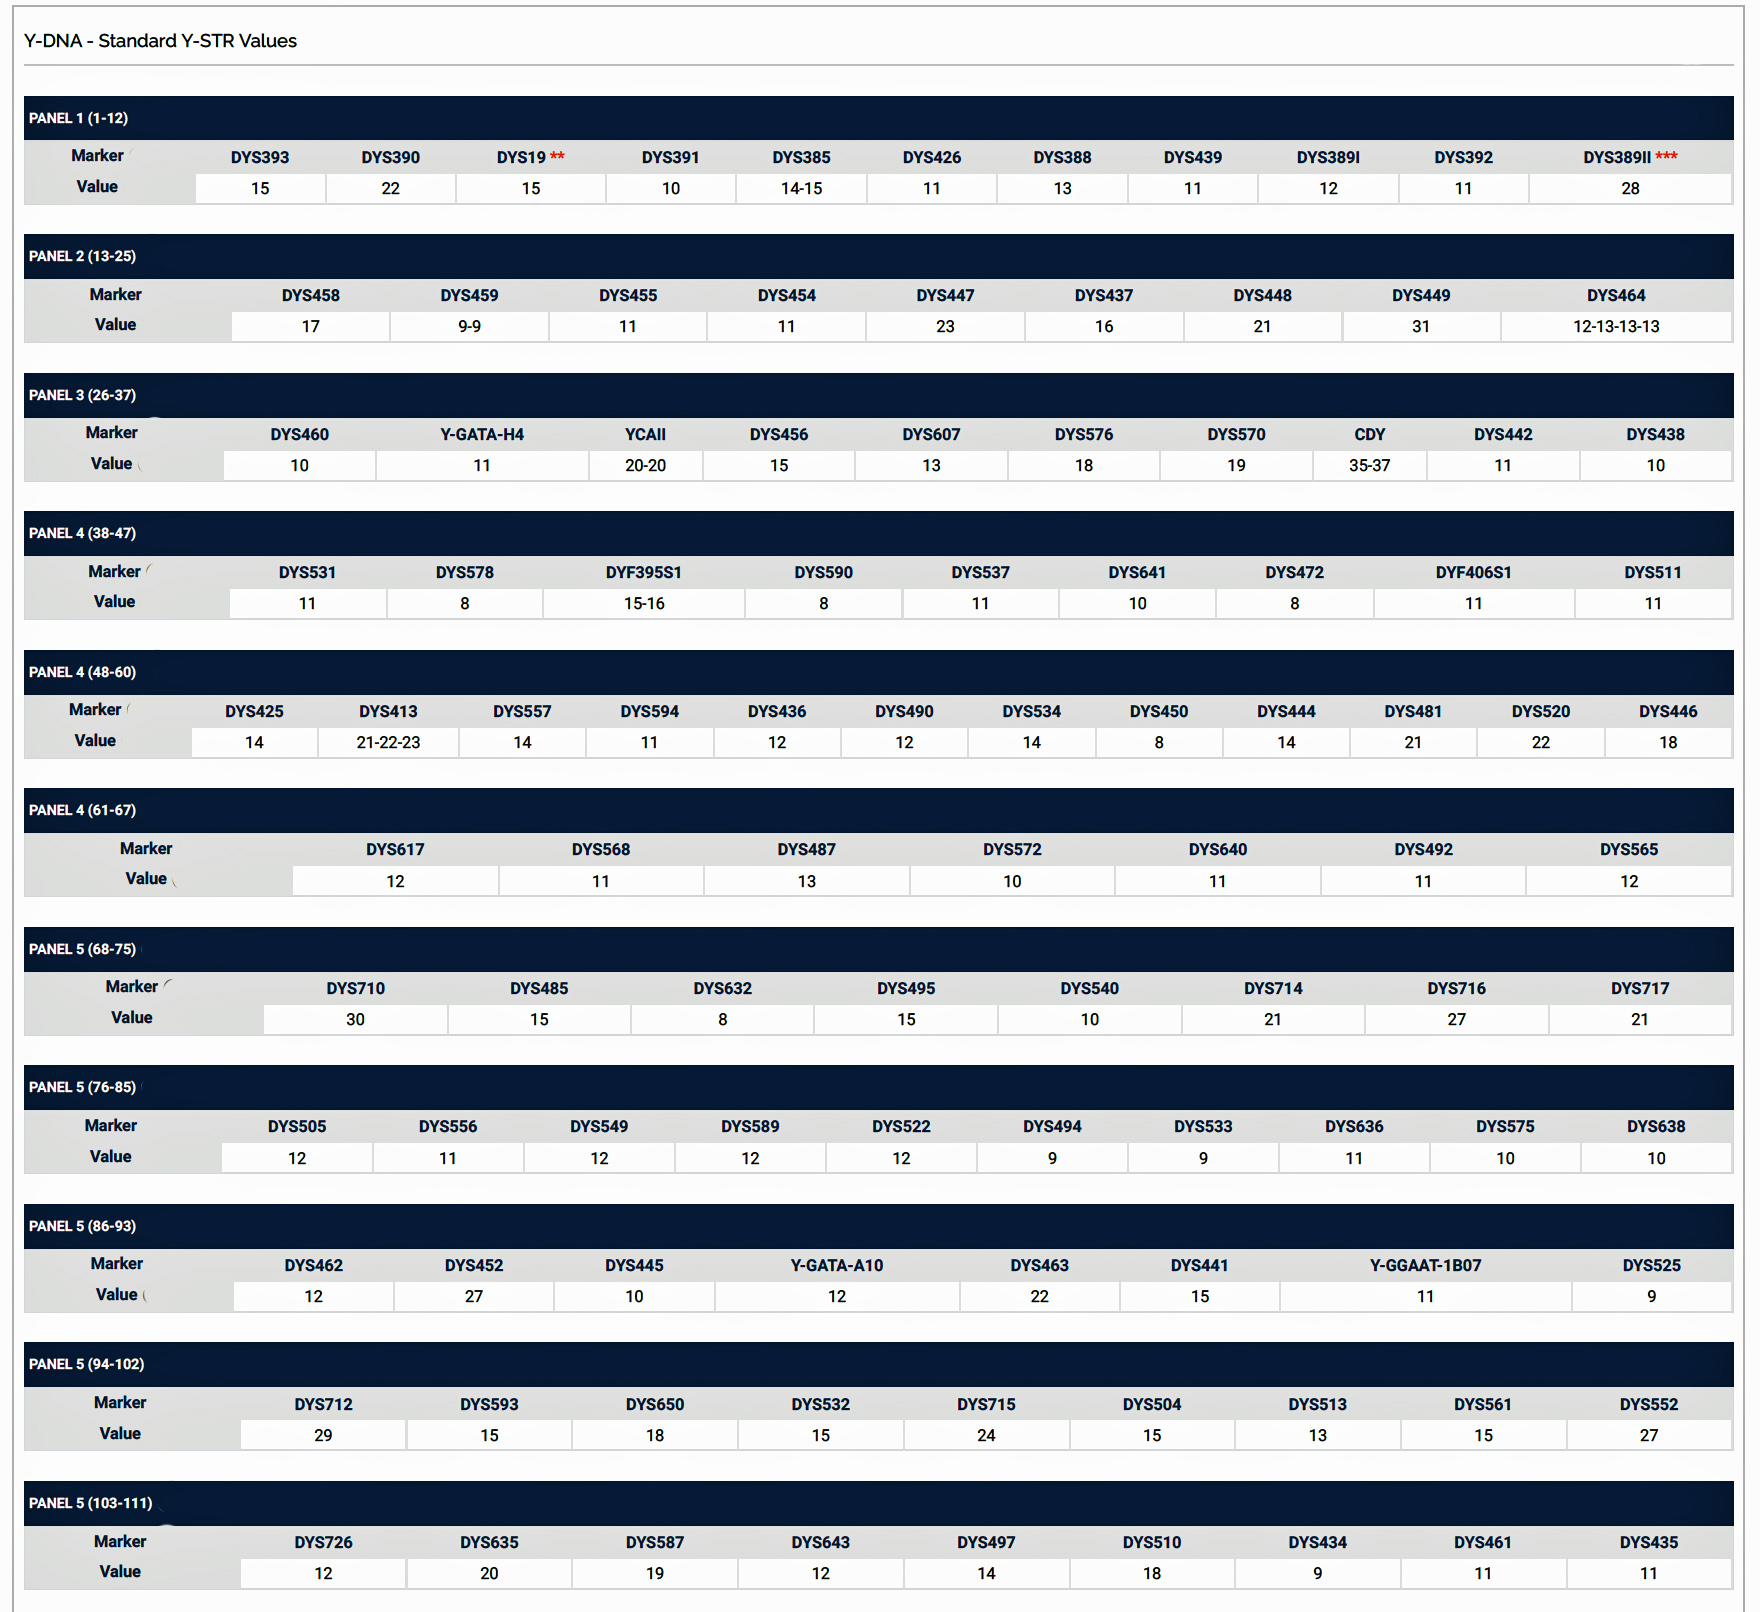
The following chart (Illustration 15) represents the results of my Y-DNA STR 111 test from FTDNA. The number below each STR marker number indicates the allele value , i.e., the number of times a particular sequence of alleles repeats itself in a specific location on the Y chromosome. The combined values for these markers is my Y-DNA signature (haplotype). It can be used to compare my results with other Y-DNA testers.
Illustration 15: Y-DNA STR Values (Haplotype) for the Y-111 STR Test for James Griffis
Using SNPs & STRs for Three Periods of Ancestry
As referenced in part one of this story, going back to J David Vance’s time scaled classification of of three levels of ancestry: Deep Ancestry, Lineages and Traditional Genealogy, SNP and STR mutations play various roles in analyzing Y-DNA in each of these time periods.
Three Periods of Ancestry: J David Lance Click for larger view
Deep ancestry time frames will, for the most part, rely on SNPs. [51] Both STRs and SNPs can be used within the time range of Lineages where one can trace a particular male line of unnamed ancestors. Traditional genealogy, if available, can help corroborate facts with regions or countries that common ancestors likely came from and where more than one surname may have been used. Within the time frame of traditional genealogy, all three sources of data can be helpful.
As DNA sequencing technology has improved and new tests have become available, such as the Full Y and Big Y tests, new mutations are being very rapidly discovered which blurs the line between the time frames that had been used to separate these types of tests. In fact, now they are overlapping in time. SNPs are in some cases becoming useful at the traditional genealogical level. These newly discovered family SNPs are relatively new, they emerged between the current generation and 1000 years ago. Although more individuals are completing Y-DNA tests, we should not expect to find huge numbers of these newly developed mutations in the population. [52]
As stated earlier, using both SNPs and STRs will potentially provide more specificity in tracing the patrilineal line from deep ancestry, through the middle area of lineages and into the more recent historical area of surnames and traditional genealogy. STR markers will generally mutate more frequently than SNPs. SNP testing is getting better all the time and the advanced tests can now find SNPs every two or three generations, but STRs still mutate faster than that so sometimes you will have branches of the haplotree where no SNP mutations have been identified over a time period and you can not easily determine branching if you do not have the SNP branching points to navigate. However, STRs can show you where mutations have occurred which are more frequent than SNPs and they can mark branches that are not otherwise identified by SNPs. So you can get a little more granularity out of STR testing.
Similar to David Vance’s three periods of ancestry, Rob Spencer provides a graphic portrayal of tracing one’s ancestor’s based on three levels of research (illustration 16). Traditional genealogical paper trails and research can provide information in the recent past. For our family the paper trail start to run dry way before 300 years. Moreover, the onset of Welsh surnames is more recent than 1,000 years ago! Although the time spans for paper trails and surnames might vary, the illustration provides a good graphic relationship between traditional and DNA based genealogical research. The use of Y-DNA research can help trace unknown ancestors prior to the use of surnames, pinpoint possible regional areas where ancestors lived, and provide possible links to the recent past. Y-DNA research, coupled with archaeological and paleogenomic discoveries can also shed light on macro level connections to migration patterns that can be associated with genetic ancestors.
Illustration 16: Three Levels of Genealogical Research

Click for Larger View.
STR and SNP Tests
“The wise genealogist isn’t wedded to any particular technology or data source, but rather understands the strengths and limitations of SNPs, STRs, and paper genealogy, and uses each appropriately. Each can complement the others.” [53]
Similar to traditional genealogy, genetic genealogy is a continual process of gathering, updating and organizing information. Using single nucleotide polymorphism (SNP) test results along with short tandem repeat (STR) test results can provide a high level picture of ancestral patrilineage and possible discoveries of family ties in the recent past. [54] The relative strengths of SNP and STR tests are uniquely suited at each of the three levels of ancestral research.
Illustration 17 provides a depiction of the relative strengths of using SNP and STR tests for various historical periods of time. It also depicts the emerging overlap between the two tests as SNP tests have identified newer, more recent Y-DNA mutations. The illustration indicates that STR tests are very useful when analyzing test results between testers back to 1000 years or approximately 7 SNP mutations back from the tester.
Illustration 17: Using STR and SNP Tests at Different Historical Periods
Click for Larger View..
Illustration 18 (below) provides a general explanation and some of the basic differences between SNPs and STRs. The top part of the image deals with STRs and the bottom deals with SNPs. [55]
The example provides a illustrative string of DNA nucleotides starting with “GAAAGACTACT…” (basically one mirror side of the double helix). The string represents a segment of the DNA strand. There are three examples of STR positions that are marked by brown boxes, the first STR has five repeats and the second and third have three repeats each. As discussed, STRs have names which can appear like the examples listed in the illustration: DYS369, CDX, or FT2986. Each of the STRs have specific positions on the Y chromosome. When they are read, the number of repeats is reported. In this example, the first STR has a value of 5 and the second and third STRs have a value of 3 each. Typically, STR values or Alleles will actually fall more into the 11, 12, 13, and higher number ranges. A STR test may typically test 37, or 67, or 111 “markers”. Older STR tests might have had 12 or 25 markers tested. The tester will get as many of these documented STRs as the test will check. In the Big Y testing testers get up to 838 STRs in the current Big Y 700 test.
Illustration 18: Comparison of STR and SNP Tests
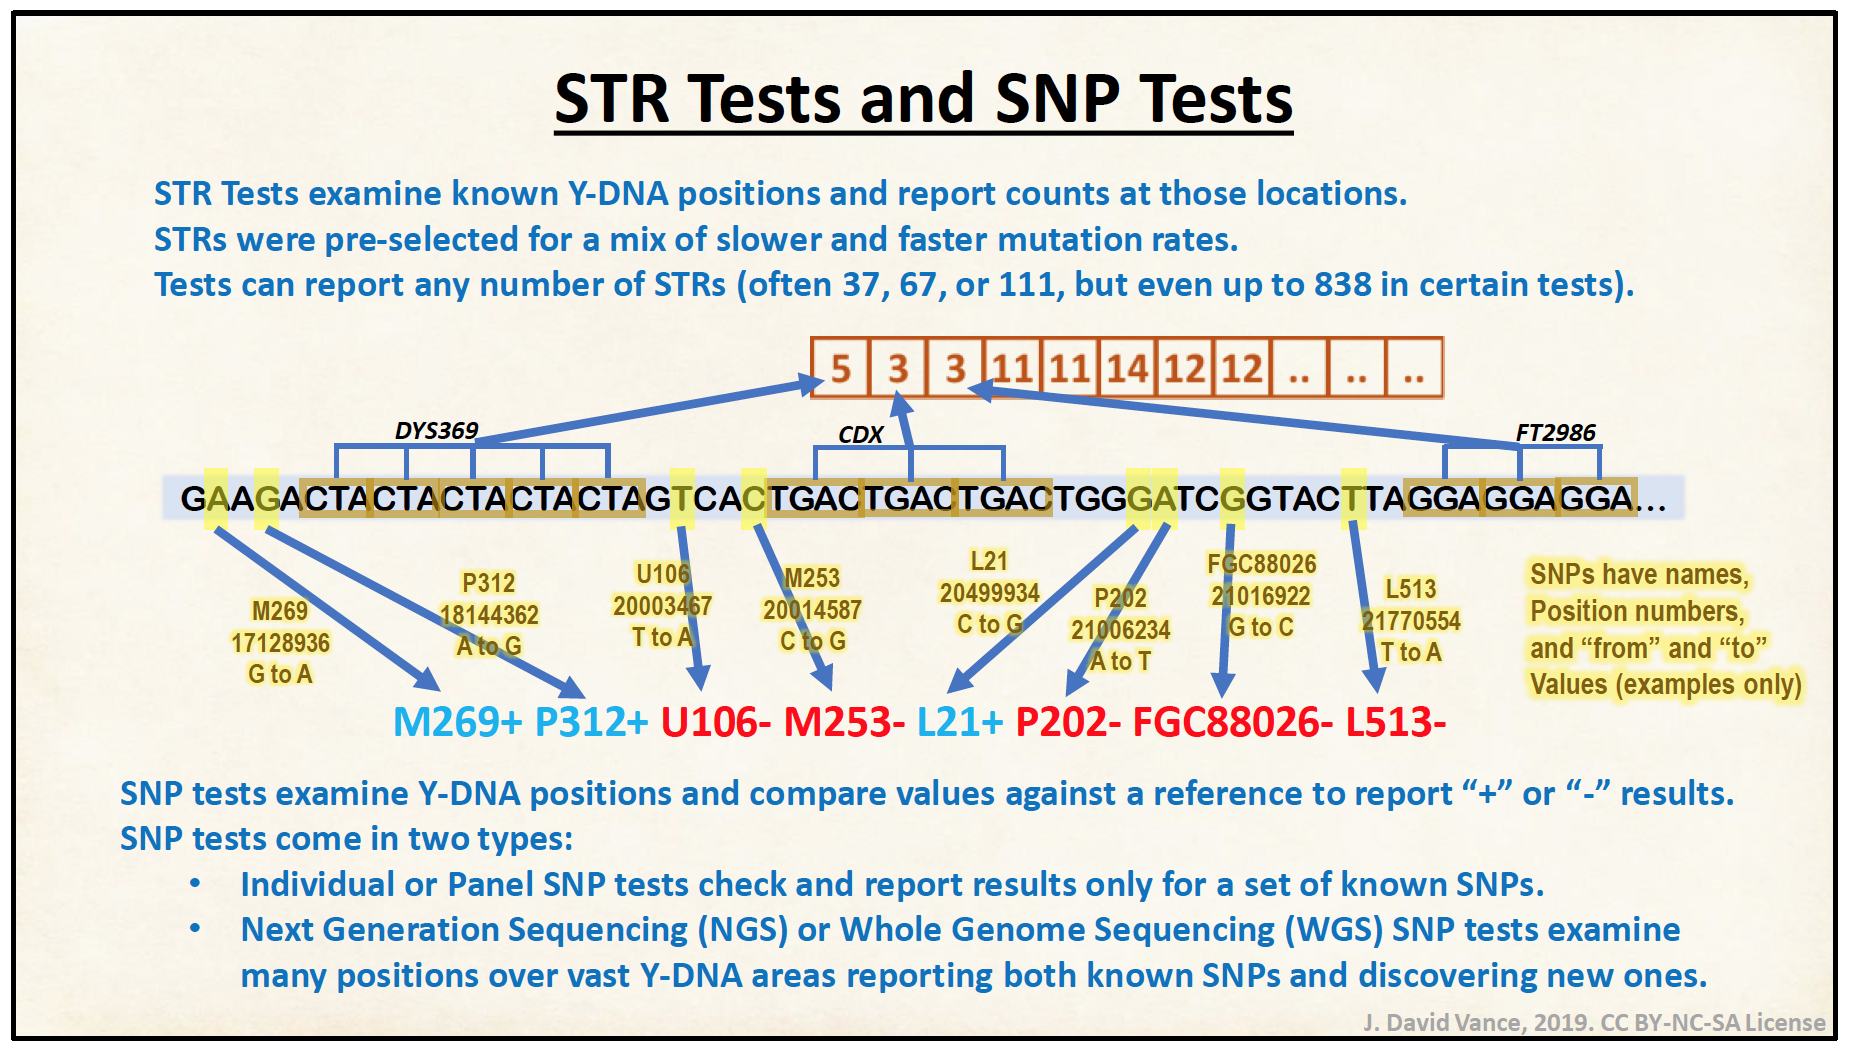
The bottom half of illustration 18 provides a look at SNPs. SNPs as indicated, examine specific single base pair positions in the DNA strand. They are highlighted in yellow in the illustration. For these specific SNP positions, actual SNP names are used but their positions are illustrative and not literal. Every SNP has a name, a label. In some cases brand-new SNPs are discovered and initially named by the lab doing the testing. They also have a position number that marks that SNP’s position on the Y-chromosome. SNPs also have a “from” and a “to” value, so the allele value can go, for example, from “G” to “A” and these values are known, because there is a “reference genome”. Based on the ancestral reference values, test results are then interpreted in terms of whether the SNP has mutated. In this illustrated example if the SNP position known as M269 has an the ancestral value of “G” and the test result is an “A” in this person’s DNA, we know that that SNP has mutated. The SNP would be noted with a plus sign and this person is “M269 positive”.
Continuing with the examples in illustration 18, going on to another SNP position, P312, the ancestral value is known to be an “A” and there is a “G”, so it is positive as well. For the third SNP, called U106, located at a different position, the ancestral value is supposed to be a “T” and it is a “T” in the example, so the SNP has not mutated and it is labeled as negative. Based on the unique combination of tested SNPs, a tester is then placed on the Y-DNA haplotree.
Having more SNPs and STRs sampled and tested will increase the reliability and accuracy of the results. For STR tests, one can test individual STRs or obtain panel results of a series of STRs. There are tests called “individual” or “panel” SNP tests which check a certain set of SNP positions.
The individual and panel tests are contrasted with what is called “Next-Generation Sequencing” or another kind of test called “Whole Genome Sequencing”, which are usually abbreviated as NGS and WGS. These tests examine a range of regions on the Y chromosome. Rather than target isolated SNPs, these tests report on any SNPs that are found in a specified area. These tests typically report on SNPs that are traditionally isolated in the panel tests as well as report the results of testing a few million other base pairs. That is how tests go “fishing” for new SNPs in a particular area of the Y chromosome where a SNP had not documented before and may result in novel findings. The NGS and WGS tests similar to the Big Y 700 test tend to be the more expensive tests. They provide results associated iwht the traditional Y DNA tests as well as the ‘exploratory’ results. The ‘fishing expedition’ tests are very powerful because they find new SNPs and report on new branches or subclades of existing haplogroups. They add to our knowledge of the haplotree where an individual or panel SNP test tends to be much cheaper but only goes after answering specific questions.
The Next Part of the Story: The One-Two Punch of SNPs and STRs
The next part of the story provides the results of using SNP and STR tests as they pertain to the Griff(is)(es)(ith) patrilineage.
Sources
Feature Image of the story is a modified version of an image found in Study of ‘Exceptional Responders’ Yields Clues to Cancer, Potential Treatments, NIH Record, Dec 11, 2020, Vol. LXXII, No. 25, https://nihrecord.nih.gov/2020/12/11/study-exceptional-responders-yields-clues-cancer-potential-treatments
[1] The following research sources are an excellent start to get your bearings on the history of genetic genealogy, understanding the basic concepts associated with the field, gaining a general understanding of what genetic genealogy is and how to interpret results:
J David Vance is personally the first stop I would make to quickly learn about genetic genealogy. The following are great sources of his work:
J David Vance, The Genealogist Guide to Genetic Testing, 2020, self published book
J. David Vance, DNA Concepts for Genealogy: Y-DNA Testing Part 1, 10 Oct 2019, https://youtu.be/RqSN1A44lYU
Part 1 of a 3-part introduction series to Y-DNA for genealogists. This first video focuses on “Why?” use Y-DNA for genealogy – what benefits does it offer and why should genealogists consider using Y-DNA as part of their research?
J. David Vance, DNA Concepts for Genealogy: Y-DNA Testing Part 2, 3 Oct 2019 https://www.youtube.com/watch?v=mhBYXD7XufI&t=355s
Part 2 of a 3-part introduction series to Y-DNA for genealogists. This second video focuses on “What?” for Y-DNA for genealogy – what are STRs and SNPs, what is genetic distance, what is the haplotree, and other related questions
J. David Vance, DNA Concepts for Genealogy: Y-DNA Testing Part 3, 10 Oct 2019 https://www.youtube.com/watch?v=03hRXVg9i1k&t=4s
Part 3 of a 3-part introduction series to Y-DNA for genealogists. This third video focuses on “How?” for Y-DNA for genealogy – how do I use the information provided by Y-DNA tests to advance my genealogy and/or my lineages?
David Reich’s seminal work in paleogenomics provides a lucid account on deep ancestry and ancient migratory history.
David Reich, Who We are and How We got Here, Ancient DNA and the New Science of the Human Past, New York: Vintage Books, 2018. This is an excellent overview of the history and recent accomplishments in the field of paleo-genetics or paleo-genomics.
Another source that provides historical background on the emergence genetic genealogy, see: Sheldon Krimsky, Understanding DNA Ancestry, Cambridge: Cambridge University Press, 2022
Y-DNA project help, International Society of Genetic Genealogy Wiki, This page was last edited on 28 October 2022, https://isogg.org/wiki/Y-DNA_project_help
[2] Mathieson I, Scally A (2020) What is ancestry? PLoS Genet 16(3): e1008624. https://doi.org/10.1371/journal.pgen.1008624 https://journals.plos.org/plosgenetics/article?id=10.1371/journal.pgen.1008624
[3] J David Vance, The Genealogist Guide to Genetic Testing, 2020
There are some subtle and some not so subtle differences between ancestry research and genealogy research, but in the end the two are inextricably linked; they are symbiotic processes –
You Say Potato, I Say Potahto – You Say Ancestry Research, I Say Genealogy Research. Let’s Call the Whole Thing On, RecordClick professional Genealogists, https://www.recordclick.com/you-say-potato-i-say-potahto-you-say-ancestry-research-i-say-genealogy-research-lets-call-the-whole-thing-on/
[4] John Hawkes, When did humankind’s last common ancestor live? A surprisingly short time ago, 0 Jul 2022, Weblog, https://johnhawks.net/weblog/when-did-humankinds-last-common-ancestor-live/
[5] The genome is the entire set of DNA instructions found in a cell. In humans, the genome consists of 23 pairs of chromosomes located in the cell’s nucleus, as well as a small chromosome in the cell’s mitochondria. A genome contains all the information needed for an individual to develop and function.
source: Genome: Definition, National Human Genome Research Institute, Page update 11 Aug 2022, https://www.genome.gov/genetics-glossary/Genome
[6] Autosomal DNA Statistics, International Society of Genetic Genealogy Wiki, Page was last edited 4 August 2022, Page accessed 14 Aug 2022, https://isogg.org/wiki/Autosomal_DNA_statistics
[7] Nicole Dyer, Charts for Understanding DNA Inheritance, 14 Aug 2019, Family Locket, Page accessed 10 Oct 2021, https://familylocket.com/charts-for-understanding-dna-inheritance/
[8] David Reich, Who We are and How We got Here, Ancient DNA and the New Science of the Human Past, New York: Vintage Books, 2018, pages 11-12
[9] Sheldon Krimsky, Understanding DNA Ancestry, Cambridge: Cambridge University Press, 2022, page 25
Working with STRs requires covering the topics of genetic distance and modal and ancestral haplotypes. Genetic distance , a concept created by Family Tree DNA (FTDNA), is a concept that ranks DNA matches or individuals according to how close they appear to be to each other. Genetic distance is the result of calculating the number of mutation events which have occurred between two or more individuals. The more STR’s sampled and compared , the more reliable is the estimate of genetic distance. Depending the the average rate of mutation for sampled markers, the number of differences between two samples (individuals) grows larger as the number of generations back to a common ancestor increases. FTDNA uses this idea to limit the number of matches shown in their match reports. If you have a 12 marker test, their cut off is a genetic distance of one (one mutation difference), for 37 markers the report cut off is at a genetical distance of 4, at 67 markers it is 7, and at 111 markers the report cut off s 10.
Genetic Distance, Wikipedia, page was last edited on 29 June 2022, https://en.wikipedia.org/wiki/Genetic_distance
M. Nei, Genetic Distance, in Standley Maloy & Kelly Hughes, ed, Brenner’s Encyclopedia of Genetics, second Edition, New York:Elsevier Inc, 2013, https://www.sciencedirect.com/topics/agricultural-and-biological-sciences/genetic-distance
Genetic Distance, International Society of Genetic Genealogy, page was last edited on 31 January 2017, https://isogg.org/wiki/Genetic_distance
Modal Haplotype, International Society of Genetic Genealology Wiki, This page was last edited on 31 January 2017, https://isogg.org/wiki/Modal_haplotype
Ancestral Haplotype, International Society of Genetic Genealology Wiki, This page was last edited on 31 January 2017, https://isogg.org/wiki/Ancestral_haplotype
the Most Recent Common Ancestor, International Society of Genetic Genealology Wiki, This page was last edited on 31 January 2017, https://isogg.org/wiki/Most_recent_common_ancestor
[10] The illustration of a haplotree and a family tree is from: Understanding DNA, FamilyTreeDNA , https://www.familytreedna.com/understanding-dna.aspx?intent=&gclid=Cj0KCQjwl92XBhC7ARIsAHLl9amGAQgLA88oTpLktNa4qWNr8MUPmb6aApGoSrvXL98o-plhnoNw6SgaAvSGEALw_wcB
The dendrogram is an illustration of the comparative analysis of results of males who completed Y-DNA tests from Family Treee DNA (FTDNA) who share common genetic ancestors .
[11] What Percentage of Native American Do You Have To Be To Enroll With a Tribe?, Powwows.com, January 8th, 2018, Last Updated on: April 4th, 2022, Page accessed 6 May 2021, https://www.powwows.com/much-percentage-native-american-enroll-tribe/
[12] There are countless articles documenting personal experiences associated with taking and interpreting genetic tests from the major companies that illustration the problem of confusing genealogical, genetic and cultural ancestry. Here are a few:
Newton, Maud, America’s Ancestry Craze: Making sense of our family-tree obsession, Harper’s Magazine, Page accessed 5 Jun 2021
Wagner, Alex, A Journalist Seeks Out Her Roots but Finds Few Answers in the Soil, NPR Terry Gross Interview, 30 April 30 2018, Page accessed 11 Mar 2021
Dava Stewart, Problems with Ancestry DNA Analyses, Dark Daily, Oct 12, 2018
Leavenworth, Stuart, Ancestry wants your spit, your DNA and your trust. Should you give them all three?, 29 May 2018
Brown, Kristen, How DNA Testing Botched My Family’s Heritage, and Probably Yours, Too, 16 Jan 2018, Page accessed 11 Mar 2021
Raffi Khatchadourian, How Your Family Tree Could Catch a Killer, The New Yorker, November15, 2021
Resnick, Brian, The limits of ancestry DNA tests, explained, Vox, Updated 23 May 23 2019, Page accessed 11 Mar 20212
Saey, Tina , What I actually learned about my family after trying 5 DNA ancestry tests, Sience News, 13 Jun 2018, Page accessed 12 Jan 2021
Saey, Tina, What genetic tests from 23andMe, Veritas and Genos really told me about my health, Science News, 22 May 2018
Saey, Tina, Consumer DNA testing promises more than it delivers, Science News, 22 may 2018
Barry Starr, 5 Myths About Ancestry DNA Estimates, Blog article at Ancestry.com, 27 Sep 2021, Accessed 18 Mar 2022
Maya Jasanoff, Obsession with Ancestry Has Some Twisted Roots, 9 May 2022, New Yorker Newsletter, Published in the print edition of the May 9, 2022, issue, with the headline “Ancestor Worship.”
[13] Racimo F, Sikora M, Vander Linden M, Schroeder H, Lalueza-Fox, C, Beyond broad strokes: sociocultural insights from the study of ancient genomes. Nat Rev Genet. 2020 Jun; 21(6): 355-366. doi: 10.1038/s41576-020-0218-z. Epub 2020 Mar 3. PMID: 32127690. https://www.nature.com/articles/s41576-020-0218-z#citeas
[14] Bridget Alex and Priya Moorjani, DNA dating: How molecular clocks are refining human evolution’s timeline, 6 Apr 2017, the Conversation, https://theconversation.com/dna-dating-how-molecular-clocks-are-refining-human-evolutions-timeline-65606
[15] X-DNA is usually tested along with other chromosomes as part of an atDNA test. Until recently X-DNA analysis tools were only available as third-party tools and at 23andMe. Even with access to the X-DNA data, the lack of tools and the different inheritance pattern for X-DNA have caused many genealogists to ignore X-DNA data when it can narrow down the lines to be searched, allowing for efficient use of our research time. See for example: Debbie Parker Wayne, Using X-DNA for genealogy, National Genealogical Society Magazine, July-September 2014 · volume 40, number 3, Pages 57-61. https://www.ngsgenealogy.org/wp-content/uploads/2019/05/Debbie-Parker-Wayne-Using-X-DNA-for-Genealogy-National-Genealogical-Society-Magazine-40-July-September-2014-57-61.pdf
[16] Chelsea Toledo and Kirstie Saltsman, Genetics by the numbers, National Insitute of General Medical Sciences, Posted 12 Jun 2012, https://www.nigms.nih.gov/education/Inside-Life-Science/Pages/genetics-by-the-numbers.aspx
Length of Human DNA, Dodona – online exercise platform for learning to code, Ghent University, Page accessed 20 Jun 2022, https://dodona.ugent.be/en/activities/434589381/
Elizabeth Penesi, Watch the human genome fold itself in four dimensions, Science, 10 Oct 2017, Page accessed 6 May 2022, https://www.science.org/content/article/watch-human-genome-fold-itself-four-dimensions
Veratas Genetics, Size Matters: A Whole Genome is 6.4B Letters, Veratas Genetics, 28 Jul 2017, Page accessed 27 Jul 2022, https://www.veritasgenetics.com/our-thinking/whole-story/
Fundamental Concepts of Genetics and about the Human Genome, Eupedia, Page accessed 7 Jul 2022, https://www.eupedia.com/genetics/human_genome_and_genetics.shtml
Hannah Ashworth, How Long is Your DNA? BBC Science Focus Magazine, Page accessed 14 Jun 2022, https://www.sciencefocus.com/the-human-body/how-long-is-your-dna/
Ruairi J. Mackenzie, DNA vs RNA – 5 Key differences and Comparison Technology Networks Genomics Research 18 Dec 2020, Updated31 Mar 2021 https://www.technologynetworks.com/genomics/lists/what-are-the-key-differences-between-dna-and-rna-296719
Genetics Glossary, International Society of Genetic Genealogy Wiki, This page was last edited on 9 October 2021, page accessed on 10 Oct 2021
[17] Fundamental Concepts of Genetics and about the Human Genome, Eupedia, page accessed 3 Feb 2021, https://www.eupedia.com/genetics/human_genome_and_genetics.shtml
Sheldon Krimsky, Understanding DNA Ancestry, Cambridge: Cambridge University , 2022, Page 18
[18] Jake Buehler, The Complex Truth About ‘Junk DNA’, Quanta Magazine, 1 Sep 2021, https://www.quantamagazine.org/the-complex-truth-about-junk-dna-20210901/
Non-coding DNA, Wikipedia, This page was last edited on 2 September 2022, https://en.wikipedia.org/wiki/Non-coding_DNA
[19] Sheldon Krimsky, Understanding DNA Ancestry, Cambridge: Cambridge University , 2022, Page 18
[20] Non-Coding DNA, AncestryDNA Learning Hub, https://www.ancestry.com/c/dna-learning-hub/junk-dna
Wojciech Makalowski, What is junk DNA, and what is it worth?, Scientific American, 12 Feb 2007, https://www.scientificamerican.com/article/what-is-junk-dna-and-what/
[21] Khushi Jain, Karyotype and Karyotyping – definition, Procedure, and Applications, 5 May 2022, The Biology Notes, Page accessed 8 Aug 2022, https://thebiologynotes.com/karyotype-karyotyping/
Samanthi, Difference Between Karyotype and Idiogram, Difference Between, August 27, 2019, page accessed 4 Aug 2022, https://www.differencebetween.com/difference-between-karyotype-and-idiogram/
Human Genome, Wikipedia, This page was last edited on 1 September 2022, https://en.wikipedia.org/wiki/Human_genome
[22] Ancestry Information Markers, National Human Genome Research Institute, https://www.genome.gov/genetics-glossary/Ancestry-informative-Markers
Joon-Ho You, Janelle S. Taylor, Karen L. Edwards, Stephanie M. Fullerton, What are our AIMs? Interdisciplinary Perspectives on the Use of Ancestry Estimation in Disease Research, National Library of Medicine, 2012 Nov 5. doi: 10.1080/21507716.2012.717339
Huckins, L., Boraska, V., Franklin, C. et al. Using ancestry-informative markers to identify fine structure across 15 populations of European origin. Eur J Hum Genet 22, 1190–1200 (2014). https://doi.org/10.1038/ejhg.2014.1
[23] Leonard M. Fleck, 22 Apr 2021, If Whole Genome Sequencing is So Cheap and Quick, Why Shouldn’t Everyone Have It Done?, Michigan State Bioethics, center for Bioethics and Social Justice at Michigan State University, https://msubioethics.com/2021/04/22/whole-genome-sequencing-why-shouldnt-everyone-have-it-done-fleck/
Kris A. Wetterstrand, The Cost of Sequencing a Human Genome, National Human Genome Research Institute, National Institute of Health, 1 Nov 2021, https://www.genome.gov/about-genomics/fact-sheets/Sequencing-Human-Genome-cost
Emily Mullen, The Era of Fast, Cheap Genome Sequencing Is Here, 29 Sep 2022, Wired, https://www.wired.com/story/the-era-of-fast-cheap-genome-sequencing-is-here/
[24] Sheldon Krimsky, Understanding DNA Ancestry, Cambridge: Cambridge University , 2022, Page 23
Blaine Bettinger, The Family Tree Guide to DNA Testing and Genetic Genealogy, 2nd Edition, Penguin Random House LLC, 2016
Diana Elder, NicoleDyers and Robin Wirthlin, Research Like a Pro with DNA: A Genealogist’s Guide to Finding and Confirming Ancestors with DNA Evidence, Highland UT: Family Locket Books, 2021
R.C. Lewontin, The Apportionment of Human Diversity, Evolutionary Biology, 6:381, 1972
K.L. Hunley, G.S. Cabana, J.C. Long The Apportionment of Human Diversity Revisited, American Jounral of Physical Anthropology, 160: 5561-569
Noah A. Rosenberg, Jonathan K. Pritchard, James L. Weber, Howard M. Can, Kenneth K. Kidd, Lev A. Zhivotovsky, Marcus W. Feldman , Genetic Structure of Human Populations, Science, 20 Dec 2002, Vol 298, Issue 5602, pp. 2381-2385, https://www.science.org/doi/abs/10.1126/science.1078311
[25] David Reich, Who We are and How We got Here: Ancient DNA and the New Science of the Human Past, New York: Vintage Books, 2018, page 4
[26] J David Vance, The Genealogist Guide to Genetic Testing, 2020, page 221
[27] J David Vance, The Genealogist Guide to Genetic Testing, 2020, Chapter 13
[28] Chris Gunter, Single Nucleotide Polymorphisms (SNPS), 10 May 2022, National Human Genome Research Institute, https://www.genome.gov/genetics-glossary/Single-Nucleotide-Polymorphisms
What are single nucleotide polymorphisms (SNPs)?, MedlinePlus, National Library of Medicine, https://medlineplus.gov/genetics/understanding/genomicresearch/snp/
Single-nucleotide polymorphism, Wikipedia, page was last edited on 11 November 2022, https://en.wikipedia.org/wiki/Single-nucleotide_polymorphism
SNP’s, Genetics Generation, https://knowgenetics.org/snps/
Making SNPs Make sense, Learn Genetics, Genetic Science Learning Center, https://learn.genetics.utah.edu/content/precision/snips
How do geneticists indicate the location of a gene?, Page last updated 26 Mar 2021, National, MedlinePlus, Library of Medicine, https://medlineplus.gov/genetics/understanding/howgeneswork/genelocation/
[29] See: Private variant vs novel variant vs singleton, FamilyTree DNA Forum , 31 May 2021, 330714-private-variant-vs-novel-variant-vs-singleton
- A novel variant is a new SNP.
- A private variant is also a new SNP, but one found in a particular line, not yet among other testers. It seems that a private variant is also a novel variant.
- A singleton is unique to one tester and his haplogroup; the only difference in the definition between this and a private variant seems to be the added condition of how a singleton is unknown where it is placed among other subclades.
Novel SNP, YFullDefinitions, https://www.yfull.com/faq/definitions/
[30] J David Vance, The Genealogist Guide to Genetic Testing, 2020, self published book, Chapters 6 and 13
J. David Vance, DNA Concepts for Genealogy: Y-DNA Testing Part 2, 3 Oct 2019 https://www.youtube.com/watch?v=mhBYXD7XufI&t=355s
Part 2 of a 3-part introduction series to Y-DNA for genealogists. This second video focuses on “What?” for Y-DNA for genealogy – what are STRs and SNPs, what is genetic distance, what is the haplotree, and other related questions
[31] STRs vs SNPs, Multiple DNA Personalities, DNAeXplained – Genetic Genealogy, 10 Feb 2014, https://dna-explained.com/2014/02/10/strs-vs-snps-multiple-dna-personalities/
[32] YHRD R68, Locus Information on DYS393, https://yhrd.org/details/locus_information/DYS393DYS393, STRBase (SRD-130), National Institute of Standards and Technology, last updated 7 Feb 2008, https://strbase.nist.gov//str_y393.htm
[33] STR Analysis, Wikipedia, page was last edited 25 Oct 2022, https://en.wikipedia.org/wiki/STR_analysis
Microsatellite, Wikipedia, page was last edited 25 Oct 2022, https://en.wikipedia.org/wiki/Microsatellite
Terry Taylor, What is STR Analysis?, 2 Mar 2011, This article appeared in NIJ Journal Issue 267, March 2011, as a sidebar to the article Extending the Time to Collect DNA in Sexual Assault Cases by Terry Taylor.
Has Fan, Jai-You Chu, A Brief Review of Short Tandem RepeatMutation, Genomics Proteomics Bioinformatics. 2007; 5(1): 7–14. Published online 2007 Jun 15. doi: 10.1016/S1672-0229(07)60009-6
Short Tandem Repeat, International Society of Genetic Genealology Wiki, page was last edited on 31 January 2017, https://isogg.org/wiki/Short_tandem_repeat
Bits de Cliencia Official, The Best Review of STRs (Short tandem repeat) Mutation | Applied to the Forensic Video, 23 Sep 2015, https://www.youtube.com/watch?v=9bEAJYnVVBA A concise video explaining the reliability of forensic DNA.
Fundamental Concepts of Genetics and about the Human Genome, Eupedia, page accessed 3 Feb 2021, https://www.eupedia.com/genetics/human_genome_and_genetics.shtml
Genetics Glossary, International Society of Genetic Genealogy Wiki, This page was last edited on 9 October 2021, https://isogg.org/wiki/Genetics_Glossary
J. David Vance, DNA Concepts for Genealogy: Y-DNA Testing Part 1, 10 Oct 2019, https://youtu.be/RqSN1A44lYU Part 1 of a 3-part introduction series to Y-DNA for genealogists. This first video focuses on “Why?” use Y-DNA for genealogy – what benefits does it offer and why should genealogists consider using Y-DNA as part of their research?
J. David Vance, DNA Concepts for Genealogy: Y-DNA Testing Part 2, 3 Oct 2019 https://www.youtube.com/watch?v=mhBYXD7XufI&t=355s Part 2 of a 3-part introduction series to Y-DNA for genealogists. This second video focuses on “What?” for Y-DNA for genealogy – what are STRs and SNPs, what is genetic distance, what is the haplotree, and other related questions
J. David Vance, DNA Concepts for Genealogy: Y-DNA Testing Part 3, 10 Oct 2019 https://www.youtube.com/watch?v=03hRXVg9i1k&t=4s Part 3 of a 3-part introduction series to Y-DNA for genealogists. This third video focuses on “How?” for Y-DNA for genealogy – how do I use the information provided by Y-DNA tests to advance my genealogy and/or my lineages?
J David Vance, The Genealogist Guide to Genetic Testing, 2020 https://www.amazon.com/Genealogists-Guide-Testing-Genetic-Genealogy/dp/B085HQXF4Z/ref=tmm_pap_swatch_0?_encoding=UTF8&qid=&sr=
Michael Hébert, Y-DNA Testing Company STR Marker Comparison Chart, Last updated on January 08, 2012, http://www.gendna.net/ydnacomp.htm
Kayser et al. (2004), A Comprehensive Survey of Human Y-Chromosomal Microsatellites Am. J. Hum. Genet., 74 1183-1197. NB online only data file
Krahn, Thomas. “Y-STR fingerprint – Panels” (PDF). Price List DNA-Fingerprint – Genealogy Testing Services. Retrieved 11 August 2012.
Butler, John M. (9 January 2012). “Y-Chromosome STRs”. Short Tandem Repeat DNA. NIST Standard Reference Database SRD 130. Retrieved 11 August 2012.
Butler, John; Kline, Decker (2009-06-29). “Summary List of Y Chromosome STR Loci and Available Fact Sheets”. NIST Standard Reference Database SRD 130. Retrieved 11 August 2012.
State of the Y-Chromosome for Human Identity Testing: John Butler talk at Canadian Forensic DNA Technology Workshop (June 8, 2005)
L. Gusma ̃, J.M. Butler, A. Carracedo, P. Gill, M. Kayser, W.R. Mayr, N. Morling, M. Prinz, L. Roewer, C. Tyler-Smithj, P.M. Schneider, DNA Commission of the International Society of Forensic Genetics (ISFG): An update of the recommendations on the use of Y-STRs in forensic analysis, Forensic Science International 157 (2006) 187–197, https://strbase.nist.gov//pub_pres/ISFG_YSTRupdate_FSI2006.pdf
Y STR Positions along Y Chromosome, STRBase (SRD-130) National Institute of Standards and technology,, U.S. Department of Commerce, https://strbase.nist.gov//ystrpos1.htm
Y-STR Reference Bibliography, STRBase (SRD-130) National Institute of Standards and technology, U.S. Department of Commerce, https://strbase.nist.gov//ystr_ref.htm
J David Vance, The Genealogist Guide to Genetic Testing, 2020, Chapter 13
SNP-based age analysis methodology: a summary, Summarised description of the age analysis pipeline — Iain McDonald, June 2017, https://www.jb.man.ac.uk/~mcdonald//genetics/pipeline-summary.pdf
Albers PK, McVean G (2020) Dating genomic variants and shared ancestry in population-scale sequencing data. PLoS Biol 18(1): e3000586. https://doi.org/10.1371/journal.pbio.3000586
National Library of Medicine, Genetics, What are single nucleotide polymorphisms (SNPs)? Page accessed 1 Oct 2022, https://medlineplus.gov/genetics/understanding/genomicresearch/snp/
Dmitry Adamov, Sergey Karzhavin, Vadim Urasin, Vladimir M. Gurianov, vladimir Tagankin, Defining a New Rate Constant for Y-Chromosome SNPs based on Full Sequencing Data, 21 March 2015, The Russian Journal of Genetic Genealogy (Русская версия): Том 7, №1, 2015 год ISSN: 1920-2997 http://ru.rjgg.org
[34] J David Vance, The Genealogist Guide to Genetic Testing, 2020, Chapter 17
[35] Roberta Estes, STRs vs SNPs, Multiple DNA Personalities, DNAeXplained – Genetic Genealogy, 10 Feb 2014, https://dna-explained.com/2014/02/10/strs-vs-snps-multiple-dna-personalities/
Unique-event polymorphism, International Society of Genetic Genealogy Wiki, This page was last edited on 23 February 2021, https://isogg.org/wiki/Unique-event_polymorphism
Unique-event polymorphism. Wikipedia, This page was last edited on 21 June 2020. Unique-event_polymorphism
[36] J David Vance, The Genealogist Guide to Genetic Testing, 2020, Chapter 6
With enough time and enough possible combinations of mutations, it is possible to end up with matching or closely matching Y-DNA marker results in individuals who do not share a “recent” common ancestor on the male line. Convergence is more plausible in individuals belonging to common haplogroups. See, Convergence, International Society of Genetic Genealogy Wiki, Page last updated 6 Dec 2018
Rob Spencer has a cogent explanation of convergence: See quote below and reference: Robert W. Spencer Convergence, Tracking Back: a website for genetic genealogy tools, experimentation, and discussion, no date, page accessed 3 May 2022.
“The men in question actually are related — this is key — but in a particular way and usually long before the genealogical time span of a couple of hundred years. A group of modern descendants might not care if they have a common ancestor who lived in 1000 AD — but it really matters.”
[37] Unique Event Polymorphism, Bionity.com, https://www.bionity.com/en/encyclopedia/Unique_event_polymorphism.html
[38] Roberta Estes Y-700: The Forefront of Y Chromosome Testing, 7 Jun 2017, FamilyTree DNA Blog, https://blog.familytreedna.com/human-y-chromosome-testing-milestones/
Roberta Estes, FamilyTree DNA Blog, Why Big Y-700? 21 Oct 2022, https://blog.familytreedna.com/why-big-y-700/
Roberta Estes, Working with Y DNA – Your Dad’s Story, FamilyTree DNA Blog. 5 Jun 2017, https://dna-explained.com/2017/06/05/working-with-y-dna-your-dads-story/
[39] J David Vance, The Genealogist Guide to Genetic Testing, 2020, Chapter 15
[40] SNPs are given names based on an abbreviation that indicates the lab or research team that discovered the SNP and a number that indicates the order in which it was discovered. The prefix, the first letter or group of letters after the main alpha Haplogroup letter identifies the lab or analysis company which first discovered the SNP or was really the first to decide that the mutation at that position on the Y- chromosome was worthy of a name.
SNPs development indicated by beginning letters:
A = Thomas Krahn, MSc (Dipl.-Ing.), YSEQ.net, Berlin, Germany
ACT = Ancient-Tales Institute of Anthropology, Enlighten BioTech Co., Ltd., Shanghai, China
AD = Dr. Mohammed Al Sharija, Ministry of Education (Kuwait)
AF = Fernando Mendez, Ph.D., University of Arizona, Tucson, Arizona
ALK = Ahmad Al Khuraiji
AM or AMM = Laboratory of Forensic Genetics and Molecular Archaeology, UZ Leuven, Leuven, Belgium
B = Estonian Genome Centre
BY = Big Y testing (next generation sequencing) discovered with the BigY-500, Family Tree DNA, Houston, Texas
BZ = Q-M242 Project, Family Tree DNA, Houston, TX. SNPs named in honor of Barry Zwick.
CTS = Chris Tyler-Smith, Ph.D., The Wellcome Trust Sanger Institute, Hinxton, England
DC = Dál Cais, an Irish group believed to be descended from Cas, b. CE 347, related to SNP R-L226; Dennis Wright
DF = anonymous researcher using publicly available full-genome-sequence data, including 1000 Genomes Project data; named in honor of the DNA-Forums.org genetic genealogy community
E = Bulat Muratov
F = Li Jin, Ph.D., Fudan University, Shanghai, China
F* = Chuan-Chao Wang, Hui Li, Fudan University, Shanghai, China (Beginning letter F; second letter Haplogroup, i.e. FI is Fudan Haplogroup I)
FGC = Full Genomes Corp. of Virginia and Maryland
FT = Big Y testing (next generation sequencing)discovered with the Big Y-700, Family Tree DNA, Houston, Texas
G = Verónica Gomes, IPATIMUP Instituto de Patologia e Imunologia Molecular da Universidade do Porto (Institute of Molecular Pathology and Immunology of the University of Porto)
GG=Vavilov Institute of General Genetics, Russian Academy of Sciences, Moscow, Russia
IMS-JST = Institute of Medical Science-Japan Science and Technology Agency
JD = David Stedman using Big Y and other NGS sources.
JFS = John Sloan
JN = Jakob Nortsedt-Moberg
K = Youngmin JeongAhn, Ph.D; Education: Seoul National University and the University of Arizona
KHS = Functional Genomics Research Center, Korea Research Institute of Bioscience and Biotechnology
KL = Key Laboratory of Contemporary Anthropology, School of Life Sciences and Institutes of Biomedical Sciences, Fudan University, Shanghai, China
KMS = Segdul Kodzhakov; Albert Katchiev; Anatole Klyosov; Astrid Krahn; Thomas Krahn; Bulat Muratov; Chris Morley; Ramil Suyunov; Vadim Sozinov; Pavel Shvarev; SF “National clans DNA project”; EHP “Suyun” Ph.D. of Technical Science; Prof. Elsa Khusnutdinova, Sc.D. of Biological Sciences, Laboratory of Molecular Human Genetics, Institute of Biochemistry and Genetics, Ufa Research Centre, Russian Academy of Sciences
L = Thomas Krahn, MSc (Dipl.-Ing.) formerly of Family Tree DNA’s Genomics Research Center; snps named in honor of the late Leo Little
M = Peter Underhill, Ph.D. of Stanford University
MC = Christopher McCown, University of Florida; Thomas Krahn, MSc (Dipl.-Ing.), YSEQ.net, Berlin, Germany
MF = 23mofang BioTech Co., Ltd., Chengdu, China
MPB = Thomaz Pinotti and Fabrício R. Santos, Laboratório de Biodiversidade e Evolução Molecular (LBEM), Universidade Federal de Minas Gerais, Brazil
MZ = Hamma Bachir, Ph.D., E-M183 Project
N = The Laboratory of Bioinformatics, Institute of Biophysics, Chinese Academy of Sciences, Beijing
NWT = Northwest Territory, Theodore G. Schurr, Ph.D., Laboratory of Molecular Anthropology, University of Pennsylvania, Philadelphia, PA
P = Michael Hammer, Ph.D. of University of Arizona
Page, PAGES or PS = David C. Page, Whitehead Institute for Biomedical Research
PF = Paolo Francalacci, Ph.D., Università di Sassari, Sassari, Italy
PH = Pille Hallast, Ph.D., University of Leicester, Department of Genetics, United Kingdom
PK = Biomedical and Genetic Engineering Laboratories, Islamabad, Pakistan
PLE = Stanislaw Plewako, M. Sci, Baltic Sea DNA Project.
PR = Primate (gorilla and chimpanzee), Thomas Krahn’s WTTY. Some sources have not provided new names when same mutation found independently in humans.
RC = Major Rory Cain, BA(hons), BEd, BSc.
S = James F. Wilson, D.Phil. at Edinburgh University
SA = South America, Theodore G. Schurr, Ph.D., Laboratory of Molecular Anthropology, University of Pennsylvania, Philadelphia, PA
SK = Mark Stoneking, Ph.D., Max Planck Institute for Evolutionary Anthropology, Leipzig, Germany
SUR = Southern Ural; SF “National clans DNA project”; B.A. Muratov; EHP “Suyun” Ph.D. of Technical Sciences; Ramil Suyunov; Prof. E.K. Khusnutdinova, Sc.D. of Biological Sciences, Laboratory of Molecular Human Genetics, Institute of Biochemistry and Genetics, Ufa Research Centre Russian Academy of Sciences; Alexander Zolotarev; Igor Rozhanskii; Bayazit Yunusbaev, Institute of Biochemistry and Genetics, Ufa Research Centre, Russian Academy of Sciences
TSC = Gudmundur A. Thorisson and Lincoln D. Stein, The SNP Consortium, Cold Spring Harbor Laboratory, Cold Spring Harbor, NY
U = Lynn M. Sims, University of Central Florida; Dennis Garvey, Ph.D. Gonzaga University; and Jack Ballantyne, Ph.D., University of Central Florida
V = Rosaria Scozzari and Fulvio Cruciani, Dipartimento di Biologia e Biotecnologie “Charles Darwin” , Sapienza Università di Roma, Rome, Italy.
VK = Viacheslav Kudryashov.
VL = Vladimir Volkov, Tomsk University, Russia
Y = Y Full Team (Russian) using data from published and commercial next-generation sequencing samples
YP = SNPs identified by citizen scientists from genetic tests, then submitted to the Y Full team for verification.
YSC = Thomas Krahn, MSc (Dipl.-Ing.) formerly of Family Tree DNA’s Genomics Research Center
Z = Gregory Magoon, Ph.D., Richard Rocca, Vince Tilroe, David F. Reynolds, Bonnie Schrack, Peter M. Op den Velde Boots, Ray H. Banks, Roman Sychev, Victar Mas, Steve Fix, Christian Rottensteiner, Alexander R. Williamson, Ph.D., John Sloan and an anonymous individual, independent researchers of publicly available whole genome sequence datasets, and Thomas Krahn, MSc (Dipl.-Ing.), with support from the genetic genealogy community.
ZP = Peter M. Op den Velde Boots, David Stedman using Big Y and other NGS sources.
ZQ = Gabit Baimbetov, Nurbol Baimukhanov “ShejireDNA project” and other members of the project.
ZS = Gregory Magoon, Ph.D., Aaron Salles Torres from samples from Full Genomes and the Big Y.
ZW = Michael W. Walsh using Big Y.
ZZ = Alex Williamson. Mutations in palindromic regions. Each ZZ prefix represents two possible SNP locations.
Source: Y-DNA Haplogroup Tree 2019-2020, version 15.73, 11 July 2020, Internal Society of Genetic Genealogy, https://isogg.org/tree/
A SNP discovered or identified by YFull starts with a “Y”; a SNP starting with a “BY” or “FT” was named by Family Tree DNA, a “FGC” SNP was named by Full Genomes Corporation, and an “A” SNP was named by YSEQ. An ‘M’ stands for the Human Population Genetics Laboratory at Stanford University.
[41] John M. Butler, Recent developments in Y-single tandem repeat and Y-single nucleotide polymorphism analysis; Forensic Science Review Volume 15, Number Two, July 2003, https://strbase.nist.gov//pub_pres/Butler2003b.pdf
Peter Gill, Oskar Hansen, Hinda Haned, Øyvind Bleka, Corina Benschop in Forensic Practitioner’s Guide to the Interpretation of Complex DNA Profiles, 2020
[42] At FamilyTreeDNA, the Big Y 700 test tests up to 838 Y-chromosome DNA short tandem repeat (STR) markers. The following link provides information on all markers offered in these test panels
Y-STR Results Guide, FamilyTree DNA Help Center, https://help.familytreedna.com/hc/en-us/articles/4408063356303-Y-STR-Results-Guide-#panel-1-1-12–0-0
[43] Publications and Presentations from the NIST Human Identity Project Team (DNA Forensics and Biometrics) SSTR Base (SRD-130), National Institute of Standards and Technology, U.S. Department ope Commerce, Last Updated: 06/29/2009. https://strbase.nist.gov//NISTpub.htm
John M. Butler, in Advanced Topics in Forensic DNA Typing: Methodology, 2012 in John Butle, Forensic DNA Typing: Methodology, 2012 New York: Academic Press, Elsevier Inc.
Jay A. Siegel, Pekka J. Saukko and Max M. Houck, Editors in Chief, Encyclopedia of Forensic Schemes, 2013, Elsevier Ltd., https://www.sciencedirect.com/referencework/9780123821669/encyclopedia-of-forensic-sciences
S. Short, DNA Basic Principles, in Encyclopedia of Forensic and Legal Medicine (Second Edition), 2016 https://doi.org/10.1016/B978-0-12-800034-2.00151-8
[44] John Butler, Margaret C. Kline, and Amy E. Decker, Addressing Y-Chromosome Short Tandem Repeat Allele Nomenclature , Journal of Genetic Genealogy, 4(2): 125-148, 2008, https://strbase.nist.gov//pub_pres/Butler2008-JoGG-YSTR-nomenclature.pdf
John Butler, Recent Developments in Y-Short Tandem Repeat and Y-Single Nucleotide Polymorphism Analysis Forensic Science Review 15:91, 2003, https://strbase.nist.gov//pub_pres/Butler2003b.pdf
Hanson EK, Ballantyne J (2006) Comprehensive annotated STR physical map of the human Y chromosome: forensic implications Legal Med., 8:110-120; see also http://ncfs.ucf.edu/ystar/ystar.html
Kayser M, Kittler R, Ralf A, Hedman M, Lee AC, Mohyuddin A, Mehdi SQ, Rosser Z, Stoneking M, Jobling MA, Sajantila A, Tyler- Smith C (2004) A comprehensive survey of human Y-chromosomal microsatellites. , 74(6):1183-1197.
See: List of Y-STR markers, Wikipedia, page was last edited on 12 April 2022, https://en.wikipedia.org/wiki/List_of_Y-STR_markers
Hao Fan, A Brief Review of Short Tandem Repeat Mutation, Genomics, Proteomics & Bionformatics, Volume 5, Issue 1, 2007, Pages 1-7, https://www.sciencedirect.com/science/article/pii/S1672022907600096
Summary List of Y chromosome STR Loci and Available Fact Sheets, (STRBase (SRD-130) National Institute of Standards and Technology, U.S. Department ope Commerce, Last Updated: 06/29/2009 https://strbase.nist.gov//ystr_fact.htm
For general information on Short Tandem Repeats:
Christian M. Ruitberg, Dennis J. Reeder, John M. Butler, STRBase: a short tandem repeat DNA database for the human identity testing community, Nucleic Acids Research, Aug 31 2001, Vol 29, No. 1, 320-322, https://strbase.nist.gov/images/STRBase.pdf
Y STR Positions along Y Chromosome, STRBase (SRD-130), National Institute of Standards and Technology, U.S. Department of Commerce, https://strbase.nist.gov//ystrpos1.htm
Michael L. Hébert, Y-DNA Testing Company STR Marker Comparison Chart, Last updated on January 08, 2012, http://www.gendna.net/ydnacomp.htm
Y-STR Results Frequently Asked Questions, Family Tree DNA Help Center, https://help.familytreedna.com/hc/en-us/articles/4408071453711-Y-STR-Results-Frequently-Asked-Questions-#what-are-the-differences-between-snps-and-strs–0-0
J David Vance, Chapter 5 Introducing Short Nucleotide Polymorphisms (SNPs) & Chapter 13 The Genetics of STRs and SNPs, The Genealogist Guide to Genetic Testing, 2020
Wyner N, Barash M, McNevin D. Forensic Autosomal Short Tandem Repeats and Their Potential Association With Phenotype. Front Genet. 2020 Aug 6;11:884. doi: 10.3389/fgene.2020.00884 . PMID: 32849844; PMCID: PMC7425049. https://www.ncbi.nlm.nih.gov/pmc/articles/PMC7425049/
YHRD R68, Mutation Rates, https://yhrd.org/pages/resources/mutation_rates
The following reference is a bit dated but accurate. It reflects the relative position of various STR markers on the Y chromosome:
Chromosomal Locations for DNA Typing Markers, STRBase (SRD – 130), National Institute of Standards and Technology, U.S. Department of Commerce, Last updated: 11/17/2011 https://strbase.nist.gov/chrom.htm
Y STR Positions along Y chromosome, STRBase (SRD – 130), National Institute of Standards and Technology, U.S. Department of Commerce , https://strbase.nist.gov/ystrpos1.htm
Butler, J.M., Kline, M.C., Decker, A.E. (2008) Addressing Y-chromosome short tandem repeat (Y-STR) allele nomenclature. Journal of Genetic Genealogy 4(2): 125-148
Publications and Presentations from the NIST Human Identity Project Team (DNA Forensics and Biometrics) SSTR Base (SRD-130), National Institute of Standards and Technology, U.S. Department ope Commerce, Last Updated: 06/29/2009. https://strbase.nist.gov//NISTpub.htm
Summary List of Y Chromosome STR Loci and Available Fact Sheets, STRBase (SRD-130), National Institute of Standards and Technology, U.S. Department of Commerce, Last Updated: 06/29/2009 https://strbase.nist.gov//ystr_fact.htm
Y STR Positions along Y Chromosome, STRBase (SRD-130), National Institute of Standards and Technology, U.S. Department of Commerce, https://strbase.nist.gov//ystrpos1.htm
[45] J David Vance, Chaper Chapter 5 Introducing Short Nucleotide Polymorphisms (SNPs) & Chapter 13 The Genetics of STRs and SNPs, The Genealogist Guide to Genetic Testing, 2020
[46] Fotsing SF, Margoliash J, Wang C, Saini S, Yanicky R, Shleizer-Burko S, Goren A, Gymrek M. The impact of short tandem repeat variation on gene expression. Nat Genet. 2019 Nov;51(11):1652-1659. doi: 10.1038/s41588-019-0521-9. Epub 2019 Nov 1. PMID: 31676866; PMCID: PMC6917484. https://www.ncbi.nlm.nih.gov/pmc/articles/PMC6917484/pdf/nihms-1540630.pdf
[47] Y-STR Results Guide, FamilyTree DNA Help Center, https://help.familytreedna.com/hc/en-us/articles/4408063356303-Y-STR-Results-Guide-#panel-4-48-60–0-4
Caleb Davis, Michael Sager, Göran Runfeldt, Elliott Greenspan, Arjan Bormans, Bennett Greenspan, and Connie Bormans, Big Y 700 White paper, March 27, 2019, https://blog.familytreedna.com/wp-content/uploads/2018/06/big_y_700_white_paper_compressed.pdf
Marty Brady, Y Chromosomes and the SNPs STRs, May 16 2020 Presentation, Albuquerque Genealogical Society, Ychromosome_slides.pdf
Ian McDonald, Exploring new Y-DNA Horizons with Big Y-700 19 Oct 2019, presentation was originally given as part of Genetic Genealogy Ireland 2019. https://familytreewebinars.com/webinar/exploring-new-y-dna-horizons-with-big-y-700/]
[48] The DYS, DYZ, and DYF prefixes for STRs are part of the scientific name for a short tandem repeat (STR) found on the Y chromosome. STR markers are named according to guidelines published by the HUGO Gene nomenclature committee (HUGO). For Y-DNA STR tests:
- D stands for DNA.
- Y stands for Y chromosome.
- S, Z, and F stand for the complexity of the repeat segment as follows:
- S is a unique segment.
- Z is a number of repetitive segments at one site.
- F is a segment that has multiple copies on the Y chromosome.
The FTY prefix stands for “Family Tree Y”. This prefix acts as a placeholder until HUGO assigns an official prefix to these STRs.
Hester M. Wain, Elspeth A. Bruford, Ruth C. Lovering, Michael J. Lush, Mathew W. Wright, and Sue Povey, Guidelines for Human Gene Nomenclature, Appendix 1: Gene Symbol Use in Publicaitions, Genomics Vol 79, Number 4, April 2002, page 469, doi:10.1006/geno.2002.6748, available online at http://www.idealibrary.com, also https://www.genenames.org/files/PMID11944974.pdf
[49] The list of the 111 STRs and their mutation rates are found in: J David Vance, Chapter Chapter 5 Introducing Short Nucleotide Polymorphisms (SNPs) & Chapter 13 The Genetics of STRs and SNPs, The Genealogist Guide to Genetic Testing, 2020
Other sources for information on STRs:
Summary List of Y Chromosome STR Loci and Available Fact Sheets, STRBase (SRD-1300, National Institute of Standards and Technology, U.S. Department of Commerce, Last Updated: 06/29/2009 https://strbase.nist.gov//ystr_fact.htm
Y STR Positions along Y Chromosome, STRBase (SRD-130), National Institute of Standards and Technology, U.S. Department of Commerce, https://strbase.nist.gov//ystrpos1.htm
DYS393, STRBase (SRD-130), National Institute of Standards and Technology, last updated 7 Feb 2008, https://strbase.nist.gov//str_y393.htm
YHRD R68, Locus Information on DYS393, https://yhrd.org/details/locus_information/DYS393
[50] J David Vance, Chaper Chapter 5 Introducing Short Nucleotide Polymorphisms (SNPs) & Chapter 13 The Genetics of STRs and SNPs, The Genealogist Guide to Genetic Testing, 2020
[51] J David Vance, The Genealogist Guide to Genetic Testing, 2020, self published book.
The book represents an expanded version of the information in videos below and is available in book form (Kindle and printed versions) at https://www.amazon.com/Genealogists-G…
J. David Vance, DNA Concepts for Genealogy: Y-DNA Testing Part 1, 10 Oct 2019, https://youtu.be/RqSN1A44lYU
Part 1 of a 3-part introduction series to Y-DNA for genealogists. This first video focuses on “Why?” use Y-DNA for genealogy – what benefits does it offer and why should genealogists consider using Y-DNA as part of their research?
A PDF of the slides used in this video is available at https://drive.google.com/open?id=14xA… A readable transcript of the narration in the video (for those who prefer to read than listen) is available at https://drive.google.com/open?id=1CdU…
J. David Vance, DNA Concepts for Genealogy: Y-DNA Testing Part 2, 3 Oct 2019 https://www.youtube.com/watch?v=mhBYXD7XufI&t=355s
Part 2 of a 3-part introduction series to Y-DNA for genealogists. This second video focuses on “What?” for Y-DNA for genealogy – what are STRs and SNPs, what is genetic distance, what is the haplotree, and other related questions
A PDF of the slides used in this video is available at https://drive.google.com/open?id=1vS2… A readable transcript of the narration in the video (for those who prefer to read than listen) is available at https://drive.google.com/open?id=1dCb…
J. David Vance, DNA Concepts for Genealogy: Y-DNA Testing Part 3, 10 Oct 2019 https://www.youtube.com/watch?v=03hRXVg9i1k&t=4s
Part 3 of a 3-part introduction series to Y-DNA for genealogists. This third video focuses on “How?” for Y-DNA for genealogy – how do I use the information provided by Y-DNA tests to advance my genealogy and/or my lineages?
A PDF of the slides used in this video is available at https://drive.google.com/open?id=1HPP…A readable transcript of the narration in the video (for those who prefer to read than listen) is available at https://drive.google.com/open?id=1-IL…
[52] Ibid
[53] Rob Spencer, STR Clades, Tracking Back a website for genetic genealogy tools, experimentation, and discussion, http://scaledinnovation.com/gg/gg.html?rr=strclades
[54] J. David Vance, DNA Concepts for Genealogy: Y-DNA Testing Part 1, 10 Oct 2019, https://youtu.be/RqSN1A44lYU
Part 1 of a 3-part introduction series to Y-DNA for genealogists. This first video focuses on “Why?” use Y-DNA for genealogy – what benefits does it offer and why should genealogists consider using Y-DNA as part of their research?
Rob Spencer, Why use STR data and not SNP data?, Tracking Back a website for genetic genealogy tools, experimentation, and discussion, http://scaledinnovation.com/gg/gg.html?rr=whystr
[55] Much of this discussion on using STRs and SNPs is from from J. David Vance. In addition to his book, he has three YouTube presentations that provide a direct and comprehensive treatment of genetic genealogy, the strategy of Y-DNA testing, and the basic concepts of the field.
J David Vance, The Genealogist Guide to Genetic Testing, 2020, self published book.
The book represents an expanded version of the information in videos below and is available in book form (Kindle and printed versions) at https://www.amazon.com/Genealogists-G…
A PDF of the slides used in this video is available at https://drive.google.com/open?id=14xA… A readable transcript of the narration in the video (for those who prefer to read than listen) is available at https://drive.google.com/open?id=1CdU…
J. David Vance, DNA Concepts for Genealogy: Y-DNA Testing Part 2, 3 Oct 2019 https://www.youtube.com/watch?v=mhBYXD7XufI&t=355s
Part 2 of a 3-part introduction series to Y-DNA for genealogists. This second video focuses on “What?” for Y-DNA for genealogy – what are STRs and SNPs, what is genetic distance, what is the haplotree, and other related questions
A PDF of the slides used in this video is available at https://drive.google.com/open?id=1vS2… A readable transcript of the narration in the video (for those who prefer to read than listen) is available at https://drive.google.com/open?id=1dCb…
J. David Vance, DNA Concepts for Genealogy: Y-DNA Testing Part 3, 10 Oct 2019 https://www.youtube.com/watch?v=03hRXVg9i1k&t=4s
Part 3 of a 3-part introduction series to Y-DNA for genealogists. This third video focuses on “How?” for Y-DNA for genealogy – how do I use the information provided by Y-DNA tests to advance my genealogy and/or my lineages?
A PDF of the slides used in this video is available at https://drive.google.com/open?id=1HPP…A readable transcript of the narration in the video (for those who prefer to read than listen) is available at https://drive.google.com/open?id=1-IL…